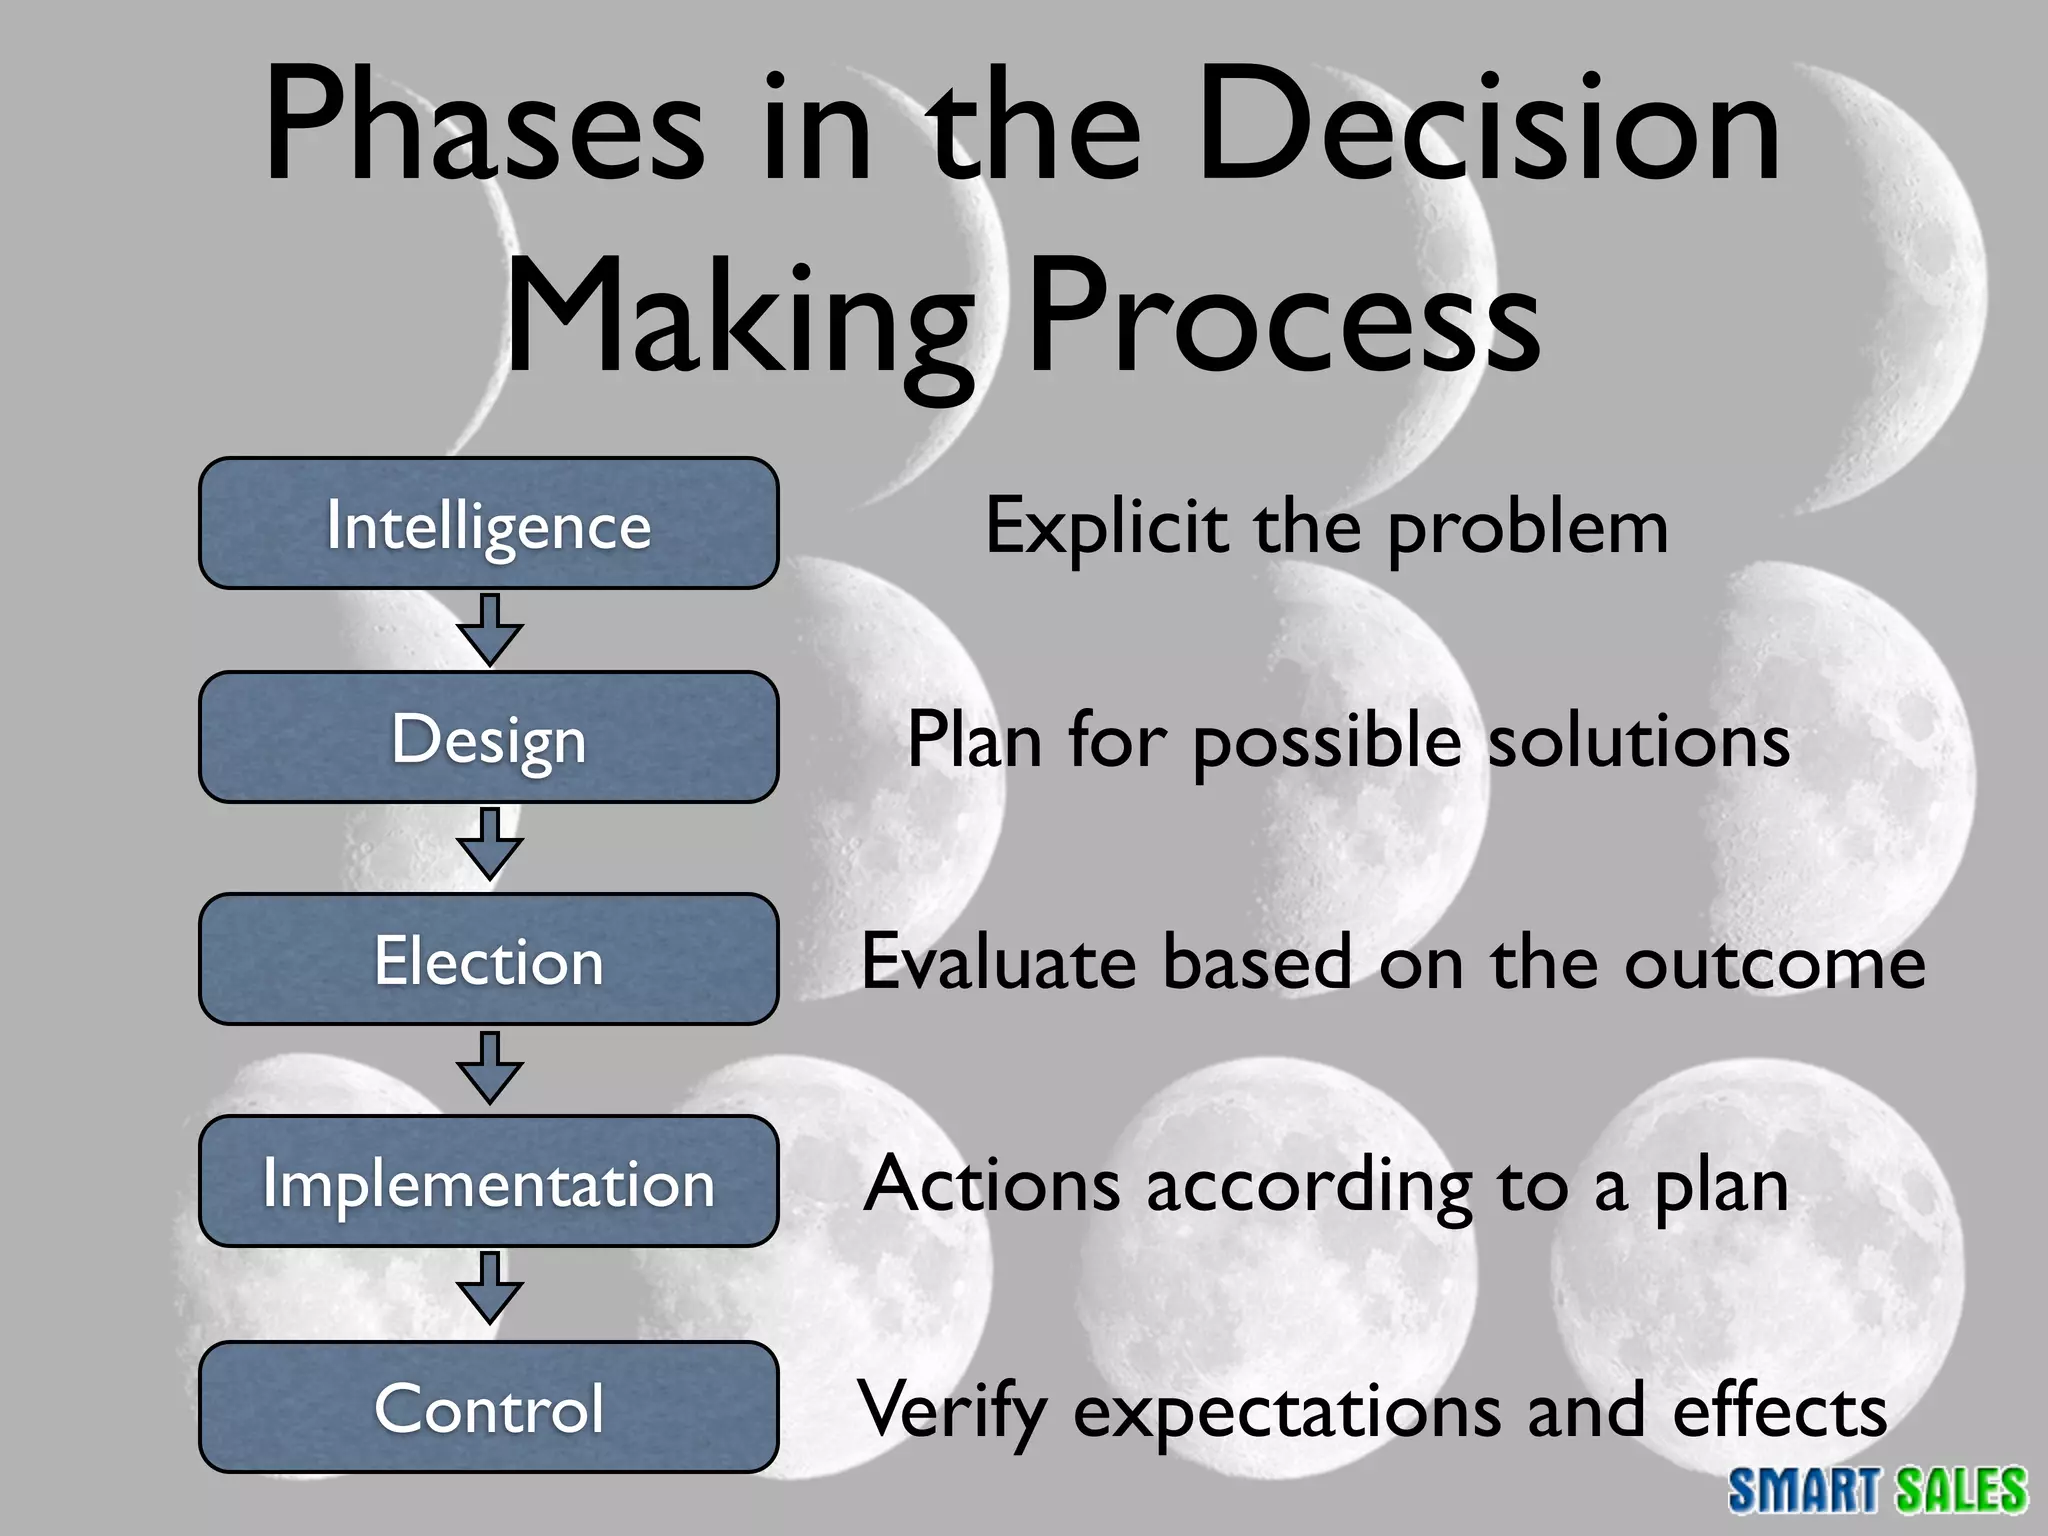
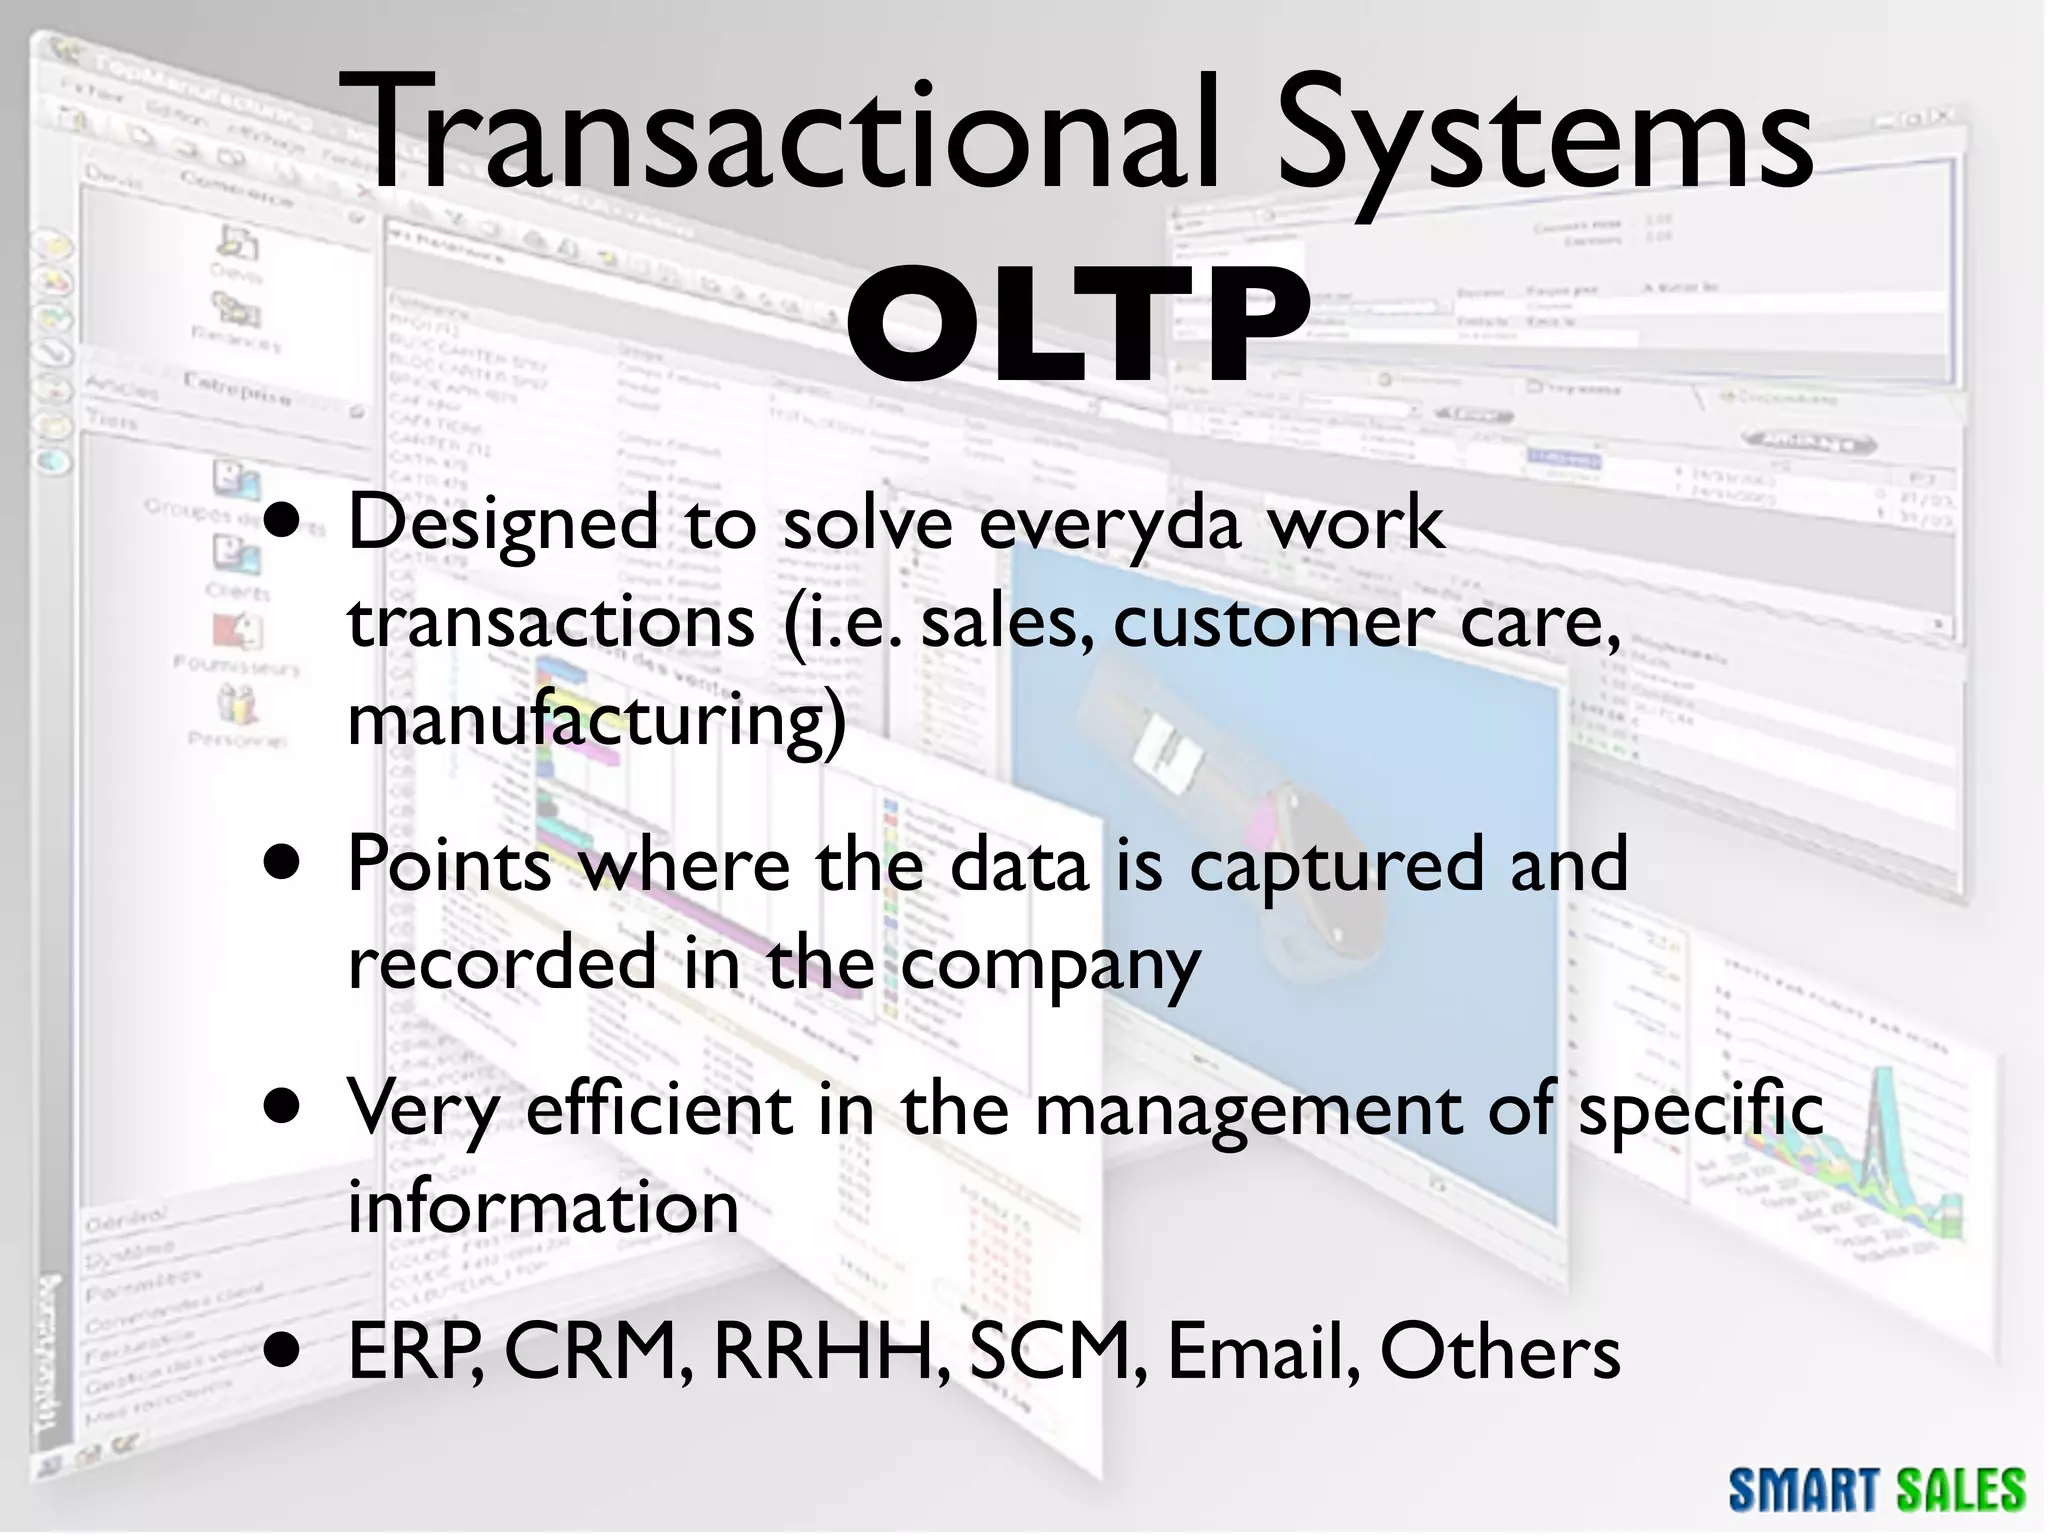
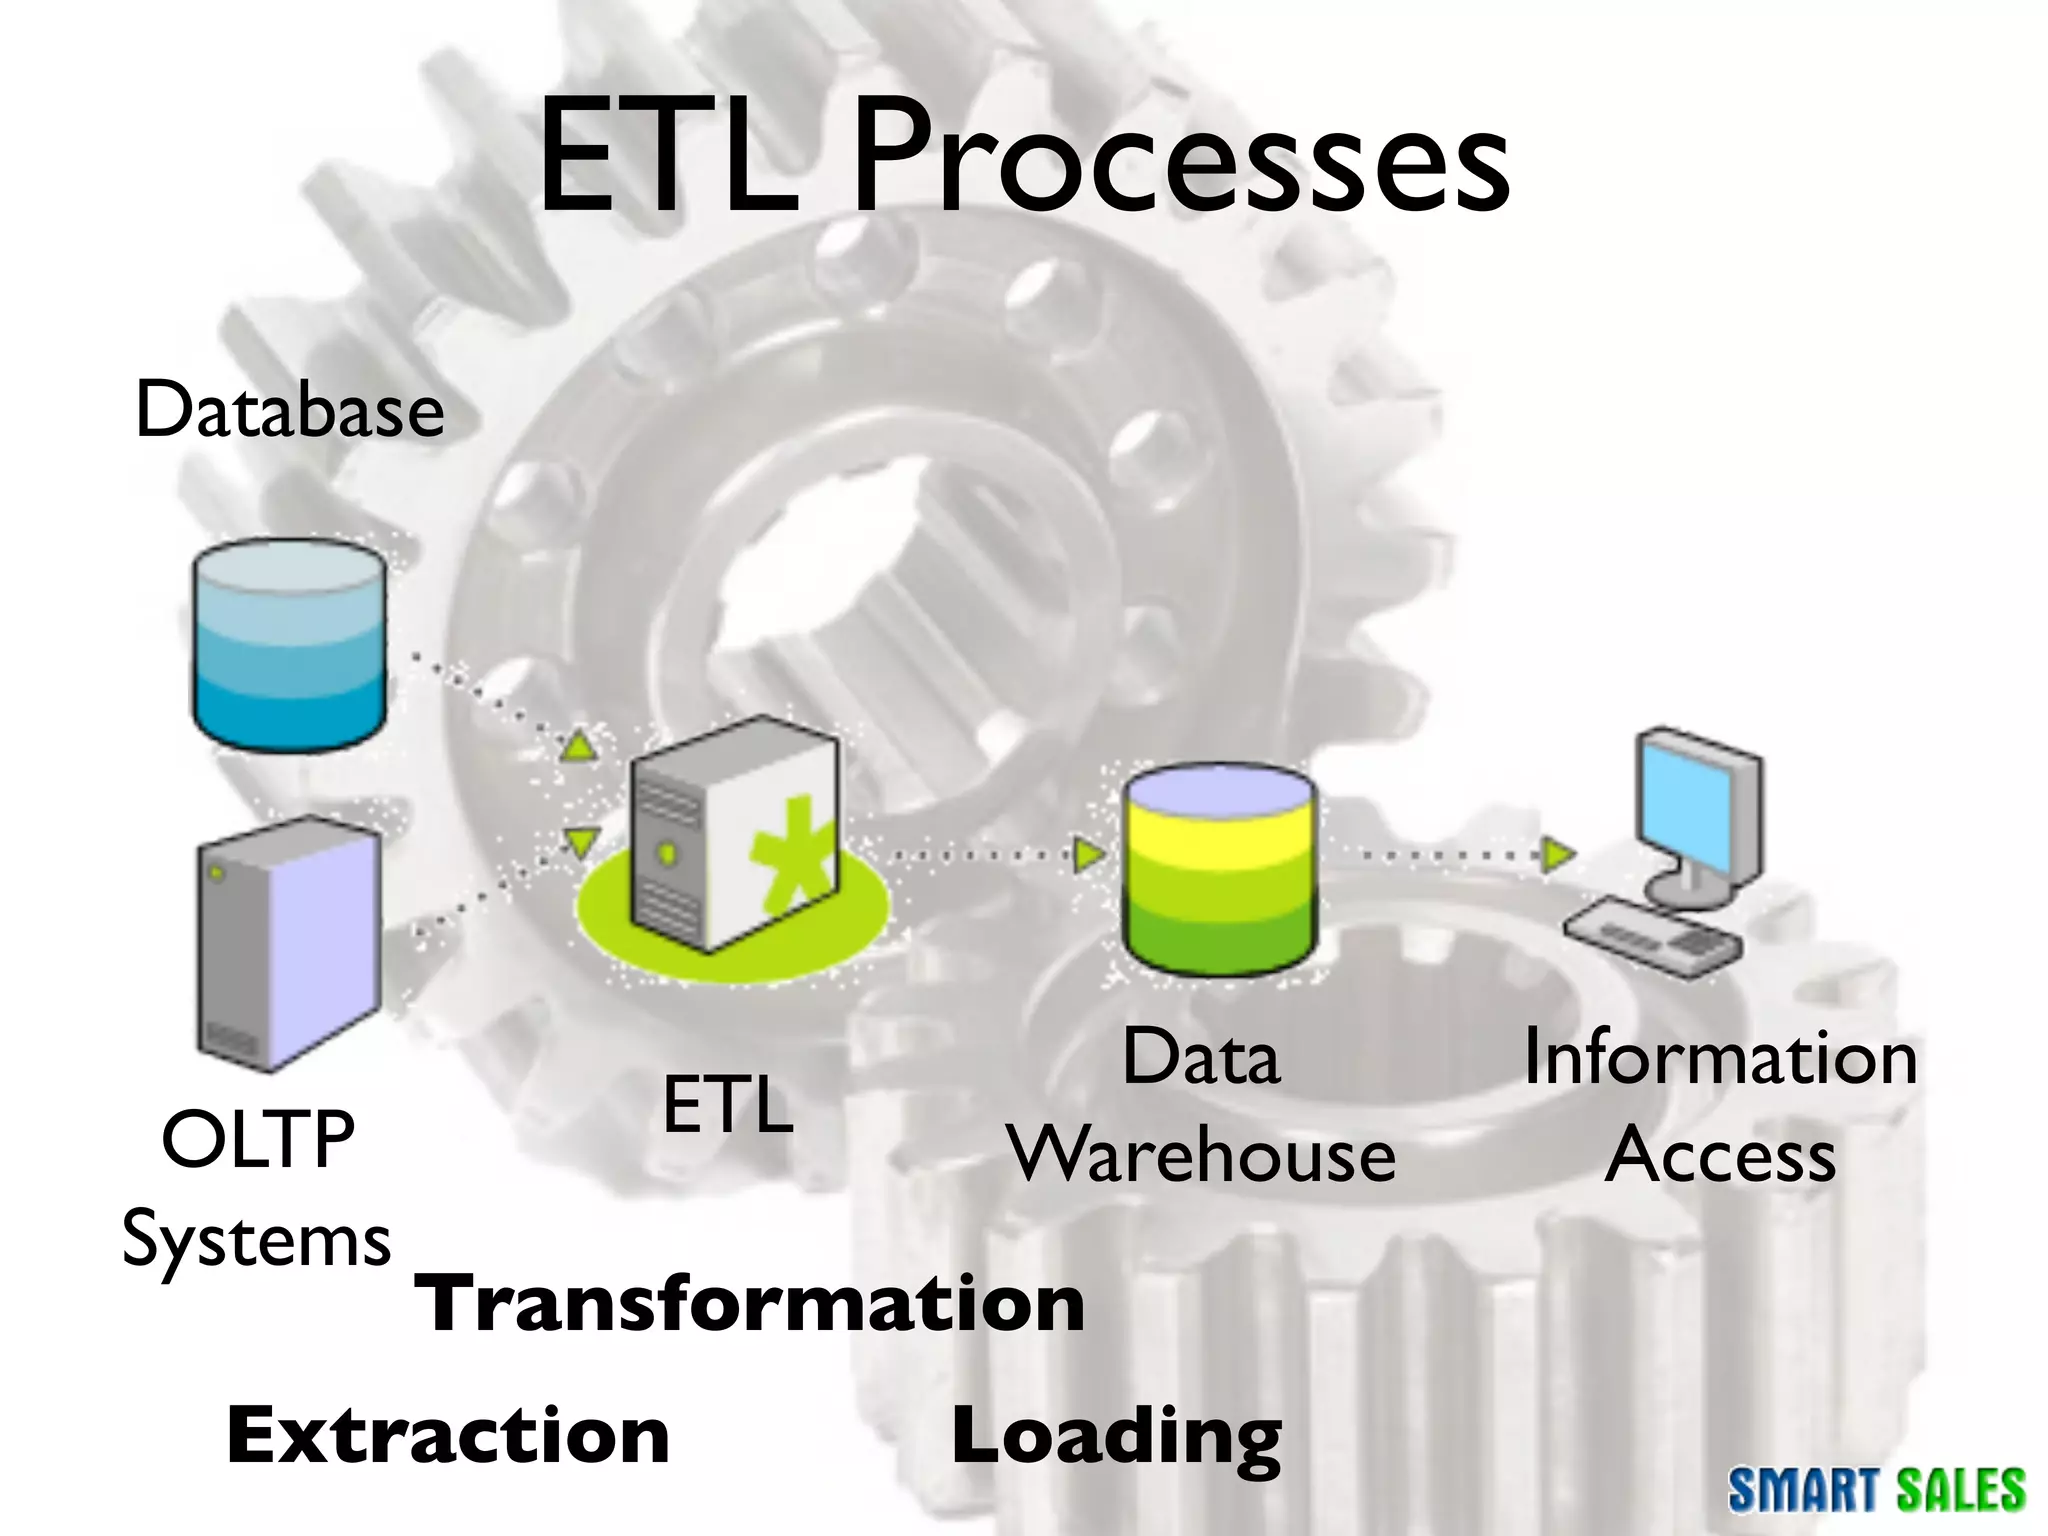
Business Intelligence
    What is BI?
      (Part 1 of 2)
How do I make decissions
     in my business?
• How does the company make decissions? Using
  intuition? You have to make business decisions based
  on reality (facts and numbers!)
• EPM (Enterprise Performance Management) is a
  management style focused on measuring companies
• Several Methodologies / Strategies:
 • Balanced Scorecard
 • Six Sigma, ABC - Activity Based Costing, TQM - Total
    Quality Management
Phases in the Decision
   Making Process
 Intelligence       Explicit the problem

   Design         Plan for possible solutions

   Election      Evaluate based on the outcome

Implementation   Actions according to a plan

   Control       Verify expectations and effects
Types of decisions
              Structured   Semi structured   Non structured

 Strategic


  Tactic


Operational
I need information!
• All of these methodologies are based in several
  numeric indicators
• “If you can’t measure it, you can’t manage it”
• Indicators come from “day-to-day reality” (main
  street)
• Monthly outcome, Number of complaints filed
  per product, Number of satisfied customers,
  Returns
• Data exists, but ...
Different Points of View (1)
•   The CEO says “We need to sell more”

•   Marketing Mgr thinks “What can we offer to our
    customers?”

•   To do this, we need to know: What are the most sold
    products? What bundles are the most successful?

•   Who can provide us with this information? Because, we
    already have this information, don’t we?

•   IT Mgr, while upgrading platforms and implementing a new
    CRM system, estimates that the information will be available
    in 20-30 days...
Different Points of View (2)
•   Marketing Mgr asks: A month!? Didn’t we have this kind of
    information in our servers already?

•   IT Mgr answers:Yes, the data is there, but it doesn’t have the
    right structure to answer the questions you’re asking

•   Marketing Mgr keeps thinking that if the data is there, it can’t
    be so difficult to get the answers they need

•   IT Mgr keeps thinking that Marketing Mgt always asks for
    weird things, and with not time at all

•   And the CEO just wanted to sell more!
Business Problem

• Where is the problem?
• Marketing Mgr is right: the data IS in the servers
• IT Mgr is also right: is not easy to give data the right
  structure to answers questions
• For IT is just enough to deal with data, Marketing
  needs to extract information from this data.
Data and information
      are not the same
• Companies always maintain several systems to run
  their everyday business
• All of the company workers add and check data from
  this systems all the time
• However sometimes this data, presented in this way,
  is not enough to make business decisions
Data, Information and
     Knowledge
• Data: entity and transactions stored as
  structures and codes
• Information: is the outcome of processing and
  extraction of data, with specific domain
  meaning to those who access it
• Knowledge: Information becomes knowledge
  when is used to make decisions and take
  actions accordingly
What is Business Intelligence?
 • Is a set of processes, technologies, applications and
   practices used to provide information and support
   the decision making process
 • It is NOT a standard software product, it is
   specifically designed by consulting and targeted to a
   particular business need
 • There is a series of technology tools that support
   this objective
 • To better understand this, a new type of systems
   categorization appears:
   OLTP (Transactional) and OLAP (Analytical)
What is BI?
 SCD
          MOLAP                RDBMS             ROLAP
ODS     Data Warehouse         ETL           Forecasting
                                         Analytics
          Analytics   Data Mining    Clustering      EIS
HOLAP       Alerting        KPI       Reporting OLAP
     Alerting
                Time Series
                               Key Performance Indicators
        Dashboards
                     Sales Intelligence
 MDM                                           Data Mart
                 Knowledge Discovery
Online Analytical Processing              Data Integration
Transactional Systems
         OLTP
• Designed to solve everyda work
  transactions (i.e. sales, customer care,
  manufacturing)
• Points where the data is captured and
  recorded in the company
• Very efficient in the management of specific
  information
• ERP, CRM, RRHH, SCM, Email, Others
Problems and Disadvantages
• Relational Databases were designed for everyday
  work and not for analysis
• It is difficult to manage historical information
• Data is distributed among multiple systems and
  databases. How and where do you gather all of the
  systems data?
• To extract information from data you need knowledge
  of non-trivial skills (programming or SQL language)
  and is not a dynamic process
Analytical Systems
            OLAP
• OLTP Systems complement
• Designed specifically to obtain information, analyze
  and solve business problems
• Specific analytical information is added to the data
• They use a different database technology, optimized to
  extract information.
• Analytical systems unify all of the company’s data in
  one system: the Data Warehouse
What is a Data Warehouse?
 • Is a digital warehouse with all of the electronic
   registered data in a company
 • They store all of the company’s information:
   daily and historical data
 • They gather heterogeneous information sources
   in one centralized space
 • It is used for reporting, data analysis and
   exploration, to see and detect changes and
   tendencies
 • Only two operations exist: load and query
Data Warehouse or
         Data Mart?
• A Data Warehouse contains all of the
  company’s information (wide scope, higher risk
  project)
• A Data Mart is targeted to solve one
  company’s department needs in particular
  (limited scope, lower risk project)
• The Data Warehouse can be built joining
  multiple specific Data Marts
DWh Objectives
•   Must allow easy access to the company’s
    information

•   Must present this information in a consistent way

•   Must be adaptable and change-resilient

•   Must be a safe store, protecting the company’s
    information assets

•   Must support the decision making process

•   Must be accepted by the decision makers to be
    successful
DWh Challenges

• Has to unify the whole company’s data model
• Data latency
• Historical data storage
• Data granularity
• Speed and performance in queries
• Independent of OLTP system changes
How do we build a DWh?
• ETL processes Extract the information from
  transactional systems, Transform this information and
  they Load it into the data warehouse
• The information is stored in multidimensional
  databases
• Information is ready to be used
• The systems to access information are easy to use,
  you don’t have to work at NASA!
Dimensional Modelling (1)
 • This is what makes a Data Warehouse a
   business oriented database
 • Measures. Business Variables
  • Numerical values
  • Sums, consolidations, arithmetic operations
 • Dimensions
  • Texts
  • Filters
Dimensional Modelling (2)
  Time    Date-ID
                      Facts
Dimension Year                    Product-ID
          Month         Date-ID
                     Date-ID      SKU
          Day        Product-ID
                     Branch-ID    Description
                                  Category
                     Total        Type
         Branch-ID
                     # Products   Price
         Country
                     # Tickets
         State                     Product
 Branch City                      Dimension
Dimension
Why is it multidimensional?
• A dimension is one of
  the “edges” of your
  business
 • Customers              • It is called
                            multidimensional
 • Invoices                 because you can see
                            the information from
 • Orders                   different “edges” at
 • Quotes                   the same time

 • Time
 • Activities
ETL Processes
Database


                        Data      Information
 OLTP          ETL
                      Warehouse      Access
Systems
          Transformation
  Extraction         Loading
What’s in a cube?
               Time


                                                             ts
                                                          uc
                                                        od
                            967
   Jan Feb Mar Apr


                                                      Pr
                                     540


                                                     P4
                            967


                                                 P3
                                                P2
                      780                  P1
Clients
                     Josh Sarah Joe Anna
Data Warehouse
 Database Technology

• MOLAP : Multi Dimensional
• ROLAP : Relational
• HOLAP : Hybrid
How do I “see” what’s in
       a DWh?
 • OLAP Cubes
 • Reports
 • Dashboards
 • KPIs - Key Performance Indicators
 • Alerts
OLAP Cubes
• They let you analyze all of the information available
  in the Data Warehouse
• Each cube stores a set of specific information, and
  contains different “measures” and “dimensions”
  • Measures are numbers (i.e. amounts, quantities,
    percentages)
  • Dimensions contain attributes to filter and order
    information
• Several visualization tools: Excel, Reports, Web
Some cubes
• Sales
• Stock
• Suppliers
• Orders
• Accounting...
• Human Resources...
• Finances...
• Dimensions
              Sales
 • Date / Time
 • Customer
 • Branch / Store
 • Product
 • Discount
• Measures
 • Quantity
 • Cost
 • Profit
Stock / Inventory
• Dimensions
 • Date / Time
 • Store / Branch
 • Product
• Measures
 • Qty / Price / Cost
Supply
• Dimensions
 • Date / Time
 • Supplier
 • Product
 • Contract / Contract terms
 • Type of transactions
• Measures
 • Qty / Amount / Cost
Orders
• Dimensions
 • Date / Time
 • Product
 • Customer
 • Salesperson
 • Terms of sale
• Measures
 • Qty / Amount / Discount
Reports
• These are the classic reports we already know
• When your reports are built with data from the
  DWh, you can trust on a reliable data source
• Historical data can be accessed too
• You can build reports with data coming from
  different systems in the company
• All of the reports are accessed from the same
  location
Digital Dashboards

• Is an information system similar to a car’s
  dashboard, designed to be easy to read
• Easy and visual information presented in a way
  to help you detect and correct tendencies
• Use them to align company strategies among
  departments and global objectives
Key Performance
      Indicators (KPI)
• They measure specific items and help you
  organize, define and evaluate your objectives
• SMART: Specific, Measurable, Achievable,
  Relevant, Time-bound
• Number of new Customers, Opportunity closing
  average time, Customer loss index
Conclusions
• OLTP systems to support everyday work and
  give information to the company
• OLAP systems to extract and analyze
  information and to make decisions
• Dashboards to concentrate information in a
  centralized view
• OLAP cubes to solve specific questions and
  freely explore information
Some Software Products
   you might need
• Microsoft SQL Server Analysis Services
• Microstrategy
• SAS
• OpenSource Alternatives (Pentaho)
The End?

Business Intelligence Presentation (1/2)

  • 1.
    Business Intelligence What is BI? (Part 1 of 2)
  • 2.
    How do Imake decissions in my business? • How does the company make decissions? Using intuition? You have to make business decisions based on reality (facts and numbers!) • EPM (Enterprise Performance Management) is a management style focused on measuring companies • Several Methodologies / Strategies: • Balanced Scorecard • Six Sigma, ABC - Activity Based Costing, TQM - Total Quality Management
  • 3.
    Phases in theDecision Making Process Intelligence Explicit the problem Design Plan for possible solutions Election Evaluate based on the outcome Implementation Actions according to a plan Control Verify expectations and effects
  • 4.
    Types of decisions Structured Semi structured Non structured Strategic Tactic Operational
  • 5.
    I need information! •All of these methodologies are based in several numeric indicators • “If you can’t measure it, you can’t manage it” • Indicators come from “day-to-day reality” (main street) • Monthly outcome, Number of complaints filed per product, Number of satisfied customers, Returns • Data exists, but ...
  • 6.
    Different Points ofView (1) • The CEO says “We need to sell more” • Marketing Mgr thinks “What can we offer to our customers?” • To do this, we need to know: What are the most sold products? What bundles are the most successful? • Who can provide us with this information? Because, we already have this information, don’t we? • IT Mgr, while upgrading platforms and implementing a new CRM system, estimates that the information will be available in 20-30 days...
  • 7.
    Different Points ofView (2) • Marketing Mgr asks: A month!? Didn’t we have this kind of information in our servers already? • IT Mgr answers:Yes, the data is there, but it doesn’t have the right structure to answer the questions you’re asking • Marketing Mgr keeps thinking that if the data is there, it can’t be so difficult to get the answers they need • IT Mgr keeps thinking that Marketing Mgt always asks for weird things, and with not time at all • And the CEO just wanted to sell more!
  • 8.
    Business Problem • Whereis the problem? • Marketing Mgr is right: the data IS in the servers • IT Mgr is also right: is not easy to give data the right structure to answers questions • For IT is just enough to deal with data, Marketing needs to extract information from this data.
  • 9.
    Data and information are not the same • Companies always maintain several systems to run their everyday business • All of the company workers add and check data from this systems all the time • However sometimes this data, presented in this way, is not enough to make business decisions
  • 10.
    Data, Information and Knowledge • Data: entity and transactions stored as structures and codes • Information: is the outcome of processing and extraction of data, with specific domain meaning to those who access it • Knowledge: Information becomes knowledge when is used to make decisions and take actions accordingly
  • 11.
    What is BusinessIntelligence? • Is a set of processes, technologies, applications and practices used to provide information and support the decision making process • It is NOT a standard software product, it is specifically designed by consulting and targeted to a particular business need • There is a series of technology tools that support this objective • To better understand this, a new type of systems categorization appears: OLTP (Transactional) and OLAP (Analytical)
  • 12.
    What is BI? SCD MOLAP RDBMS ROLAP ODS Data Warehouse ETL Forecasting Analytics Analytics Data Mining Clustering EIS HOLAP Alerting KPI Reporting OLAP Alerting Time Series Key Performance Indicators Dashboards Sales Intelligence MDM Data Mart Knowledge Discovery Online Analytical Processing Data Integration
  • 13.
    Transactional Systems OLTP • Designed to solve everyda work transactions (i.e. sales, customer care, manufacturing) • Points where the data is captured and recorded in the company • Very efficient in the management of specific information • ERP, CRM, RRHH, SCM, Email, Others
  • 14.
    Problems and Disadvantages •Relational Databases were designed for everyday work and not for analysis • It is difficult to manage historical information • Data is distributed among multiple systems and databases. How and where do you gather all of the systems data? • To extract information from data you need knowledge of non-trivial skills (programming or SQL language) and is not a dynamic process
  • 15.
    Analytical Systems OLAP • OLTP Systems complement • Designed specifically to obtain information, analyze and solve business problems • Specific analytical information is added to the data • They use a different database technology, optimized to extract information. • Analytical systems unify all of the company’s data in one system: the Data Warehouse
  • 16.
    What is aData Warehouse? • Is a digital warehouse with all of the electronic registered data in a company • They store all of the company’s information: daily and historical data • They gather heterogeneous information sources in one centralized space • It is used for reporting, data analysis and exploration, to see and detect changes and tendencies • Only two operations exist: load and query
  • 17.
    Data Warehouse or Data Mart? • A Data Warehouse contains all of the company’s information (wide scope, higher risk project) • A Data Mart is targeted to solve one company’s department needs in particular (limited scope, lower risk project) • The Data Warehouse can be built joining multiple specific Data Marts
  • 18.
    DWh Objectives • Must allow easy access to the company’s information • Must present this information in a consistent way • Must be adaptable and change-resilient • Must be a safe store, protecting the company’s information assets • Must support the decision making process • Must be accepted by the decision makers to be successful
  • 19.
    DWh Challenges • Hasto unify the whole company’s data model • Data latency • Historical data storage • Data granularity • Speed and performance in queries • Independent of OLTP system changes
  • 20.
    How do webuild a DWh? • ETL processes Extract the information from transactional systems, Transform this information and they Load it into the data warehouse • The information is stored in multidimensional databases • Information is ready to be used • The systems to access information are easy to use, you don’t have to work at NASA!
  • 21.
    Dimensional Modelling (1) • This is what makes a Data Warehouse a business oriented database • Measures. Business Variables • Numerical values • Sums, consolidations, arithmetic operations • Dimensions • Texts • Filters
  • 22.
    Dimensional Modelling (2) Time Date-ID Facts Dimension Year Product-ID Month Date-ID Date-ID SKU Day Product-ID Branch-ID Description Category Total Type Branch-ID # Products Price Country # Tickets State Product Branch City Dimension Dimension
  • 23.
    Why is itmultidimensional? • A dimension is one of the “edges” of your business • Customers • It is called multidimensional • Invoices because you can see the information from • Orders different “edges” at • Quotes the same time • Time • Activities
  • 24.
    ETL Processes Database Data Information OLTP ETL Warehouse Access Systems Transformation Extraction Loading
  • 25.
    What’s in acube? Time ts uc od 967 Jan Feb Mar Apr Pr 540 P4 967 P3 P2 780 P1 Clients Josh Sarah Joe Anna
  • 26.
    Data Warehouse DatabaseTechnology • MOLAP : Multi Dimensional • ROLAP : Relational • HOLAP : Hybrid
  • 27.
    How do I“see” what’s in a DWh? • OLAP Cubes • Reports • Dashboards • KPIs - Key Performance Indicators • Alerts
  • 28.
    OLAP Cubes • Theylet you analyze all of the information available in the Data Warehouse • Each cube stores a set of specific information, and contains different “measures” and “dimensions” • Measures are numbers (i.e. amounts, quantities, percentages) • Dimensions contain attributes to filter and order information • Several visualization tools: Excel, Reports, Web
  • 29.
    Some cubes • Sales •Stock • Suppliers • Orders • Accounting... • Human Resources... • Finances...
  • 30.
    • Dimensions Sales • Date / Time • Customer • Branch / Store • Product • Discount • Measures • Quantity • Cost • Profit
  • 31.
    Stock / Inventory •Dimensions • Date / Time • Store / Branch • Product • Measures • Qty / Price / Cost
  • 32.
    Supply • Dimensions •Date / Time • Supplier • Product • Contract / Contract terms • Type of transactions • Measures • Qty / Amount / Cost
  • 33.
    Orders • Dimensions •Date / Time • Product • Customer • Salesperson • Terms of sale • Measures • Qty / Amount / Discount
  • 34.
    Reports • These arethe classic reports we already know • When your reports are built with data from the DWh, you can trust on a reliable data source • Historical data can be accessed too • You can build reports with data coming from different systems in the company • All of the reports are accessed from the same location
  • 35.
    Digital Dashboards • Isan information system similar to a car’s dashboard, designed to be easy to read • Easy and visual information presented in a way to help you detect and correct tendencies • Use them to align company strategies among departments and global objectives
  • 36.
    Key Performance Indicators (KPI) • They measure specific items and help you organize, define and evaluate your objectives • SMART: Specific, Measurable, Achievable, Relevant, Time-bound • Number of new Customers, Opportunity closing average time, Customer loss index
  • 37.
    Conclusions • OLTP systemsto support everyday work and give information to the company • OLAP systems to extract and analyze information and to make decisions • Dashboards to concentrate information in a centralized view • OLAP cubes to solve specific questions and freely explore information
  • 38.
    Some Software Products you might need • Microsoft SQL Server Analysis Services • Microstrategy • SAS • OpenSource Alternatives (Pentaho)
  • 39.