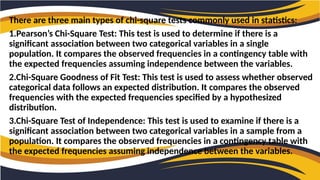
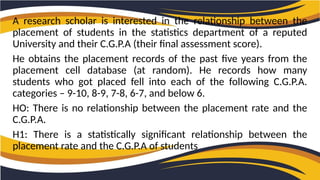
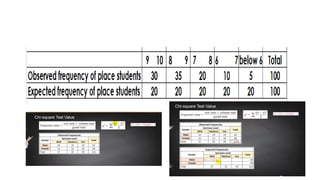
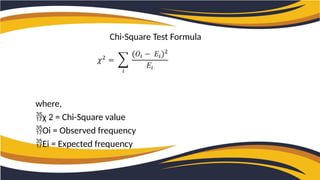
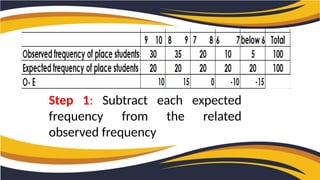
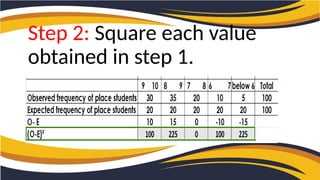
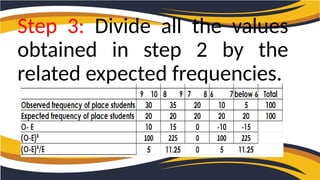
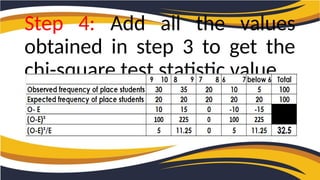
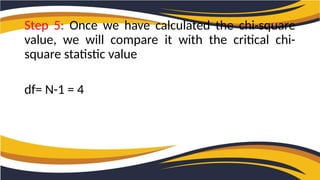
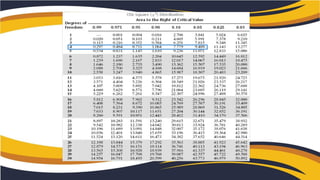
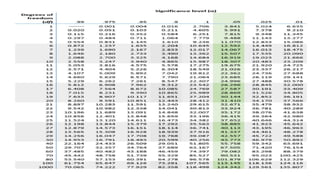
chi- square
test
Objectives
•Understand what the chi-square test is and
how it works
•Learn about the different types of Chi-Square
tests
•Be able to calculate the chi-square value using
the chi-square formula
Statistical analysis is a key tool for making
sense of data and drawing meaningful
conclusions.
• is a statistical test used to determine if
there is a significant association between
two categorical variables.
• It is a non-parametric test, meaning it does not
make assumptions about the underlying
distribution of the data.
CHI- SQUARE TEST
There are three main types of chi-square tests commonly used in statistics:
1.Pearson’s Chi-Square Test: This test is used to determine if there is a
significant association between two categorical variables in a single
population. It compares the observed frequencies in a contingency table with
the expected frequencies assuming independence between the variables.
2.Chi-Square Goodness of Fit Test: This test is used to assess whether observed
categorical data follows an expected distribution. It compares the observed
frequencies with the expected frequencies specified by a hypothesized
distribution.
3.Chi-Square Test of Independence: This test is used to examine if there is a
significant association between two categorical variables in a sample from a
population. It compares the observed frequencies in a contingency table with
the expected frequencies assuming independence between the variables.
Chi-Square Test Formula
where,
χ 2 = Chi-Square value
Oi = Observed frequency
Ei = Expected frequency
A research scholar is interested in the relationship between the
placement of students in the statistics department of a reputed
University and their C.G.P.A (their final assessment score).
He obtains the placement records of the past five years from the
placement cell database (at random). He records how many
students who got placed fell into each of the following C.G.P.A.
categories – 9-10, 8-9, 7-8, 6-7, and below 6.
HO: There is no relationship between the placement rate and the
C.G.P.A.
H1: There is a statistically significant relationship between the
placement rate and the C.G.P.A of students
Chi-Square Test Formula
where,
χ 2 = Chi-Square value
Oi = Observed frequency
Ei = Expected frequency
Step 1: Subtract each expected
frequency from the related
observed frequency
Step 2: Square each value
obtained in step 1.
Step 3: Divide all the values
obtained in step 2 by the
related expected frequencies.
Step 4: Add all the values
obtained in step 3 to get the
chi-square test statistic value
Step 5: Once we have calculated the chi-square
value, we will compare it with the critical chi-
square statistic value
df= N-1 = 4
Therefore, we can say that the observed
frequencies from the sample data are significantly
different from the expected frequencies. In other
words, C.G.P.A is related to the number of
placements that occur in the department of
statistics.
nferential Statistics - Non-parametric test (Chi Square Test)

nferential Statistics - Non-parametric test (Chi Square Test)

  • 1.
  • 2.
    Objectives •Understand what thechi-square test is and how it works •Learn about the different types of Chi-Square tests •Be able to calculate the chi-square value using the chi-square formula
  • 3.
    Statistical analysis isa key tool for making sense of data and drawing meaningful conclusions.
  • 4.
    • is astatistical test used to determine if there is a significant association between two categorical variables. • It is a non-parametric test, meaning it does not make assumptions about the underlying distribution of the data. CHI- SQUARE TEST
  • 5.
    There are threemain types of chi-square tests commonly used in statistics: 1.Pearson’s Chi-Square Test: This test is used to determine if there is a significant association between two categorical variables in a single population. It compares the observed frequencies in a contingency table with the expected frequencies assuming independence between the variables. 2.Chi-Square Goodness of Fit Test: This test is used to assess whether observed categorical data follows an expected distribution. It compares the observed frequencies with the expected frequencies specified by a hypothesized distribution. 3.Chi-Square Test of Independence: This test is used to examine if there is a significant association between two categorical variables in a sample from a population. It compares the observed frequencies in a contingency table with the expected frequencies assuming independence between the variables.
  • 6.
    Chi-Square Test Formula where, χ2 = Chi-Square value Oi = Observed frequency Ei = Expected frequency
  • 7.
    A research scholaris interested in the relationship between the placement of students in the statistics department of a reputed University and their C.G.P.A (their final assessment score). He obtains the placement records of the past five years from the placement cell database (at random). He records how many students who got placed fell into each of the following C.G.P.A. categories – 9-10, 8-9, 7-8, 6-7, and below 6. HO: There is no relationship between the placement rate and the C.G.P.A. H1: There is a statistically significant relationship between the placement rate and the C.G.P.A of students
  • 9.
    Chi-Square Test Formula where, χ2 = Chi-Square value Oi = Observed frequency Ei = Expected frequency
  • 10.
    Step 1: Subtracteach expected frequency from the related observed frequency
  • 11.
    Step 2: Squareeach value obtained in step 1.
  • 12.
    Step 3: Divideall the values obtained in step 2 by the related expected frequencies.
  • 13.
    Step 4: Addall the values obtained in step 3 to get the chi-square test statistic value
  • 14.
    Step 5: Oncewe have calculated the chi-square value, we will compare it with the critical chi- square statistic value df= N-1 = 4
  • 16.
    Therefore, we cansay that the observed frequencies from the sample data are significantly different from the expected frequencies. In other words, C.G.P.A is related to the number of placements that occur in the department of statistics.