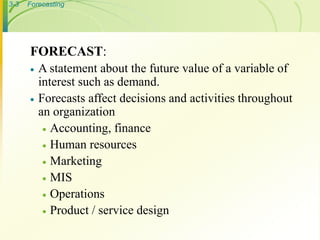
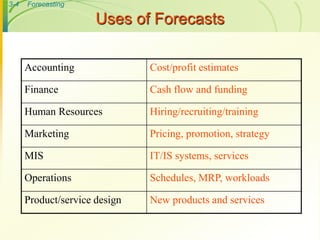
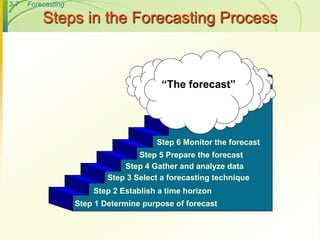
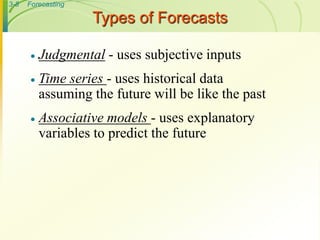
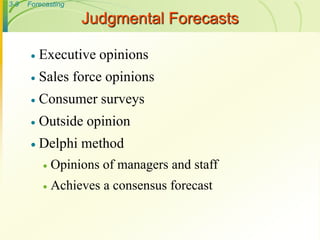
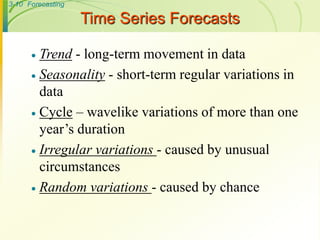
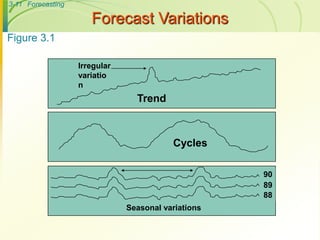
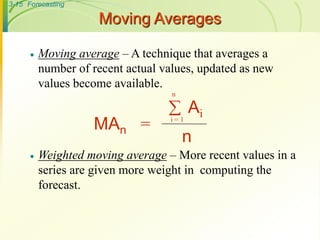
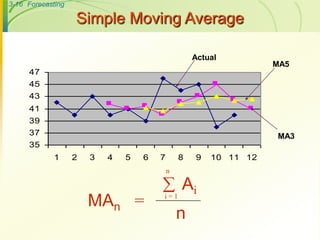
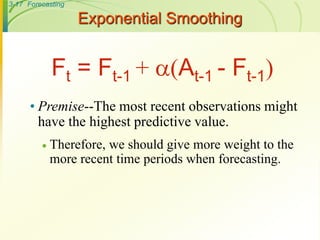
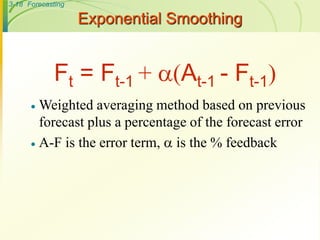
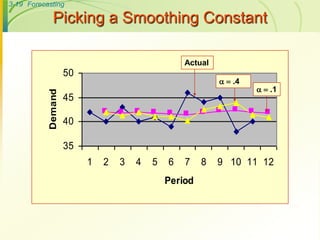
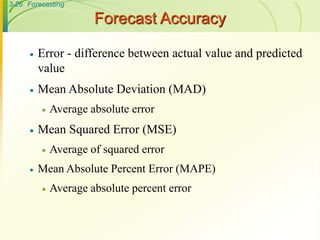
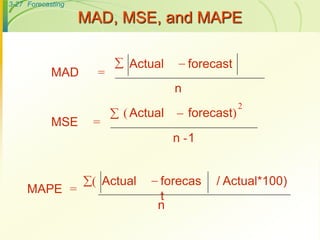
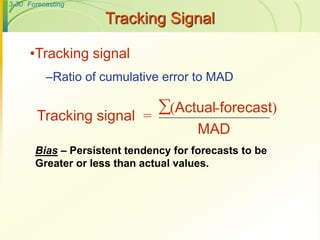
3-1 Forecasting
William J. Stevenson
Operations Management
8th edition
3-2 Forecasting
CHAPTER
3
Forecasting
McGraw-Hill/Irwin
Operations Management, Eighth Edition, by William J. Stevenson
Copyright Š 2005 by The McGraw-Hill Companies, Inc. All rights reserved.
3-3 Forecasting
FORECAST:
 A statement about the future value of a variable of
interest such as demand.
 Forecasts affect decisions and activities throughout
an organization
 Accounting, finance
 Human resources
 Marketing
 MIS
 Operations
 Product / service design
3-4 Forecasting
Accounting Cost/profit estimates
Finance Cash flow and funding
Human Resources Hiring/recruiting/training
Marketing Pricing, promotion, strategy
MIS IT/IS systems, services
Operations Schedules, MRP, workloads
Product/service design New products and services
Uses of Forecasts
3-5 Forecasting
 Assumes causal system
past ==> future
 Forecasts rarely perfect because of
randomness
 Forecasts more accurate for
groups vs. individuals
 Forecast accuracy decreases
as time horizon increases
I see that you will
get an A this semester.
3-6 Forecasting
Elements of a Good Forecast
Timely
Accurate
Reliable
Written
3-7 Forecasting
Steps in the Forecasting Process
Step 1 Determine purpose of forecast
Step 2 Establish a time horizon
Step 3 Select a forecasting technique
Step 4 Gather and analyze data
Step 5 Prepare the forecast
Step 6 Monitor the forecast
“The forecast”
3-8 Forecasting
Types of Forecasts
 Judgmental - uses subjective inputs
 Time series - uses historical data
assuming the future will be like the past
 Associative models - uses explanatory
variables to predict the future
3-9 Forecasting
Judgmental Forecasts
 Executive opinions
 Sales force opinions
 Consumer surveys
 Outside opinion
 Delphi method
 Opinions of managers and staff
 Achieves a consensus forecast
3-10 Forecasting
Time Series Forecasts
 Trend - long-term movement in data
 Seasonality - short-term regular variations in
data
 Cycle – wavelike variations of more than one
year’s duration
 Irregular variations - caused by unusual
circumstances
 Random variations - caused by chance
3-11 Forecasting
Forecast Variations
Trend
Irregular
variatio
n
Seasonal variations
90
89
88
Figure 3.1
Cycles
3-12 Forecasting
Naive Forecasts
Uh, give me a minute....
We sold 250 wheels last
week.... Now, next week
we should sell....
The forecast for any period equals
the previous period’s actual value.
3-13 Forecasting
 Simple to use
 Virtually no cost
 Quick and easy to prepare
 Data analysis is nonexistent
 Easily understandable
 Cannot provide high accuracy
 Can be a standard for accuracy
NaĂŻve Forecasts
3-14 Forecasting
Techniques for Averaging
 Moving average
 Weighted moving average
 Exponential smoothing
3-15 Forecasting
Moving Averages
 Moving average – A technique that averages a
number of recent actual values, updated as new
values become available.
 Weighted moving average – More recent values in a
series are given more weight in computing the
forecast.
MAn =
n
Ai
i = 1

n
3-16 Forecasting
Simple Moving Average
MAn =
n
Ai
i = 1

n
35
37
39
41
43
45
47
1 2 3 4 5 6 7 8 9 10 11 12
Actual
MA3
MA5
3-17 Forecasting
Exponential Smoothing
• Premise--The most recent observations might
have the highest predictive value.
 Therefore, we should give more weight to the
more recent time periods when forecasting.
Ft = Ft-1 + (At-1 - Ft-1)
3-18 Forecasting
Exponential Smoothing
 Weighted averaging method based on previous
forecast plus a percentage of the forecast error
 A-F is the error term,  is the % feedback
Ft = Ft-1 + (At-1 - Ft-1)
3-19 Forecasting
Picking a Smoothing Constant
35
40
45
50
1 2 3 4 5 6 7 8 9 10 11 12
Period
Demand
 .1
.4
Actual
3-20 Forecasting
Linear Trend Equation
 Ft = Forecast for period t
 t = Specified number of time periods
 a = Value of Ft at t = 0
 b = Slope of the line
Ft = a + bt
0 1 2 3 4 5 t
Ft
3-21 Forecasting
Calculating a and b
b =
n (ty) - t y
n t2 - ( t)2
a =
y - b t
n







3-22 Forecasting
Linear Trend Equation Example
t y
Week t2
Sales ty
1 1 150 150
2 4 157 314
3 9 162 486
4 16 166 664
5 25 177 885
 t = 15 t2
= 55  y = 812  ty = 2499
(t)2
= 225
3-23 Forecasting
Linear Trend Calculation
y = 143.5 + 6.3t
a =
812 - 6.3(15)
5
=
b =
5 (2499) - 15(812)
5(55) - 225
=
12495-12180
275-225
= 6.3
143.5
3-24 Forecasting
Associative Forecasting
 Predictor variables - used to predict values of
variable interest
 Regression - technique for fitting a line to a set
of points
 Least squares line - minimizes sum of squared
deviations around the line
3-25 Forecasting
Linear Model Seems Reasonable
A straight line is fitted to a set of sample points.
0
10
20
30
40
50
0 5 10 15 20 25
X Y
7 15
2 10
6 13
4 15
14 25
15 27
16 24
12 20
14 27
20 44
15 34
7 17
Computed
relationship
3-26 Forecasting
Forecast Accuracy
 Error - difference between actual value and predicted
value
 Mean Absolute Deviation (MAD)
 Average absolute error
 Mean Squared Error (MSE)
 Average of squared error
 Mean Absolute Percent Error (MAPE)
 Average absolute percent error
3-27 Forecasting
MAD, MSE, and MAPE
MAD =
Actual forecast


n
MSE =
Actual forecast)
-1
2


n
(
MAPE =
Actual forecas
t

n
/ Actual*100)
(
3-28 Forecasting
Controlling the Forecast
 Control chart
 A visual tool for monitoring forecast errors
 Used to detect non-randomness in errors
 Forecasting errors are in control if
 All errors are within the control limits
 No patterns, such as trends or cycles, are
present
3-29 Forecasting
Sources of Forecast errors
 Model may be inadequate
 Irregular variations
 Incorrect use of forecasting technique
3-30 Forecasting
Tracking Signal
Tracking signal =
(Actual-forecast)
MAD

•Tracking signal
–Ratio of cumulative error to MAD
Bias – Persistent tendency for forecasts to be
Greater or less than actual values.
3-31 Forecasting
Choosing a Forecasting Technique
 No single technique works in every situation
 Two most important factors
 Cost
 Accuracy
 Other factors include the availability of:
 Historical data
 Computers
 Time needed to gather and analyze the data
 Forecast horizon

chapter 3 classroom ppt.ppt

  • 1.
    3-1 Forecasting William J.Stevenson Operations Management 8th edition
  • 2.
    3-2 Forecasting CHAPTER 3 Forecasting McGraw-Hill/Irwin Operations Management,Eighth Edition, by William J. Stevenson Copyright Š 2005 by The McGraw-Hill Companies, Inc. All rights reserved.
  • 3.
    3-3 Forecasting FORECAST:  Astatement about the future value of a variable of interest such as demand.  Forecasts affect decisions and activities throughout an organization  Accounting, finance  Human resources  Marketing  MIS  Operations  Product / service design
  • 4.
    3-4 Forecasting Accounting Cost/profitestimates Finance Cash flow and funding Human Resources Hiring/recruiting/training Marketing Pricing, promotion, strategy MIS IT/IS systems, services Operations Schedules, MRP, workloads Product/service design New products and services Uses of Forecasts
  • 5.
    3-5 Forecasting  Assumescausal system past ==> future  Forecasts rarely perfect because of randomness  Forecasts more accurate for groups vs. individuals  Forecast accuracy decreases as time horizon increases I see that you will get an A this semester.
  • 6.
    3-6 Forecasting Elements ofa Good Forecast Timely Accurate Reliable Written
  • 7.
    3-7 Forecasting Steps inthe Forecasting Process Step 1 Determine purpose of forecast Step 2 Establish a time horizon Step 3 Select a forecasting technique Step 4 Gather and analyze data Step 5 Prepare the forecast Step 6 Monitor the forecast “The forecast”
  • 8.
    3-8 Forecasting Types ofForecasts  Judgmental - uses subjective inputs  Time series - uses historical data assuming the future will be like the past  Associative models - uses explanatory variables to predict the future
  • 9.
    3-9 Forecasting Judgmental Forecasts Executive opinions  Sales force opinions  Consumer surveys  Outside opinion  Delphi method  Opinions of managers and staff  Achieves a consensus forecast
  • 10.
    3-10 Forecasting Time SeriesForecasts  Trend - long-term movement in data  Seasonality - short-term regular variations in data  Cycle – wavelike variations of more than one year’s duration  Irregular variations - caused by unusual circumstances  Random variations - caused by chance
  • 11.
  • 12.
    3-12 Forecasting Naive Forecasts Uh,give me a minute.... We sold 250 wheels last week.... Now, next week we should sell.... The forecast for any period equals the previous period’s actual value.
  • 13.
    3-13 Forecasting  Simpleto use  Virtually no cost  Quick and easy to prepare  Data analysis is nonexistent  Easily understandable  Cannot provide high accuracy  Can be a standard for accuracy Naïve Forecasts
  • 14.
    3-14 Forecasting Techniques forAveraging  Moving average  Weighted moving average  Exponential smoothing
  • 15.
    3-15 Forecasting Moving Averages Moving average – A technique that averages a number of recent actual values, updated as new values become available.  Weighted moving average – More recent values in a series are given more weight in computing the forecast. MAn = n Ai i = 1  n
  • 16.
    3-16 Forecasting Simple MovingAverage MAn = n Ai i = 1  n 35 37 39 41 43 45 47 1 2 3 4 5 6 7 8 9 10 11 12 Actual MA3 MA5
  • 17.
    3-17 Forecasting Exponential Smoothing •Premise--The most recent observations might have the highest predictive value.  Therefore, we should give more weight to the more recent time periods when forecasting. Ft = Ft-1 + (At-1 - Ft-1)
  • 18.
    3-18 Forecasting Exponential Smoothing Weighted averaging method based on previous forecast plus a percentage of the forecast error  A-F is the error term,  is the % feedback Ft = Ft-1 + (At-1 - Ft-1)
  • 19.
    3-19 Forecasting Picking aSmoothing Constant 35 40 45 50 1 2 3 4 5 6 7 8 9 10 11 12 Period Demand  .1 .4 Actual
  • 20.
    3-20 Forecasting Linear TrendEquation  Ft = Forecast for period t  t = Specified number of time periods  a = Value of Ft at t = 0  b = Slope of the line Ft = a + bt 0 1 2 3 4 5 t Ft
  • 21.
    3-21 Forecasting Calculating aand b b = n (ty) - t y n t2 - ( t)2 a = y - b t n       
  • 22.
    3-22 Forecasting Linear TrendEquation Example t y Week t2 Sales ty 1 1 150 150 2 4 157 314 3 9 162 486 4 16 166 664 5 25 177 885  t = 15 t2 = 55  y = 812  ty = 2499 (t)2 = 225
  • 23.
    3-23 Forecasting Linear TrendCalculation y = 143.5 + 6.3t a = 812 - 6.3(15) 5 = b = 5 (2499) - 15(812) 5(55) - 225 = 12495-12180 275-225 = 6.3 143.5
  • 24.
    3-24 Forecasting Associative Forecasting Predictor variables - used to predict values of variable interest  Regression - technique for fitting a line to a set of points  Least squares line - minimizes sum of squared deviations around the line
  • 25.
    3-25 Forecasting Linear ModelSeems Reasonable A straight line is fitted to a set of sample points. 0 10 20 30 40 50 0 5 10 15 20 25 X Y 7 15 2 10 6 13 4 15 14 25 15 27 16 24 12 20 14 27 20 44 15 34 7 17 Computed relationship
  • 26.
    3-26 Forecasting Forecast Accuracy Error - difference between actual value and predicted value  Mean Absolute Deviation (MAD)  Average absolute error  Mean Squared Error (MSE)  Average of squared error  Mean Absolute Percent Error (MAPE)  Average absolute percent error
  • 27.
    3-27 Forecasting MAD, MSE,and MAPE MAD = Actual forecast   n MSE = Actual forecast) -1 2   n ( MAPE = Actual forecas t  n / Actual*100) (
  • 28.
    3-28 Forecasting Controlling theForecast  Control chart  A visual tool for monitoring forecast errors  Used to detect non-randomness in errors  Forecasting errors are in control if  All errors are within the control limits  No patterns, such as trends or cycles, are present
  • 29.
    3-29 Forecasting Sources ofForecast errors  Model may be inadequate  Irregular variations  Incorrect use of forecasting technique
  • 30.
    3-30 Forecasting Tracking Signal Trackingsignal = (Actual-forecast) MAD  •Tracking signal –Ratio of cumulative error to MAD Bias – Persistent tendency for forecasts to be Greater or less than actual values.
  • 31.
    3-31 Forecasting Choosing aForecasting Technique  No single technique works in every situation  Two most important factors  Cost  Accuracy  Other factors include the availability of:  Historical data  Computers  Time needed to gather and analyze the data  Forecast horizon