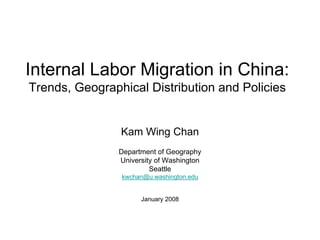
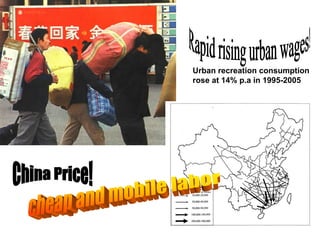
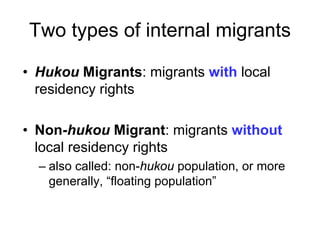
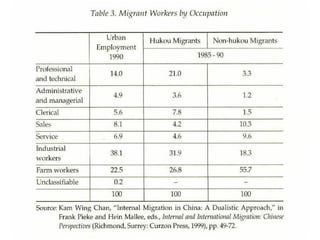
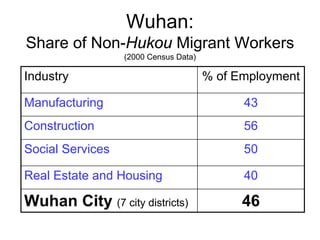
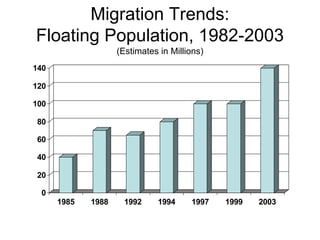
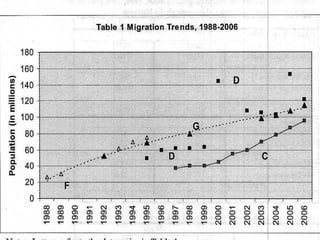
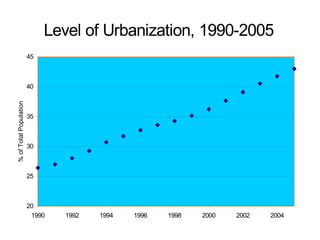
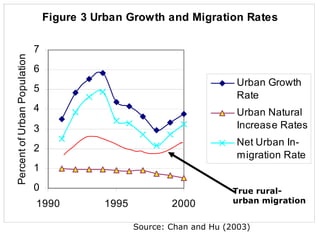
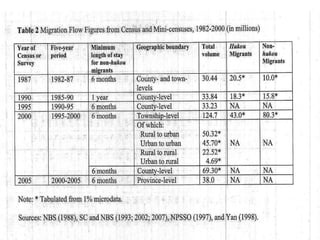
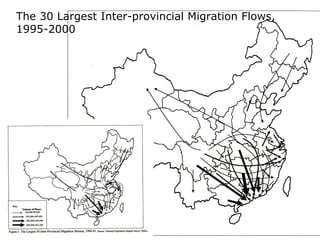
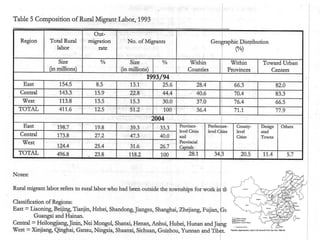
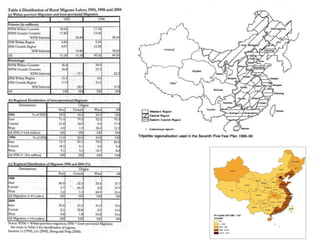
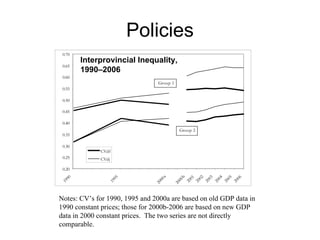
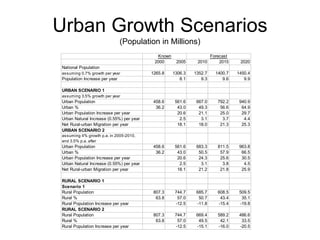
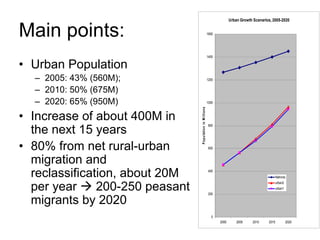
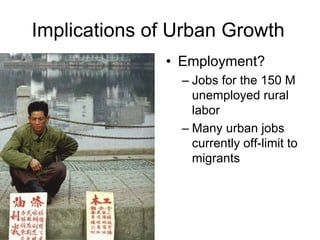
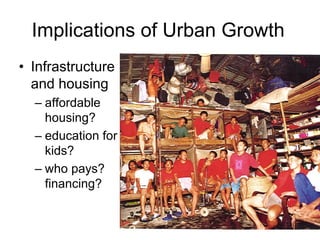
Internal Labor Migration in China:
Trends, Geographical Distribution and Policies
Kam Wing Chan
Department of Geography
University of Washington
Seattle
kwchan@u.washington.edu
January 2008
Wuhan:
Share of Migrant Workers (Non-Hukou)
(2000 Census Data)
Industry % of employment
in that industry
Manufacturing 43
Construction 56
Social Services 50
Real Estate and Housing 40
Wuhan City (7 city districts) 46
Urban recreation consumption
rose at 14% p.a in 1995-2005
Topics
• Hukou System and Migration
Statistics
• Migration Trends
• Geography
• Policies
(The Household Registration System, 户口制度)
• Formally set up in 1958
• Divided population/society into two major types of households:
rural and urban
• Differential treatments of rural and urban residents
• Controlled by the police and other govt departments
• Basically an “internal passport system”
• Currently, the system serves as a benefit eligibility system; a tool
of institutional exclusion than controlling geographical mobility
• The population of a city is divided into “local” and “outside”
population.
Ad
An unlicensed school in Beijing
MIGRANT CHILDREN FALL
THROUGH THE CRACKS
Two types of internal migrants
• Hukou Migrants: migrants with local
residency rights
• Non-hukou Migrant: migrants without
local residency rights
– also called: non-hukou population, or more
generally, “floating population”
Wuhan:
Share of Non-Hukou Migrant Workers
(2000 Census Data)
Industry % of Employment
Manufacturing 43
Construction 56
Social Services 50
Real Estate and Housing 40
Wuhan City (7 city districts) 46
Trends
Migration Trends:
Floating Population, 1982-2003
(Estimates in Millions)
0
20
40
60
80
100
120
140
1985 1988 1992 1994 1997 1999 2003
Level of Urbanization, 1990-2005
20
25
30
35
40
45
1990 1992 1994 1996 1998 2000 2002 2004
%ofTotalPopulation
Figure 3 Urban Growth and Migration Rates
0
1
2
3
4
5
6
7
1990 1995 2000
PercentofUrbanPopulation
Urban Growth
Rate
Urban Natural
Increase Rates
Net Urban In-
migration Rate
Source: Chan and Hu (2003)
True rural-
urban migration
Geography
The 30 Largest Inter-provincial Migration Flows,
1995-2000
Policies
0.20
0.25
0.30
0.35
0.40
0.45
0.50
0.55
0.60
0.65
0.70
1990
1995
2000a
2000b
2001
2002
2003
2004
2005
2006
CVdf
CVdj
Group 1
Group 2
Notes: CV’s for 1990, 1995 and 2000a are based on old GDP data in
1990 constant prices; those for 2000b-2006 are based on new GDP
data in 2000 constant prices. The two series are not directly
comparable.
Interprovincial Inequality,
1990–2006
Urban Growth Scenarios
(Population in Millions)
2000 2005 2010 2015 2020
National Population
assuming 0.7% growth per year 1265.8 1306.3 1352.7 1400.7 1450.4
Population Increase per year 8.1 9.3 9.6 9.9
URBAN SCENARIO 1
assuming 3.5% growth per year
Urban Population 458.6 561.6 667.0 792.2 940.9
Urban % 36.2 43.0 49.3 56.6 64.9
Urban Population Increase per year 20.6 21.1 25.0 29.7
Urban Natural Increase (0.55%) per year 2.5 3.1 3.7 4.4
Net Rural-urban Migration per year 18.1 18.0 21.3 25.3
URBAN SCENARIO 2
assuming 4% growth p.a. in 2005-2010,
and 3.5% p.a. after
Urban Population 458.6 561.6 683.3 811.5 963.8
Urban % 36.2 43.0 50.5 57.9 66.5
Urban Population Increase per year 20.6 24.3 25.6 30.5
Urban Natural Increase (0.55%) per year 2.5 3.1 3.8 4.5
Net Rural-urban Migration per year 18.1 21.2 21.8 25.9
RURAL SCENARIO 1
Scenario 1
Rural Population 807.3 744.7 685.7 608.5 509.5
Rural % 63.8 57.0 50.7 43.4 35.1
Rural Population Increase per year -12.5 -11.8 -15.4 -19.8
RURAL SCENARIO 2
Rural Population 807.3 744.7 669.4 589.2 486.6
Rural % 63.8 57.0 49.5 42.1 33.5
Rural Population Increase per year -12.5 -15.1 -16.0 -20.5
Known Forecast
Main points:
• Urban Population
– 2005: 43% (560M);
– 2010: 50% (675M)
– 2020: 65% (950M)
• Increase of about 400M in
the next 15 years
• 80% from net rural-urban
migration and
reclassification, about 20M
per year 200-250 peasant
migrants by 2020
Urban Growth Scenarios, 2005-2020
0
200
400
600
800
1000
1200
1400
1600
2000 2005 2010 2015 2020
PopulationinMillions
Nationa;
urban2
urban1
Implications of Urban Growth
• Employment?
– Jobs for the 150 M
unemployed rural
labor
– Many urban jobs
currently off-limit to
migrants
Implications of Urban Growth
• Infrastructure
and housing
– affordable
housing?
– education for
kids?
– who pays?
financing?
Implications of Urban Growth
• Urban poverty, public
safety and social
stability
– wage arrears, unfair
compensation for land
expropriated, etc
– 200 M permanent
urban underclass?
– protests and riots
Thank you!

Internal Migration in China

  • 1.
    Internal Labor Migrationin China: Trends, Geographical Distribution and Policies Kam Wing Chan Department of Geography University of Washington Seattle kwchan@u.washington.edu January 2008
  • 4.
    Wuhan: Share of MigrantWorkers (Non-Hukou) (2000 Census Data) Industry % of employment in that industry Manufacturing 43 Construction 56 Social Services 50 Real Estate and Housing 40 Wuhan City (7 city districts) 46
  • 5.
    Urban recreation consumption roseat 14% p.a in 1995-2005
  • 6.
    Topics • Hukou Systemand Migration Statistics • Migration Trends • Geography • Policies
  • 7.
    (The Household RegistrationSystem, 户口制度) • Formally set up in 1958 • Divided population/society into two major types of households: rural and urban • Differential treatments of rural and urban residents • Controlled by the police and other govt departments • Basically an “internal passport system” • Currently, the system serves as a benefit eligibility system; a tool of institutional exclusion than controlling geographical mobility • The population of a city is divided into “local” and “outside” population.
  • 8.
  • 9.
    An unlicensed schoolin Beijing MIGRANT CHILDREN FALL THROUGH THE CRACKS
  • 10.
    Two types ofinternal migrants • Hukou Migrants: migrants with local residency rights • Non-hukou Migrant: migrants without local residency rights – also called: non-hukou population, or more generally, “floating population”
  • 12.
    Wuhan: Share of Non-HukouMigrant Workers (2000 Census Data) Industry % of Employment Manufacturing 43 Construction 56 Social Services 50 Real Estate and Housing 40 Wuhan City (7 city districts) 46
  • 13.
  • 14.
    Migration Trends: Floating Population,1982-2003 (Estimates in Millions) 0 20 40 60 80 100 120 140 1985 1988 1992 1994 1997 1999 2003
  • 16.
    Level of Urbanization,1990-2005 20 25 30 35 40 45 1990 1992 1994 1996 1998 2000 2002 2004 %ofTotalPopulation
  • 17.
    Figure 3 UrbanGrowth and Migration Rates 0 1 2 3 4 5 6 7 1990 1995 2000 PercentofUrbanPopulation Urban Growth Rate Urban Natural Increase Rates Net Urban In- migration Rate Source: Chan and Hu (2003) True rural- urban migration
  • 19.
  • 23.
    The 30 LargestInter-provincial Migration Flows, 1995-2000
  • 26.
    Policies 0.20 0.25 0.30 0.35 0.40 0.45 0.50 0.55 0.60 0.65 0.70 1990 1995 2000a 2000b 2001 2002 2003 2004 2005 2006 CVdf CVdj Group 1 Group 2 Notes:CV’s for 1990, 1995 and 2000a are based on old GDP data in 1990 constant prices; those for 2000b-2006 are based on new GDP data in 2000 constant prices. The two series are not directly comparable. Interprovincial Inequality, 1990–2006
  • 28.
    Urban Growth Scenarios (Populationin Millions) 2000 2005 2010 2015 2020 National Population assuming 0.7% growth per year 1265.8 1306.3 1352.7 1400.7 1450.4 Population Increase per year 8.1 9.3 9.6 9.9 URBAN SCENARIO 1 assuming 3.5% growth per year Urban Population 458.6 561.6 667.0 792.2 940.9 Urban % 36.2 43.0 49.3 56.6 64.9 Urban Population Increase per year 20.6 21.1 25.0 29.7 Urban Natural Increase (0.55%) per year 2.5 3.1 3.7 4.4 Net Rural-urban Migration per year 18.1 18.0 21.3 25.3 URBAN SCENARIO 2 assuming 4% growth p.a. in 2005-2010, and 3.5% p.a. after Urban Population 458.6 561.6 683.3 811.5 963.8 Urban % 36.2 43.0 50.5 57.9 66.5 Urban Population Increase per year 20.6 24.3 25.6 30.5 Urban Natural Increase (0.55%) per year 2.5 3.1 3.8 4.5 Net Rural-urban Migration per year 18.1 21.2 21.8 25.9 RURAL SCENARIO 1 Scenario 1 Rural Population 807.3 744.7 685.7 608.5 509.5 Rural % 63.8 57.0 50.7 43.4 35.1 Rural Population Increase per year -12.5 -11.8 -15.4 -19.8 RURAL SCENARIO 2 Rural Population 807.3 744.7 669.4 589.2 486.6 Rural % 63.8 57.0 49.5 42.1 33.5 Rural Population Increase per year -12.5 -15.1 -16.0 -20.5 Known Forecast
  • 29.
    Main points: • UrbanPopulation – 2005: 43% (560M); – 2010: 50% (675M) – 2020: 65% (950M) • Increase of about 400M in the next 15 years • 80% from net rural-urban migration and reclassification, about 20M per year 200-250 peasant migrants by 2020 Urban Growth Scenarios, 2005-2020 0 200 400 600 800 1000 1200 1400 1600 2000 2005 2010 2015 2020 PopulationinMillions Nationa; urban2 urban1
  • 30.
    Implications of UrbanGrowth • Employment? – Jobs for the 150 M unemployed rural labor – Many urban jobs currently off-limit to migrants
  • 31.
    Implications of UrbanGrowth • Infrastructure and housing – affordable housing? – education for kids? – who pays? financing?
  • 32.
    Implications of UrbanGrowth • Urban poverty, public safety and social stability – wage arrears, unfair compensation for land expropriated, etc – 200 M permanent urban underclass? – protests and riots
  • 33.