
Downloaded 1,536 times
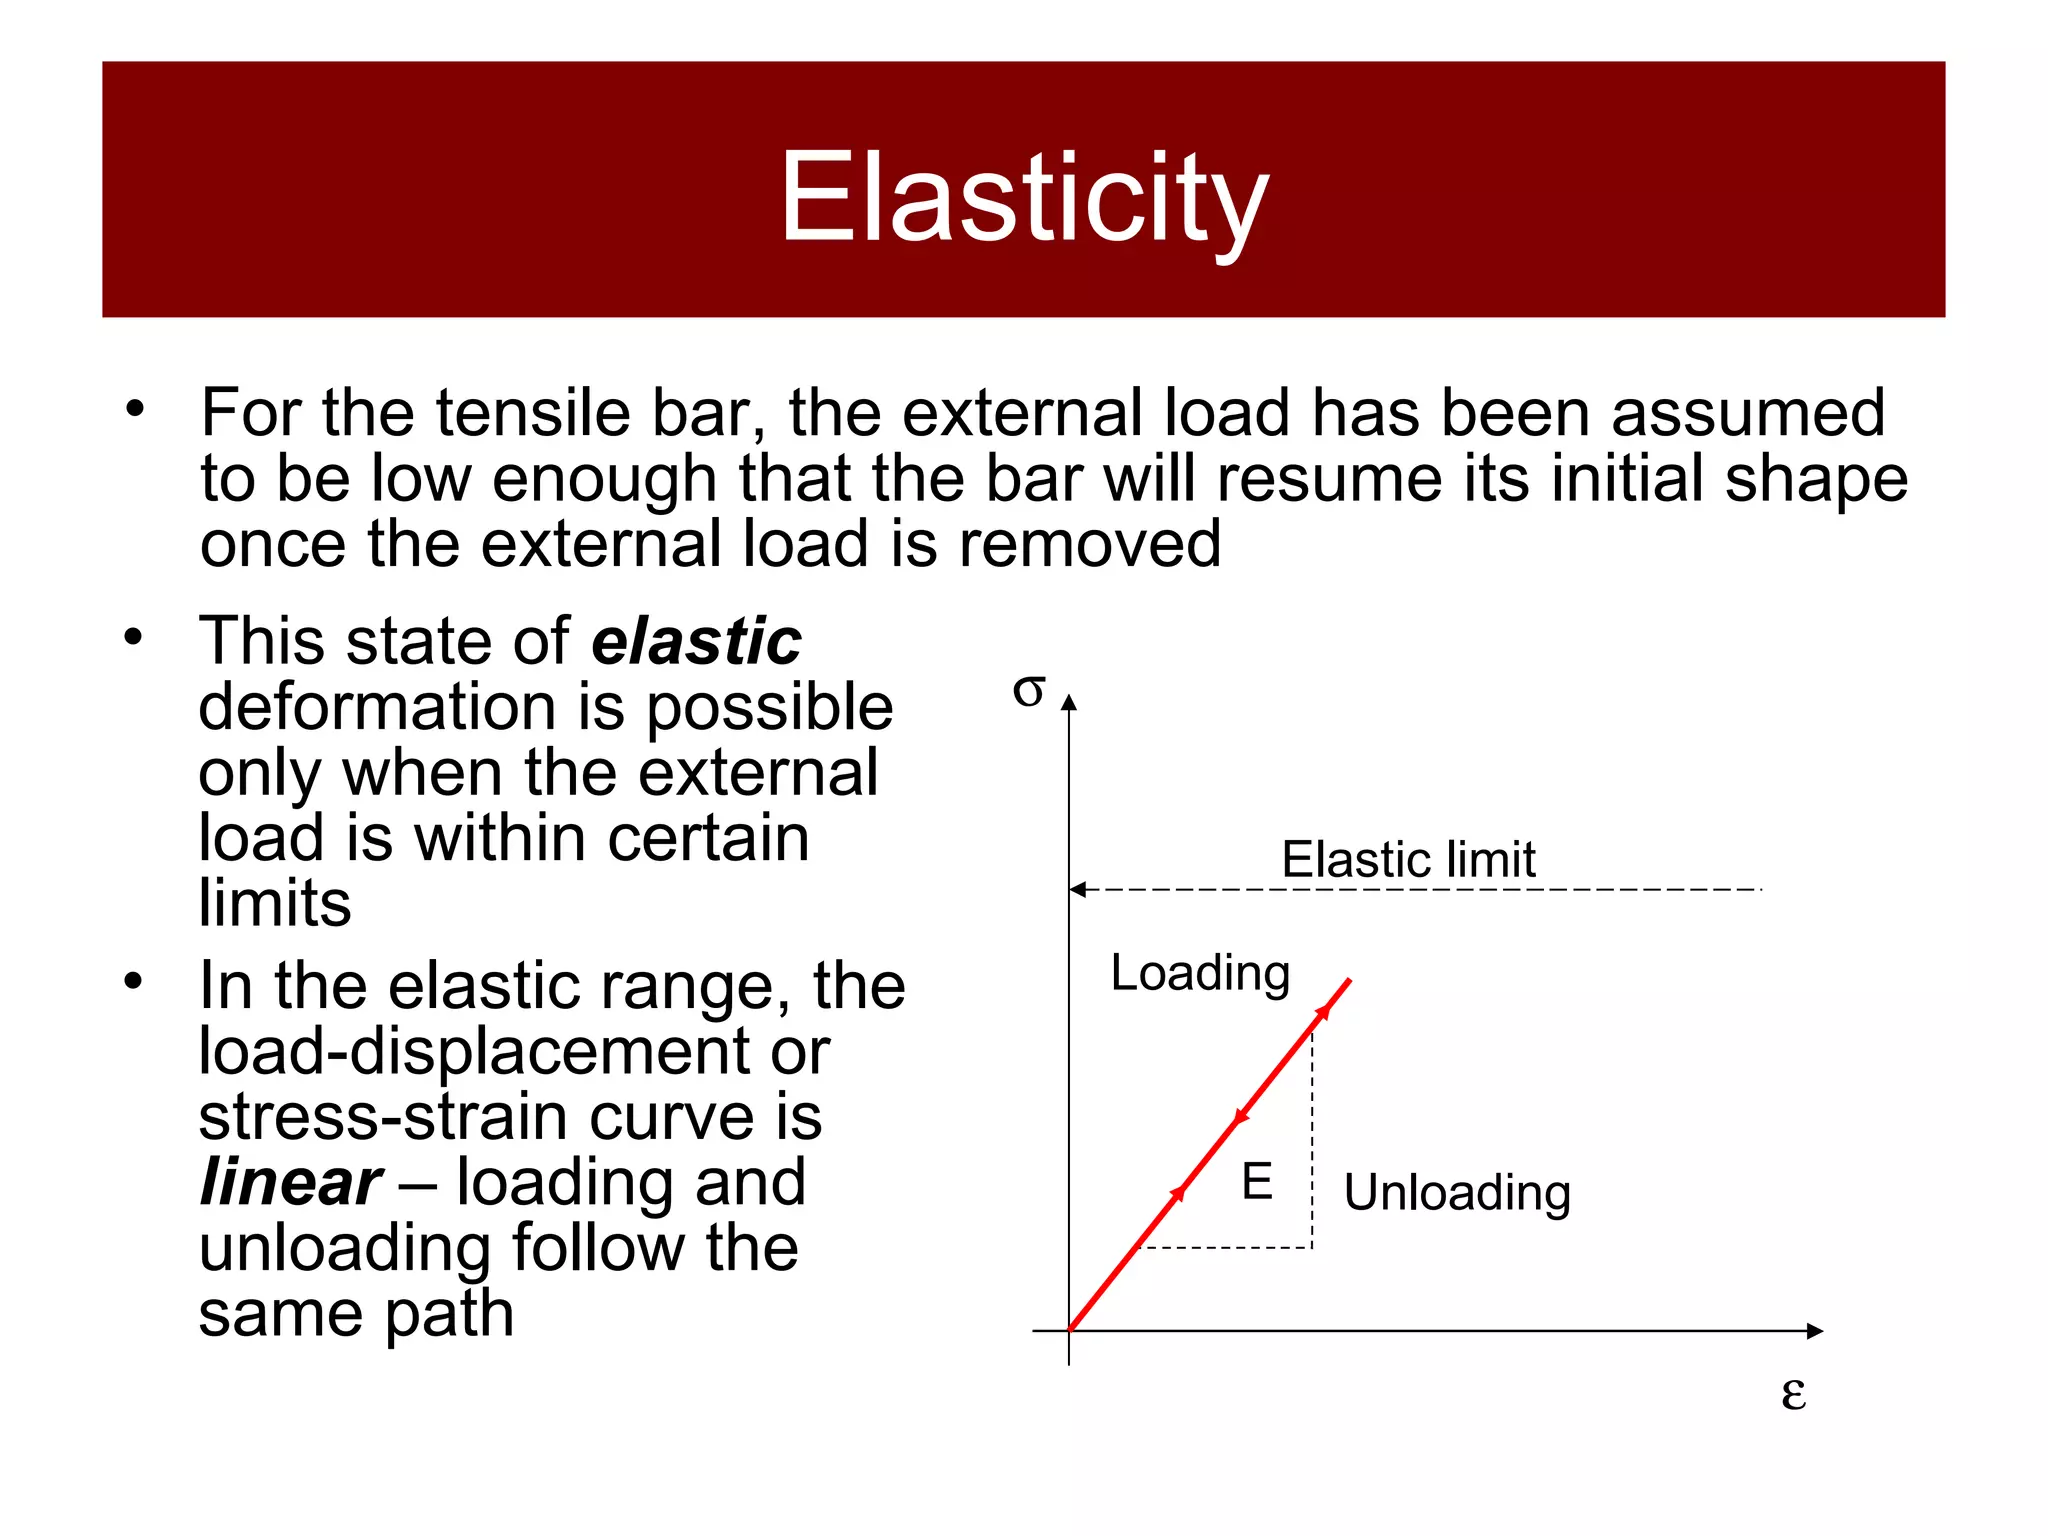
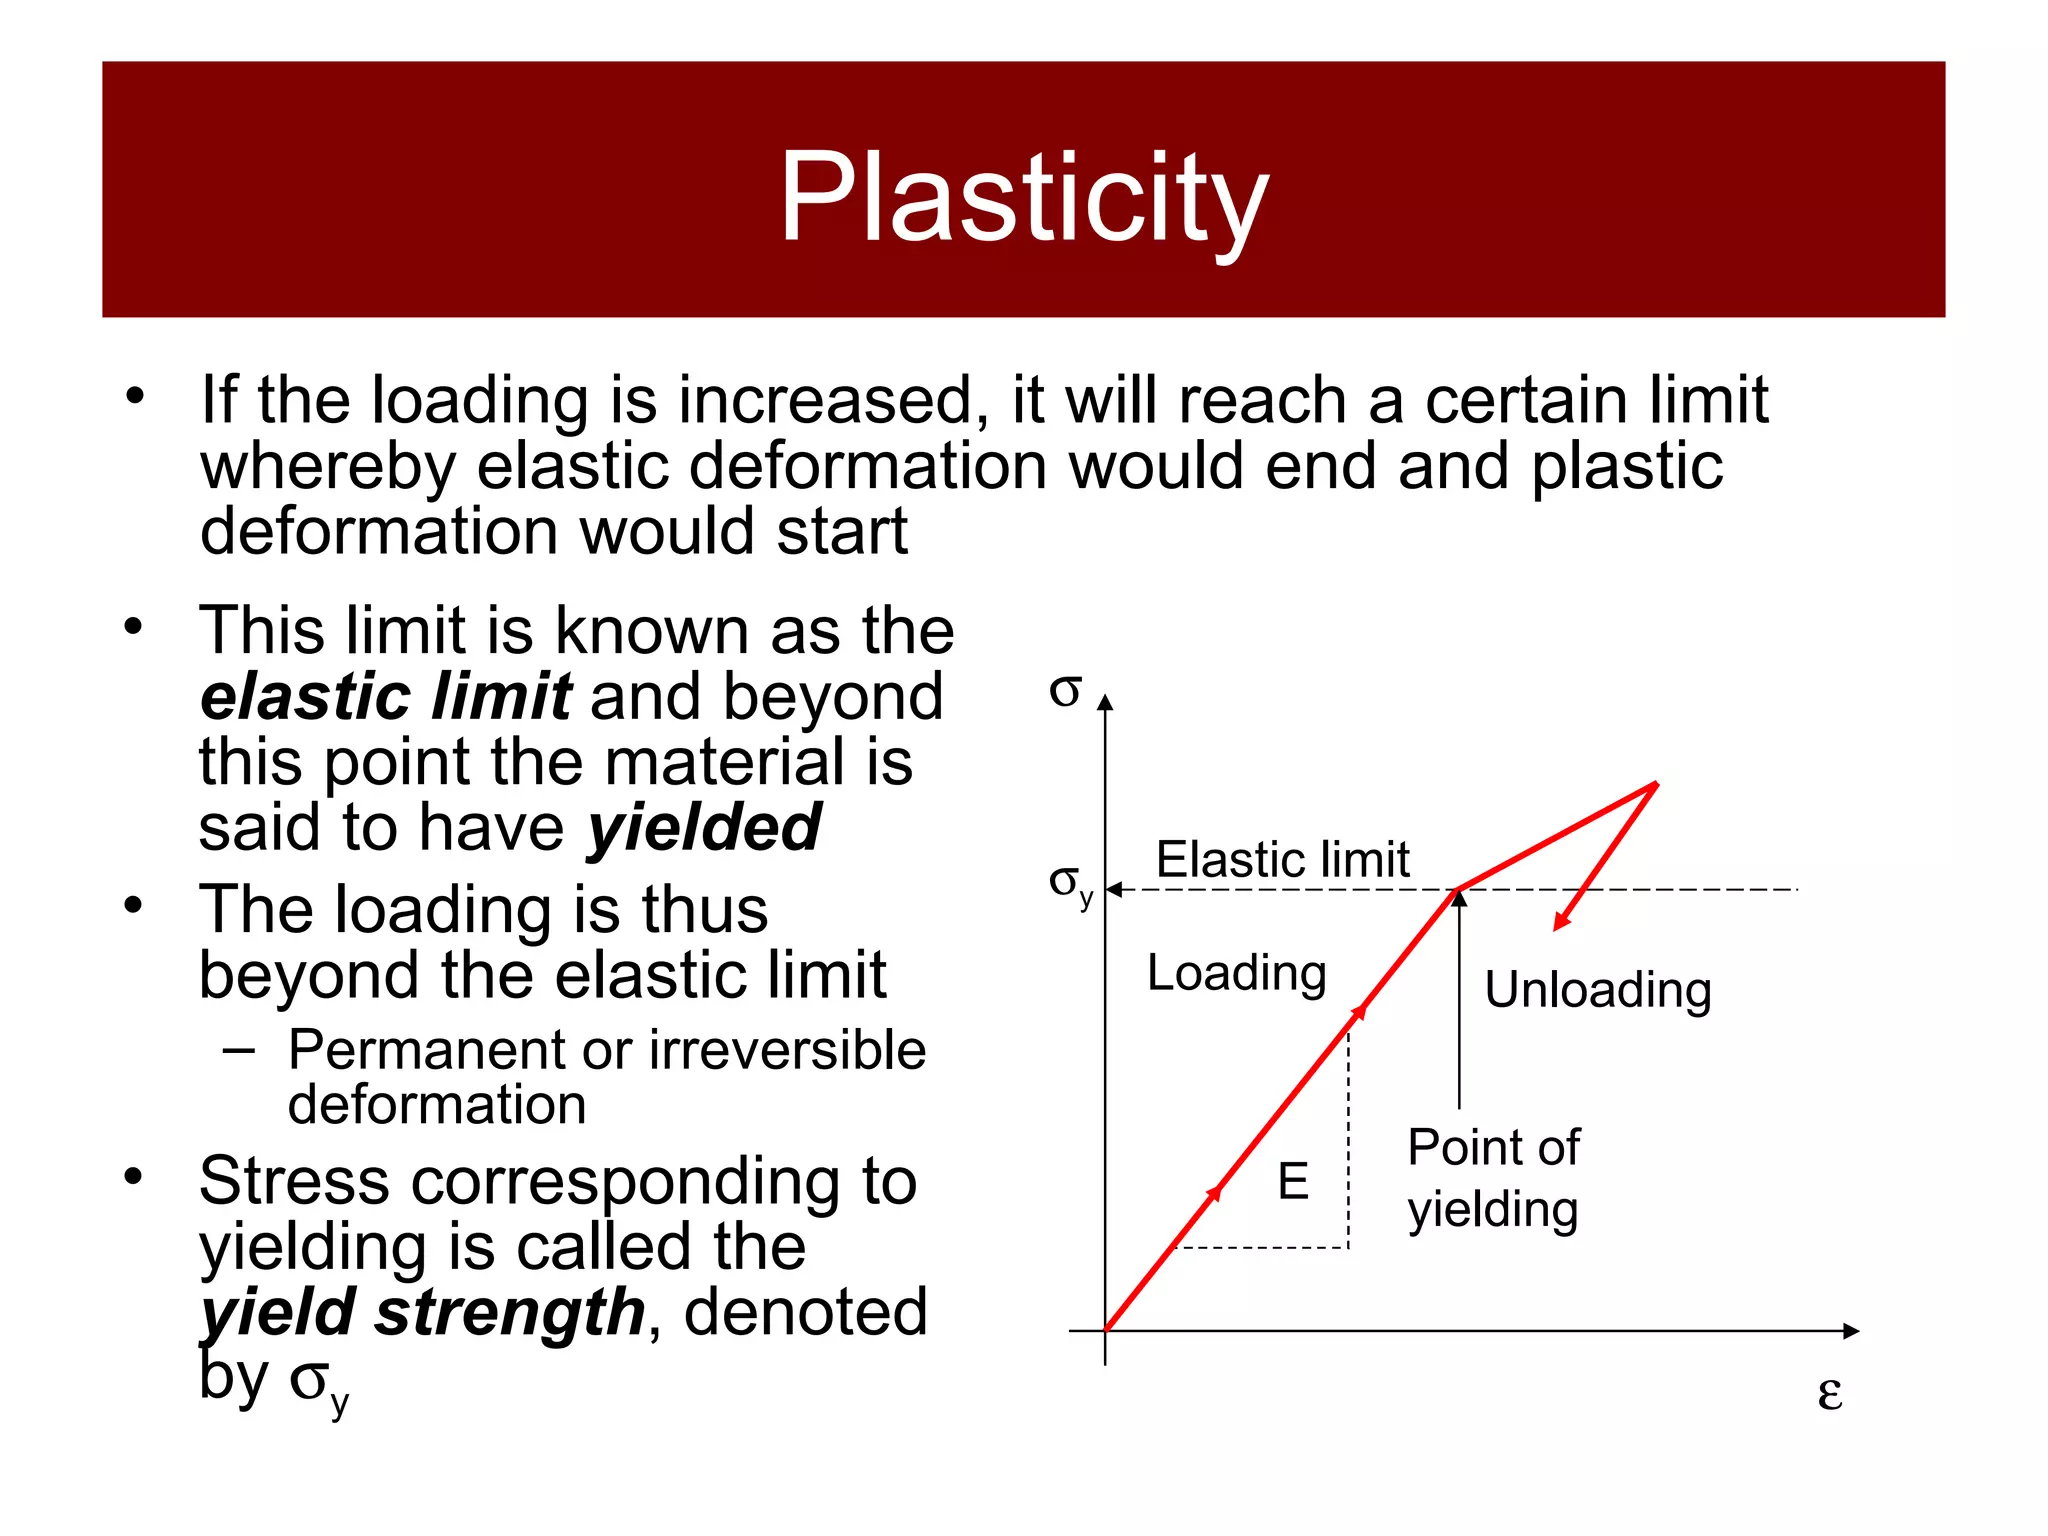
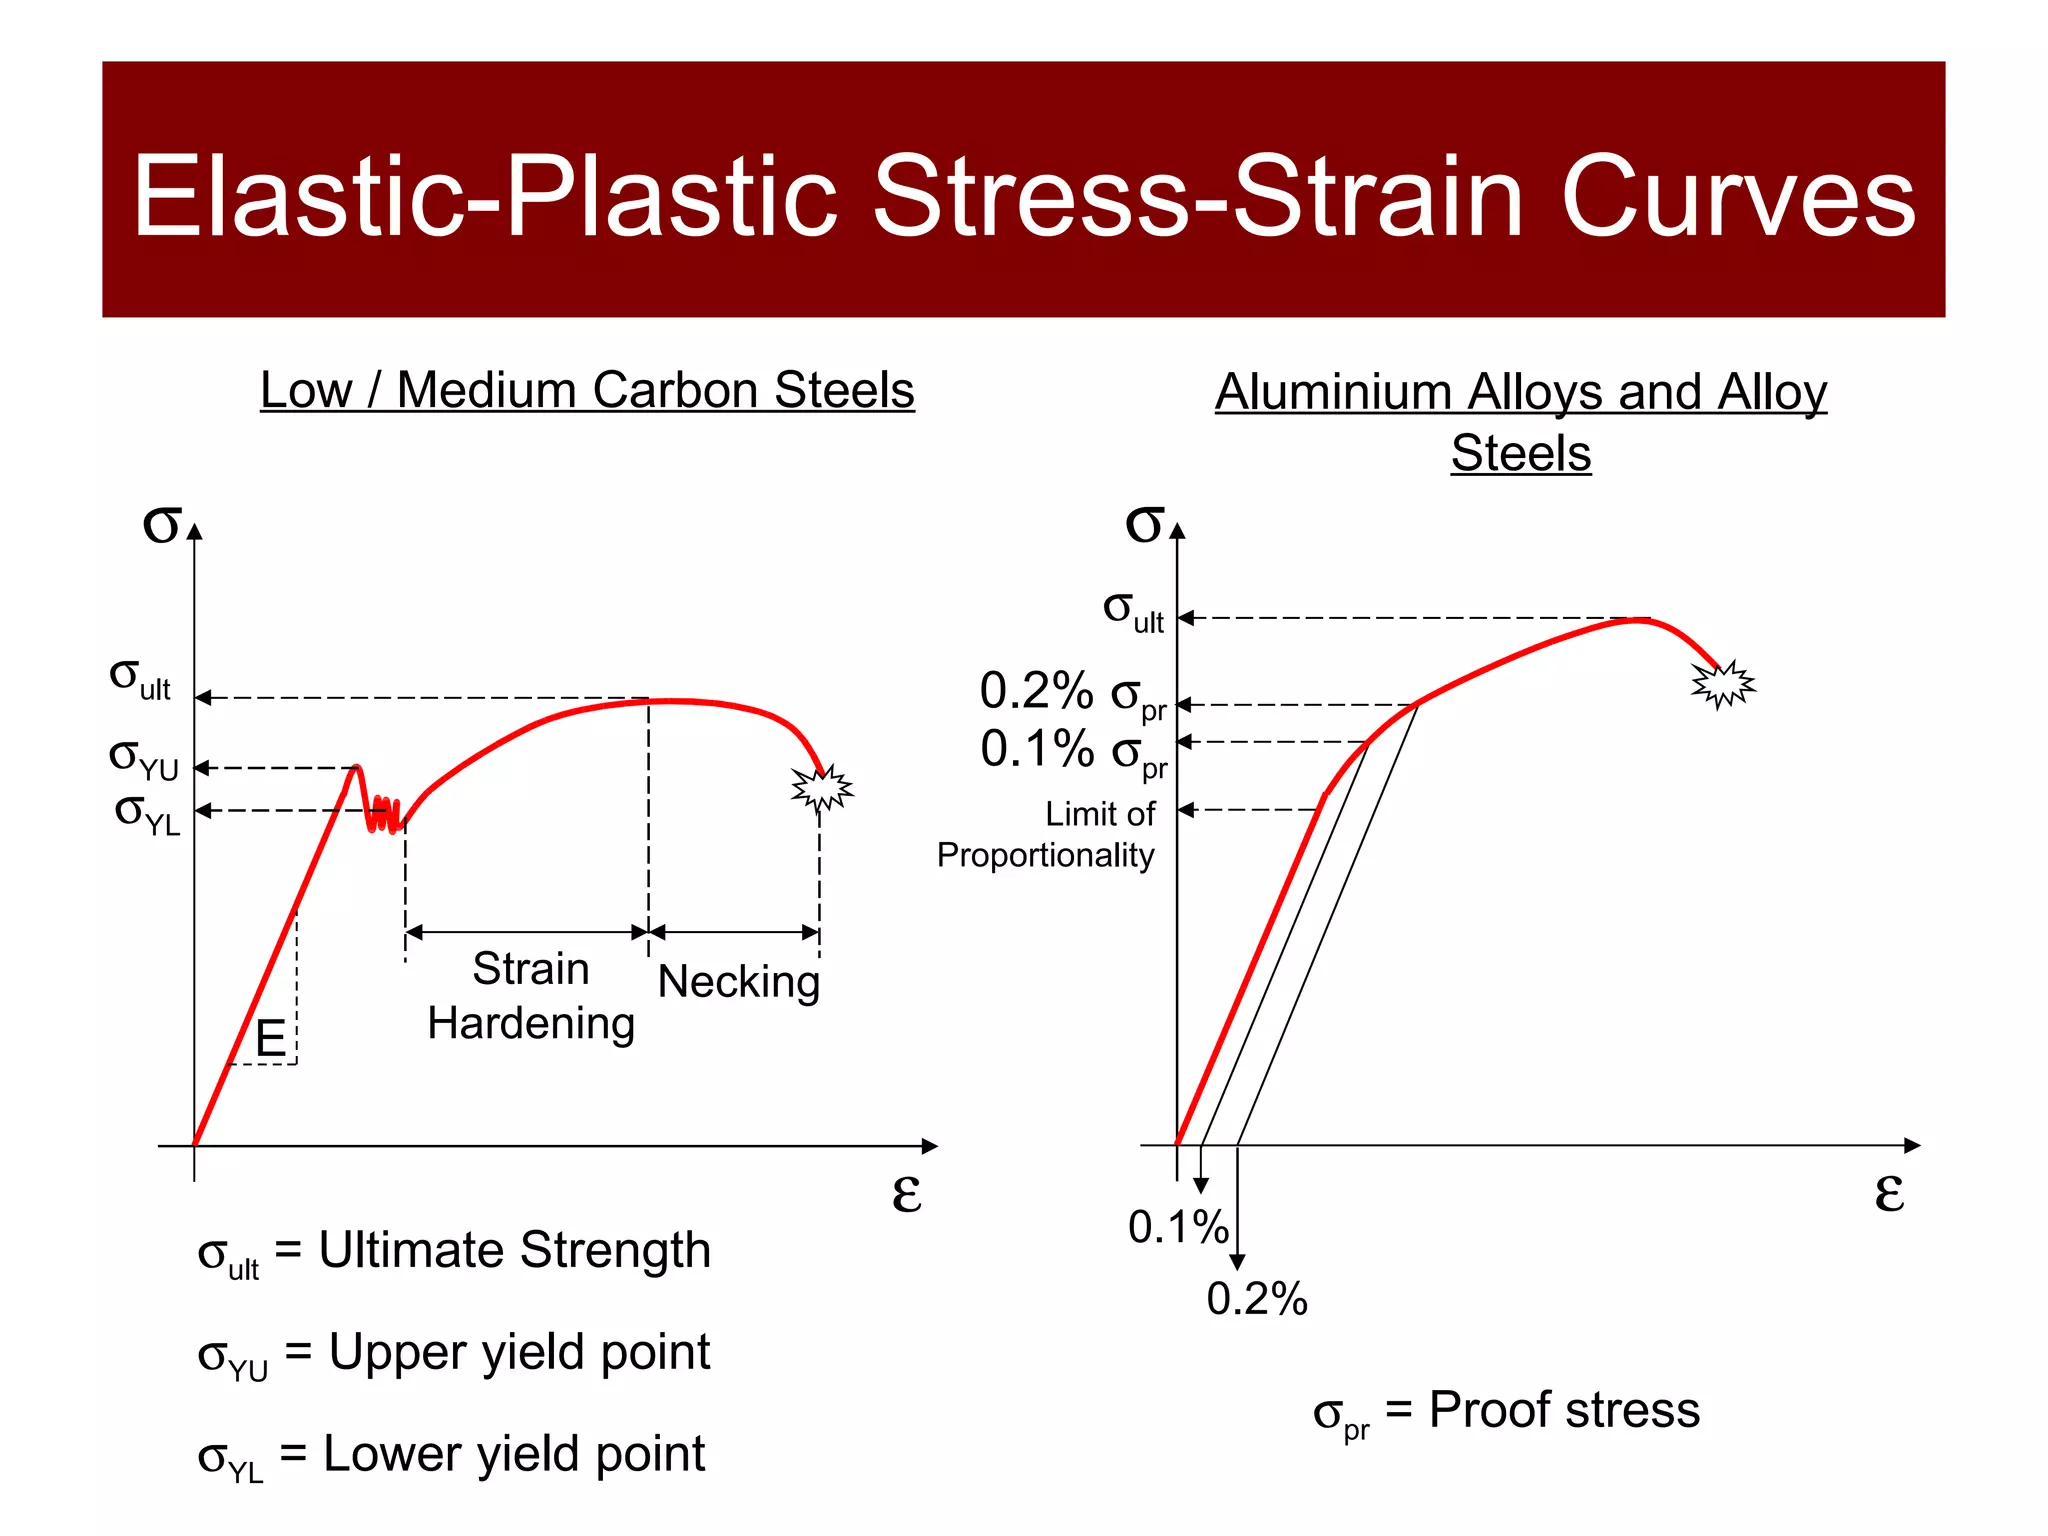
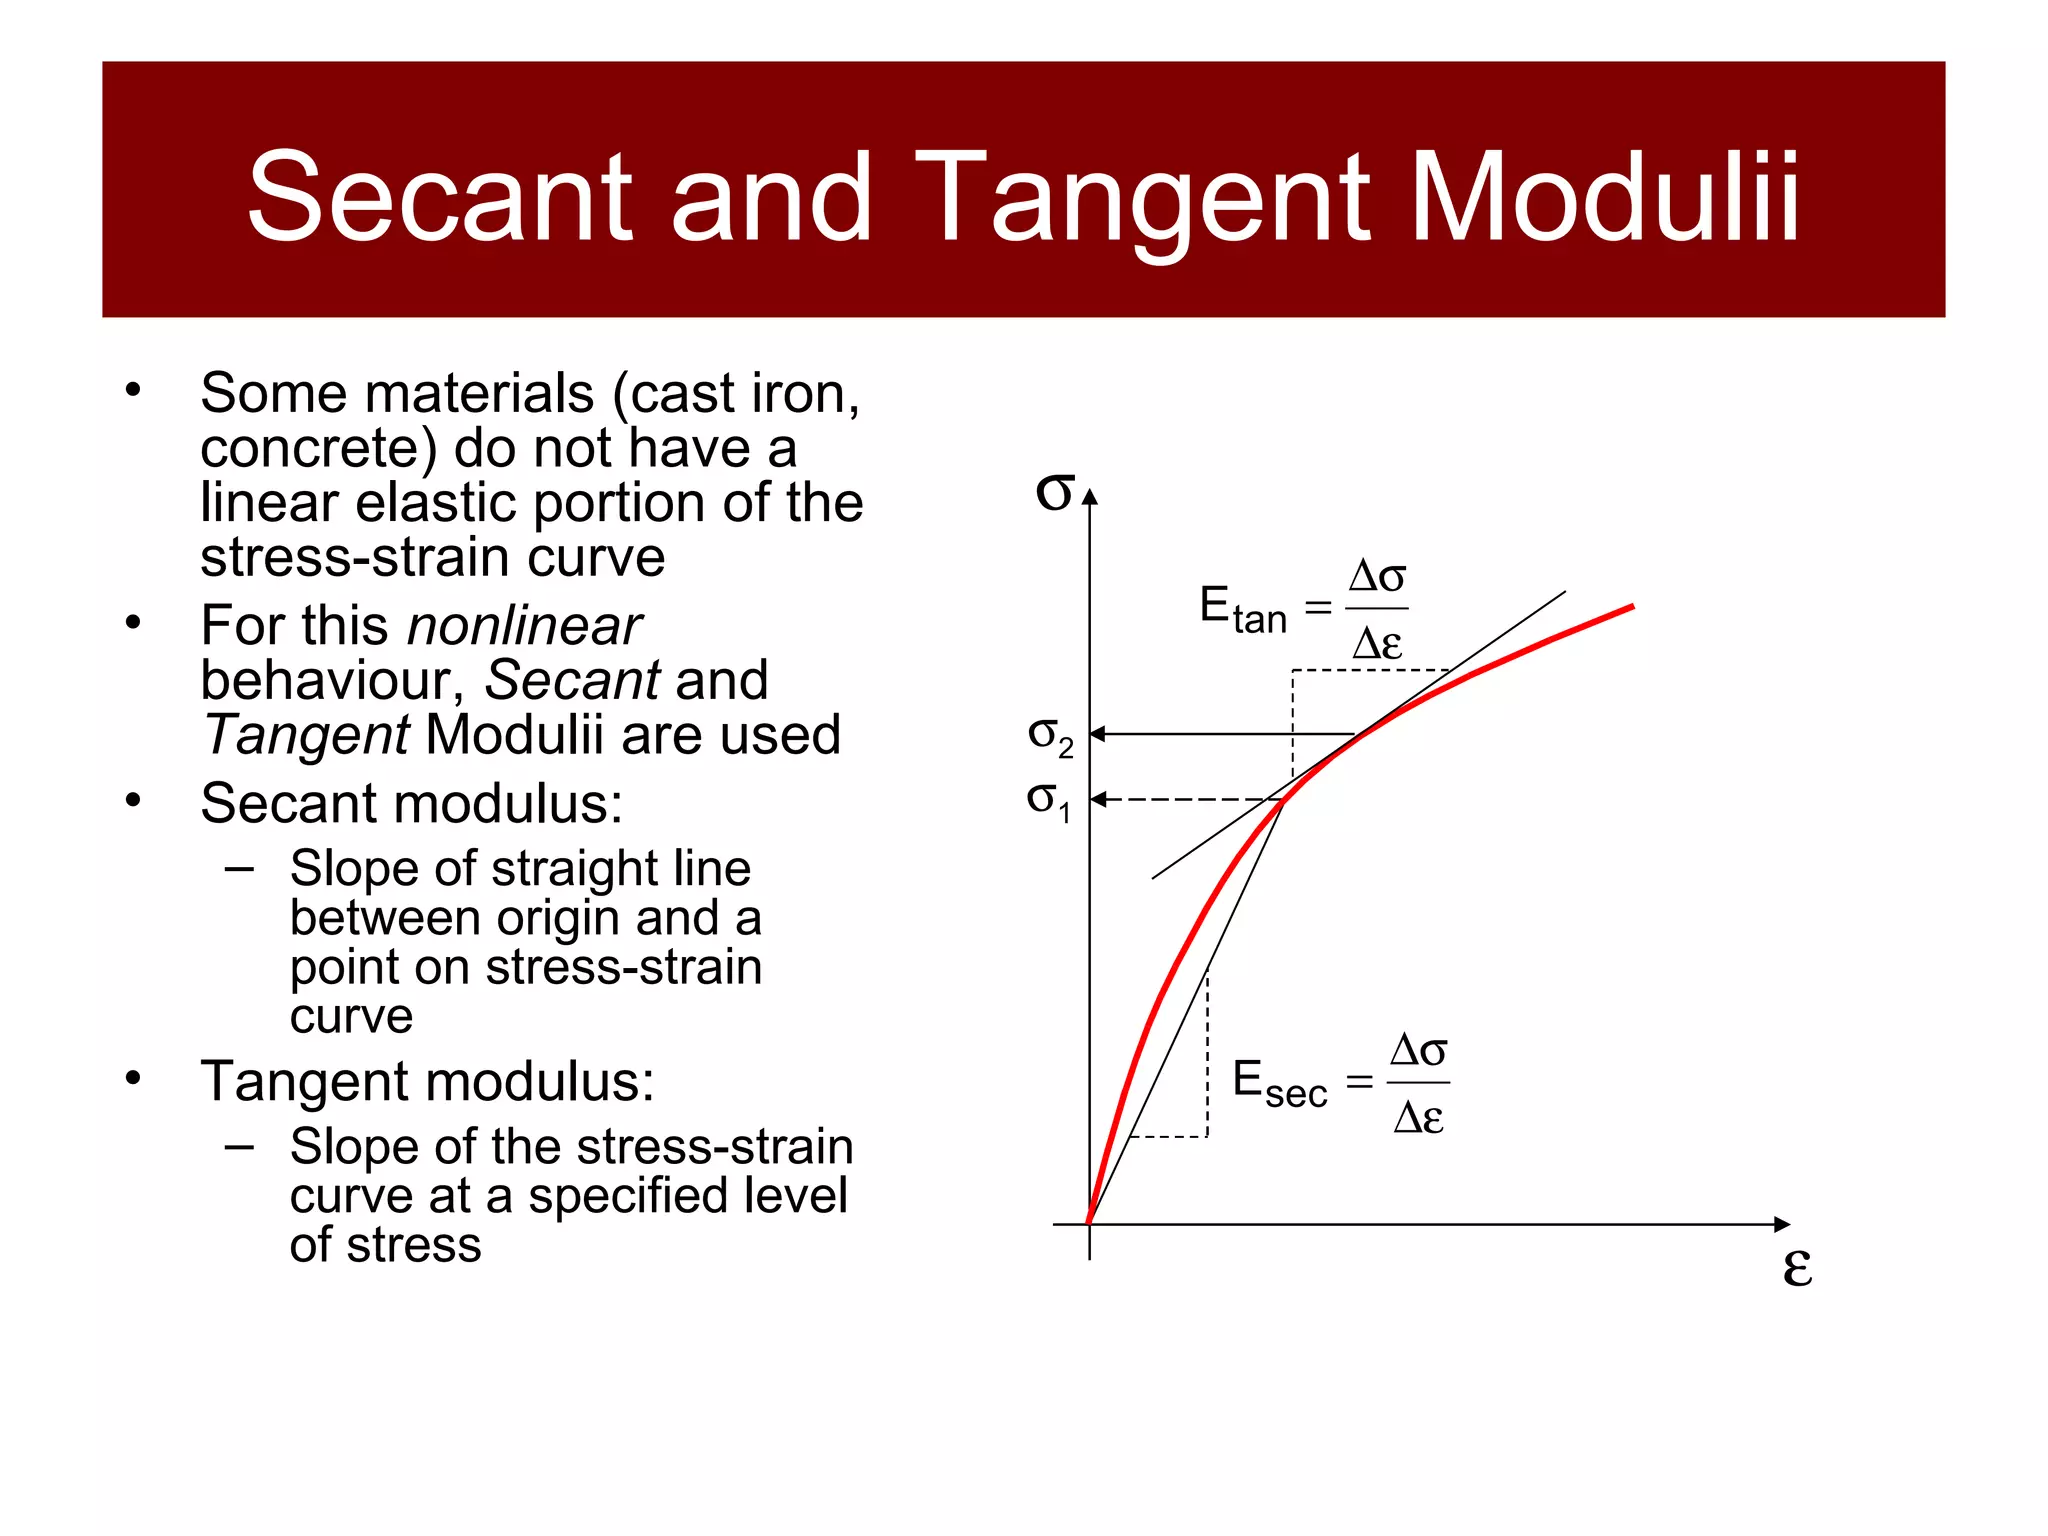
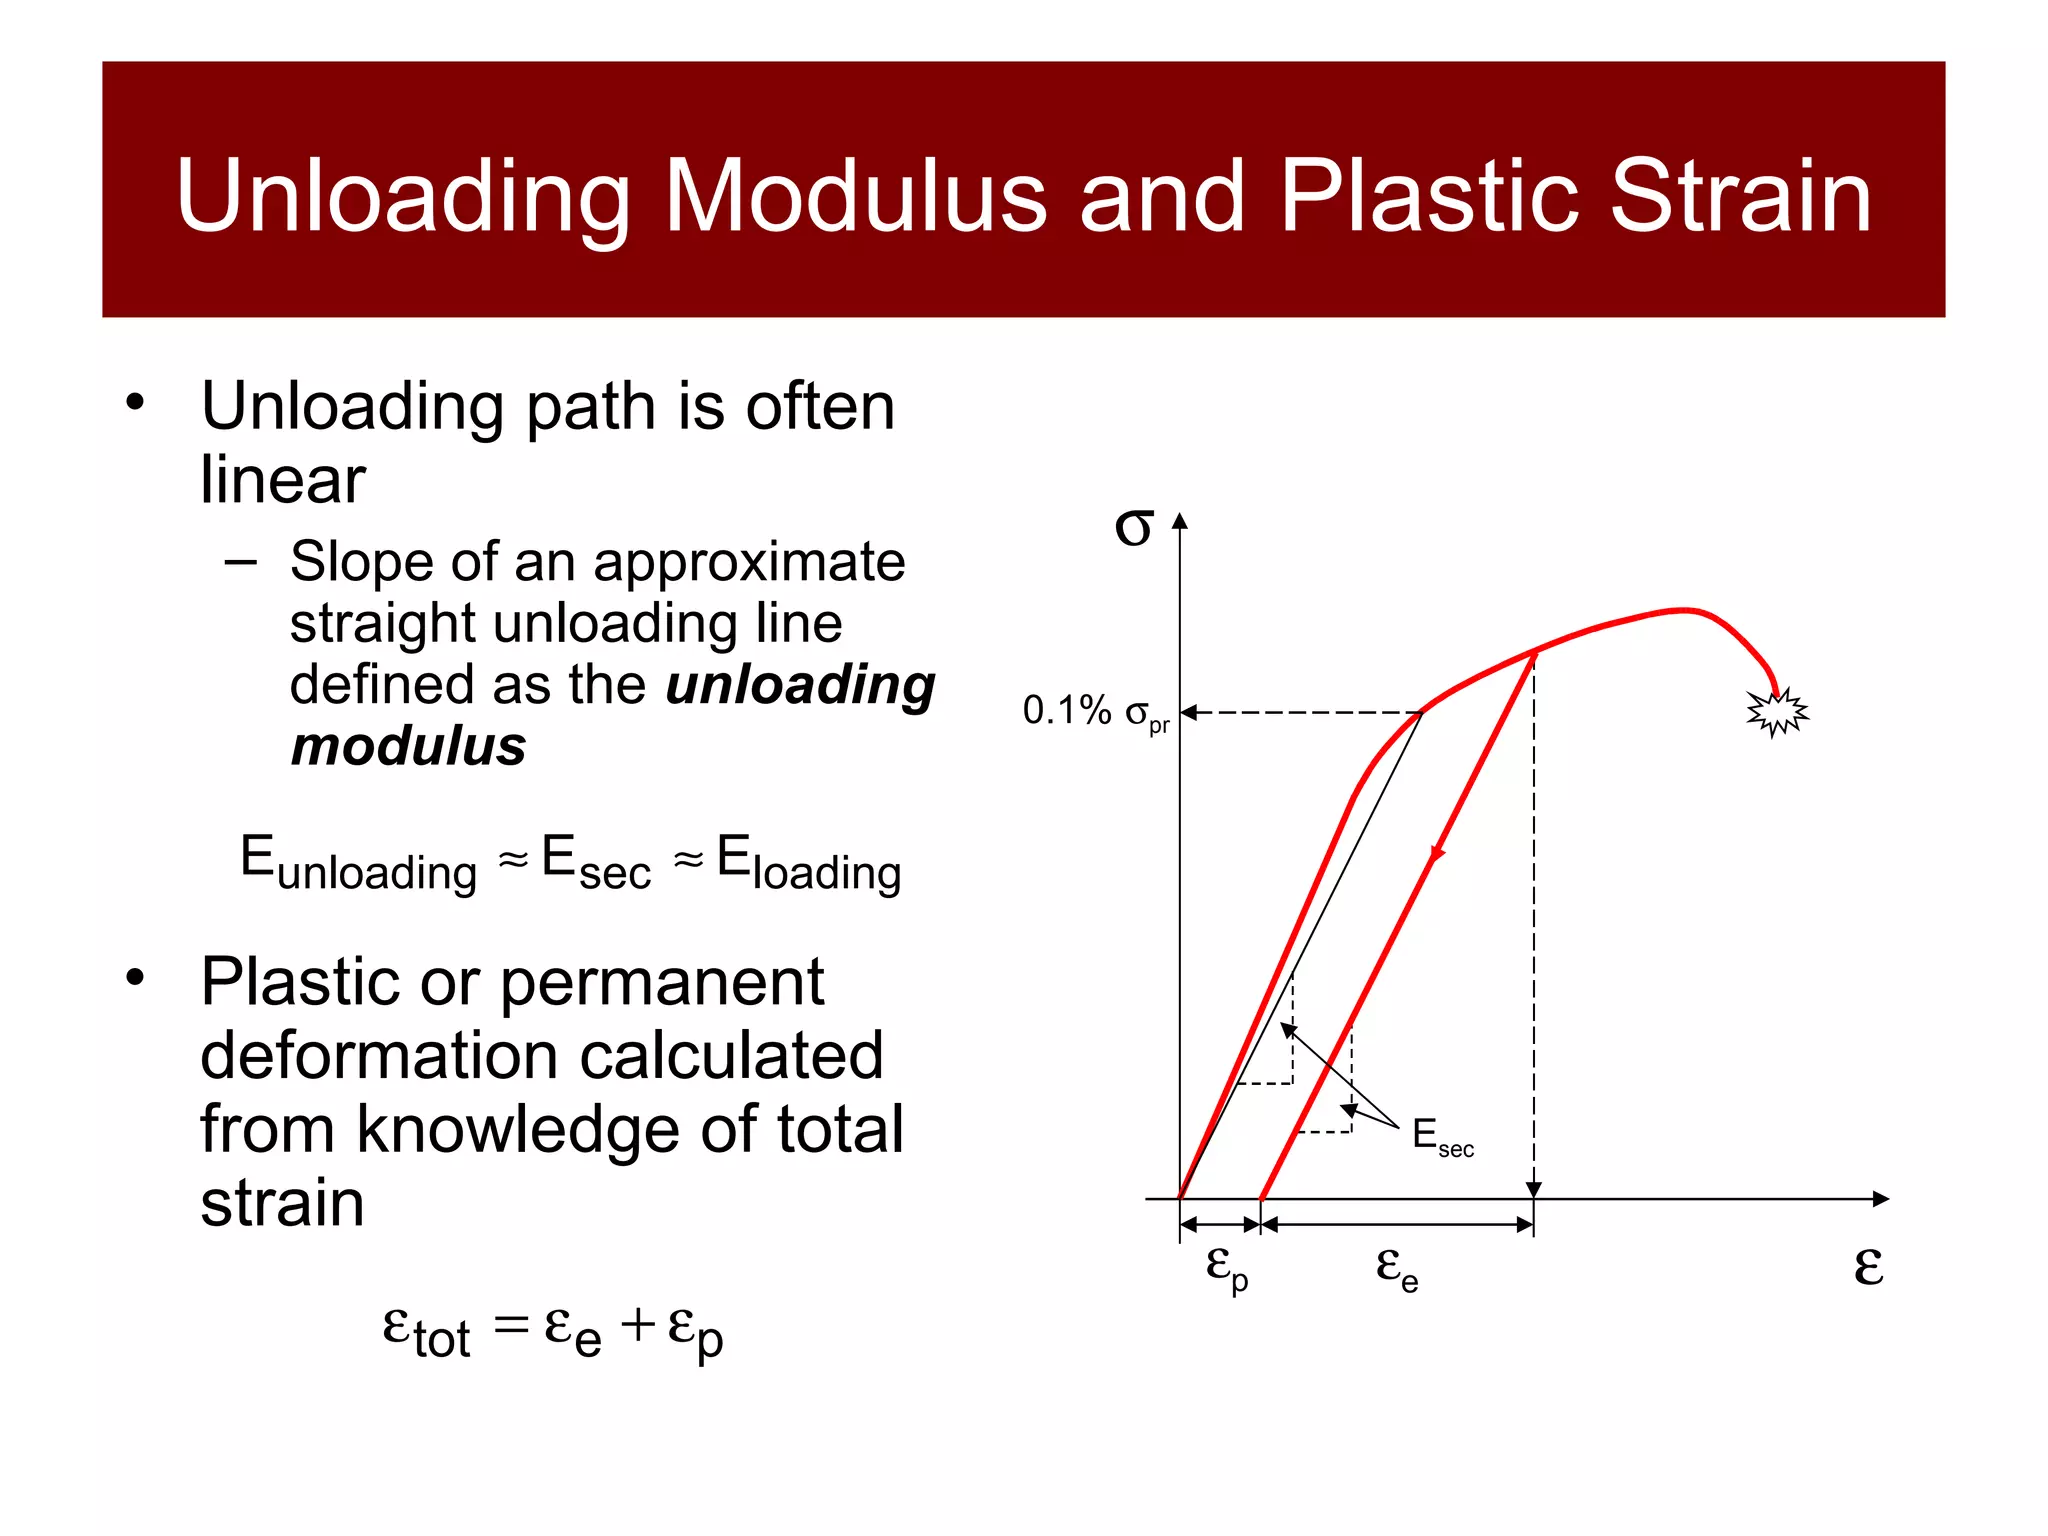
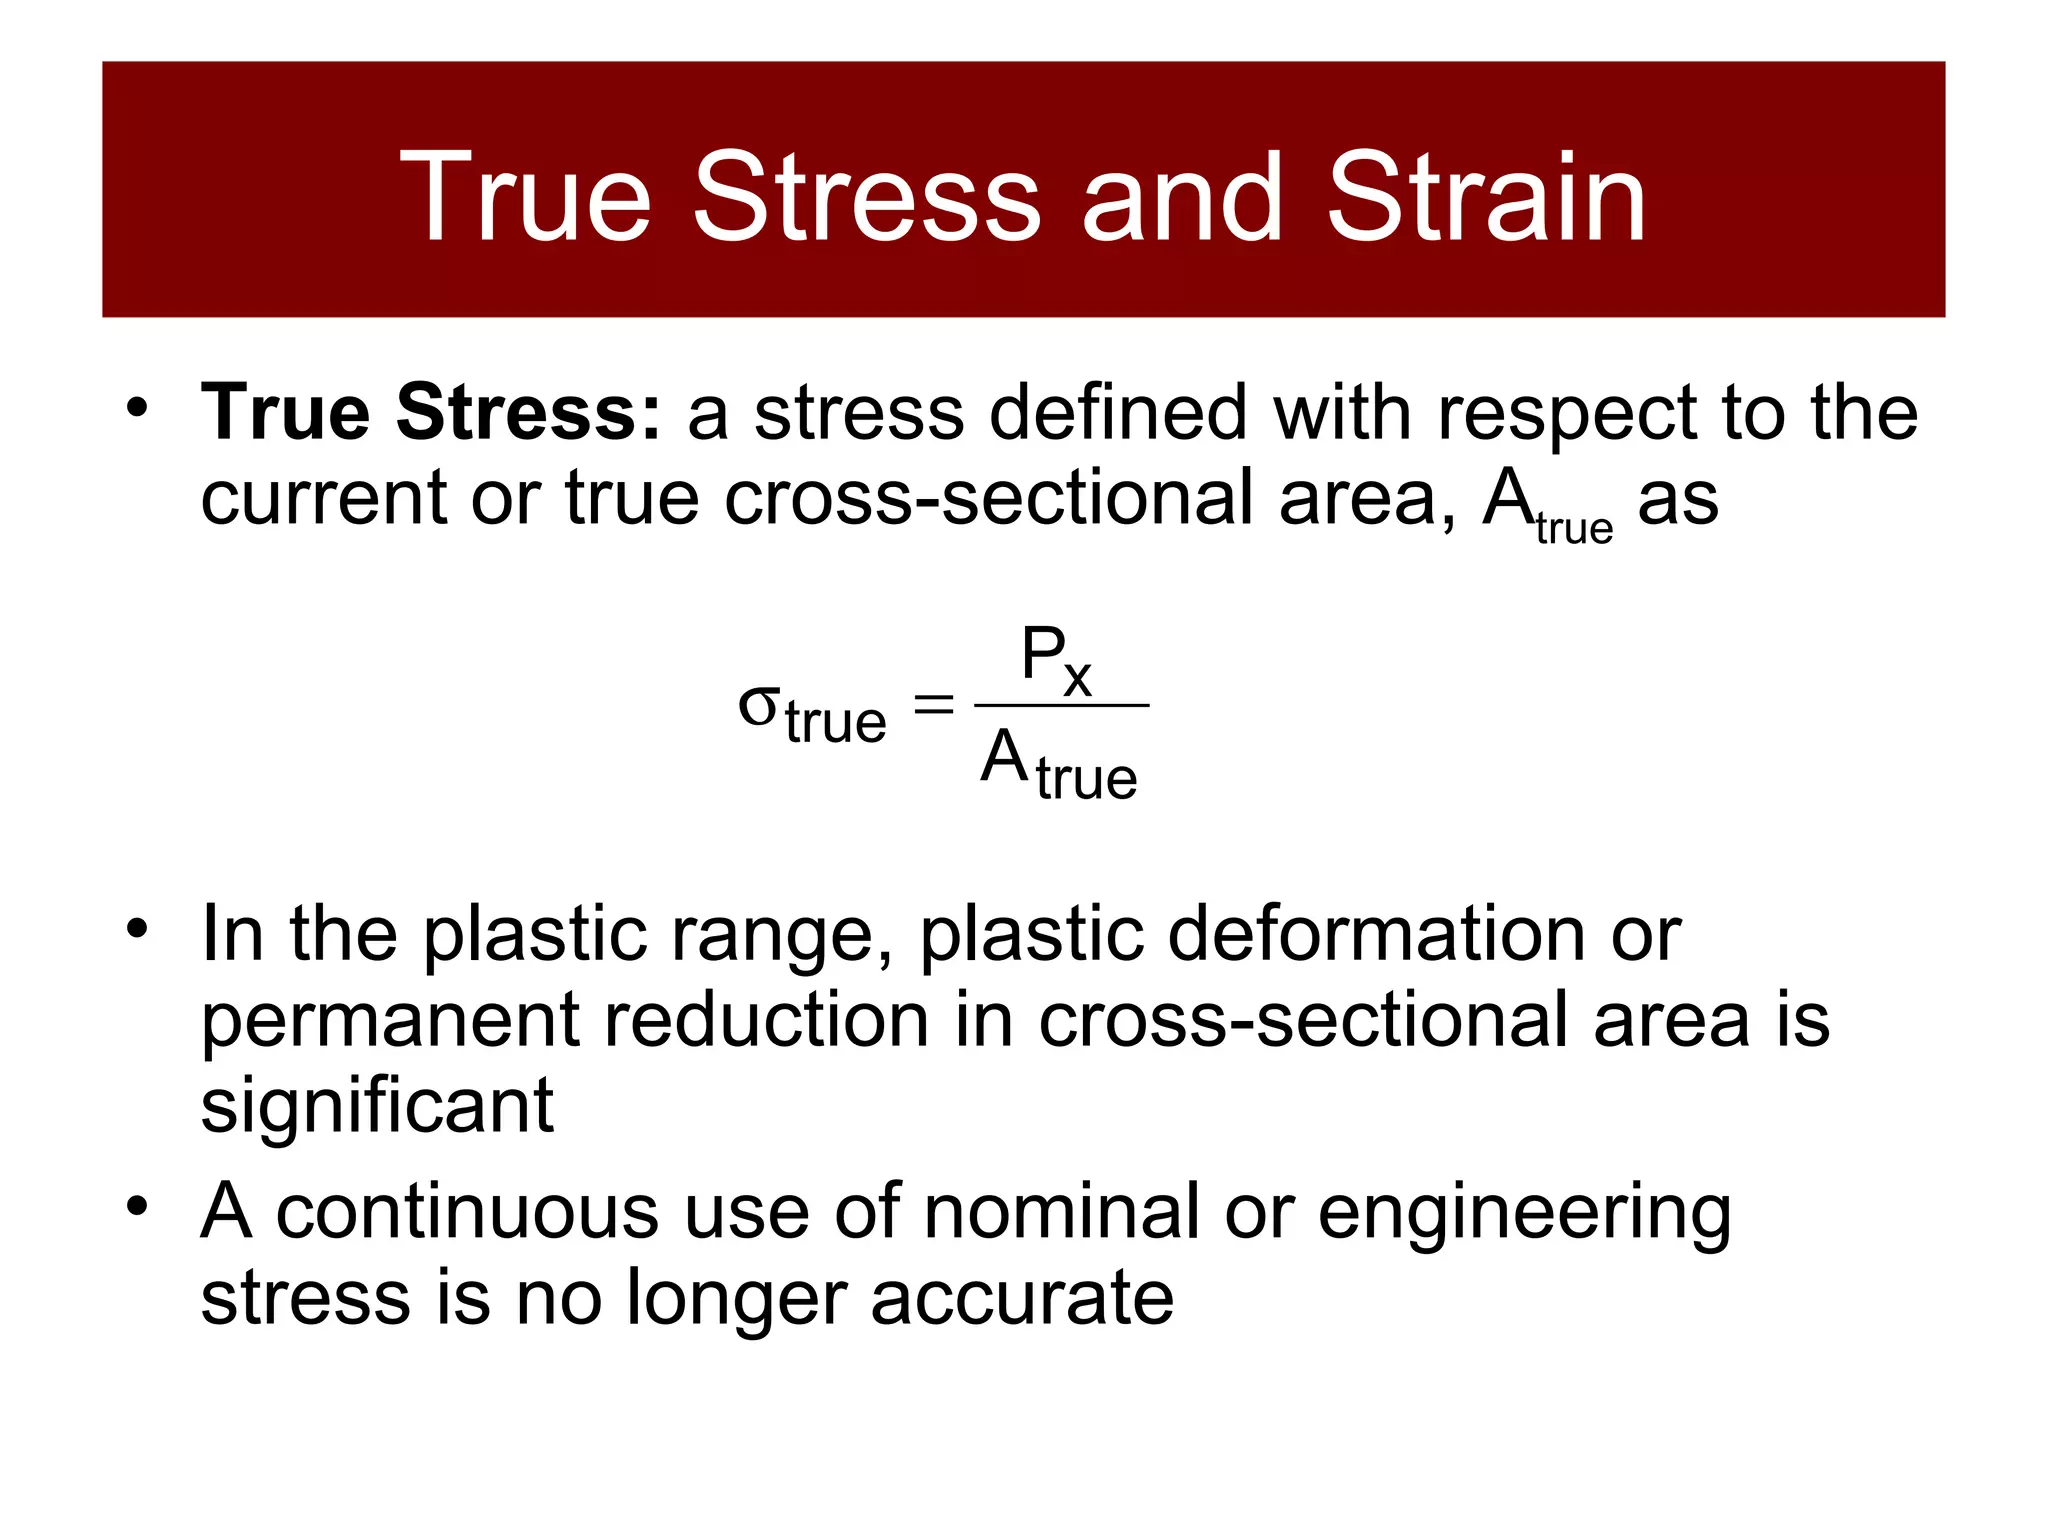
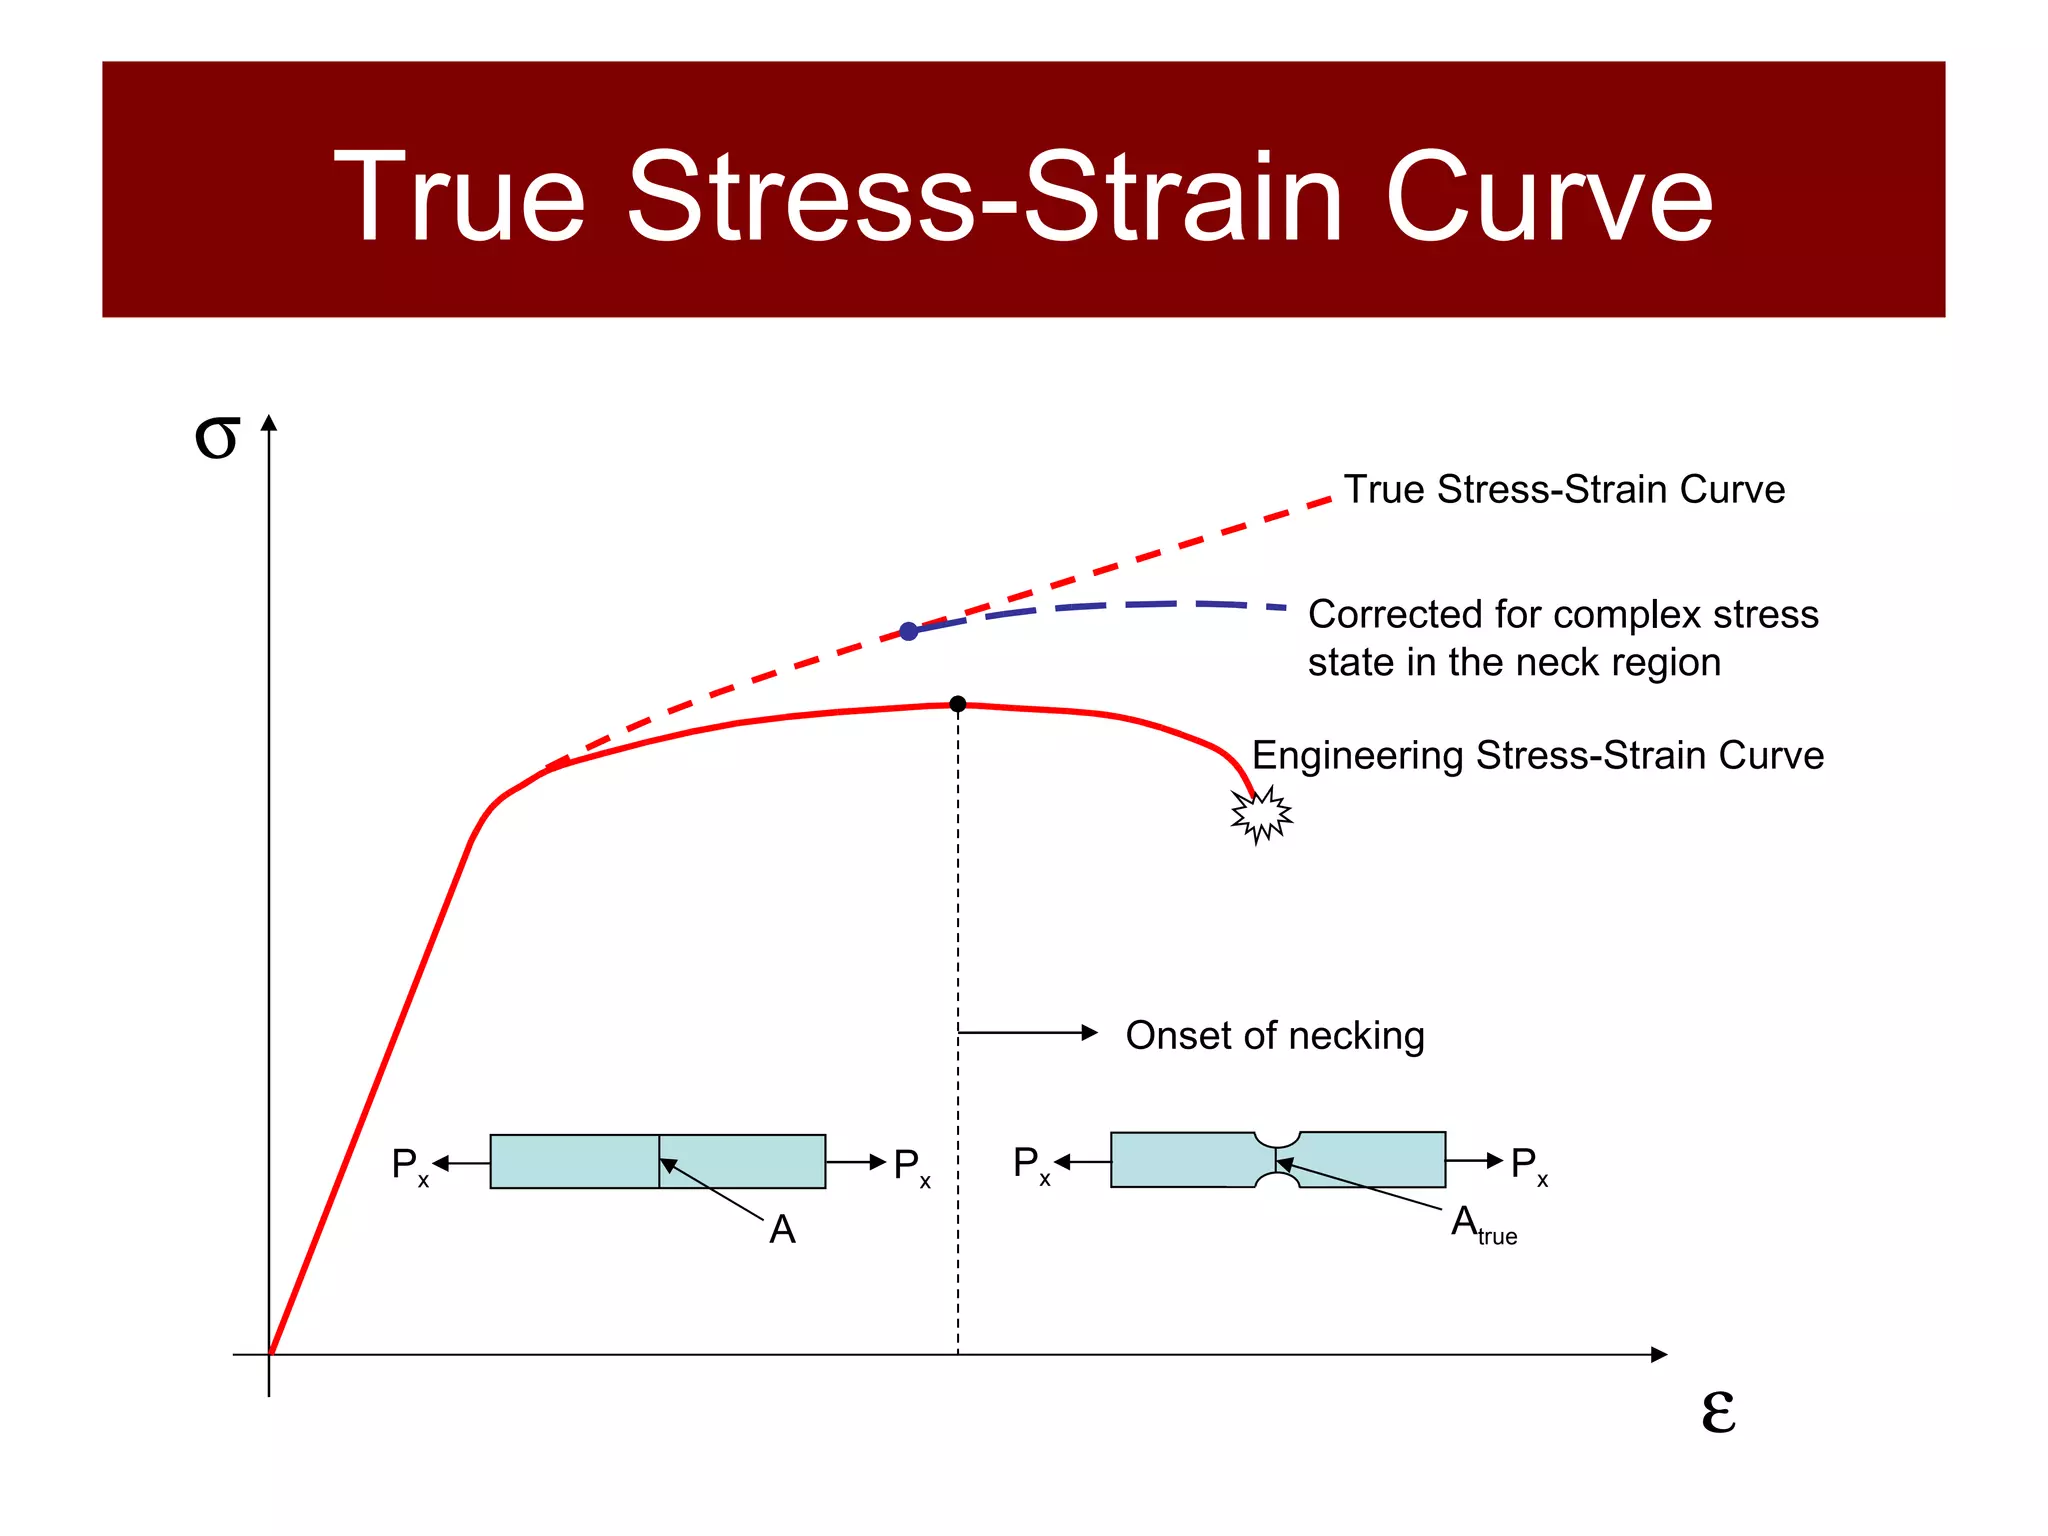
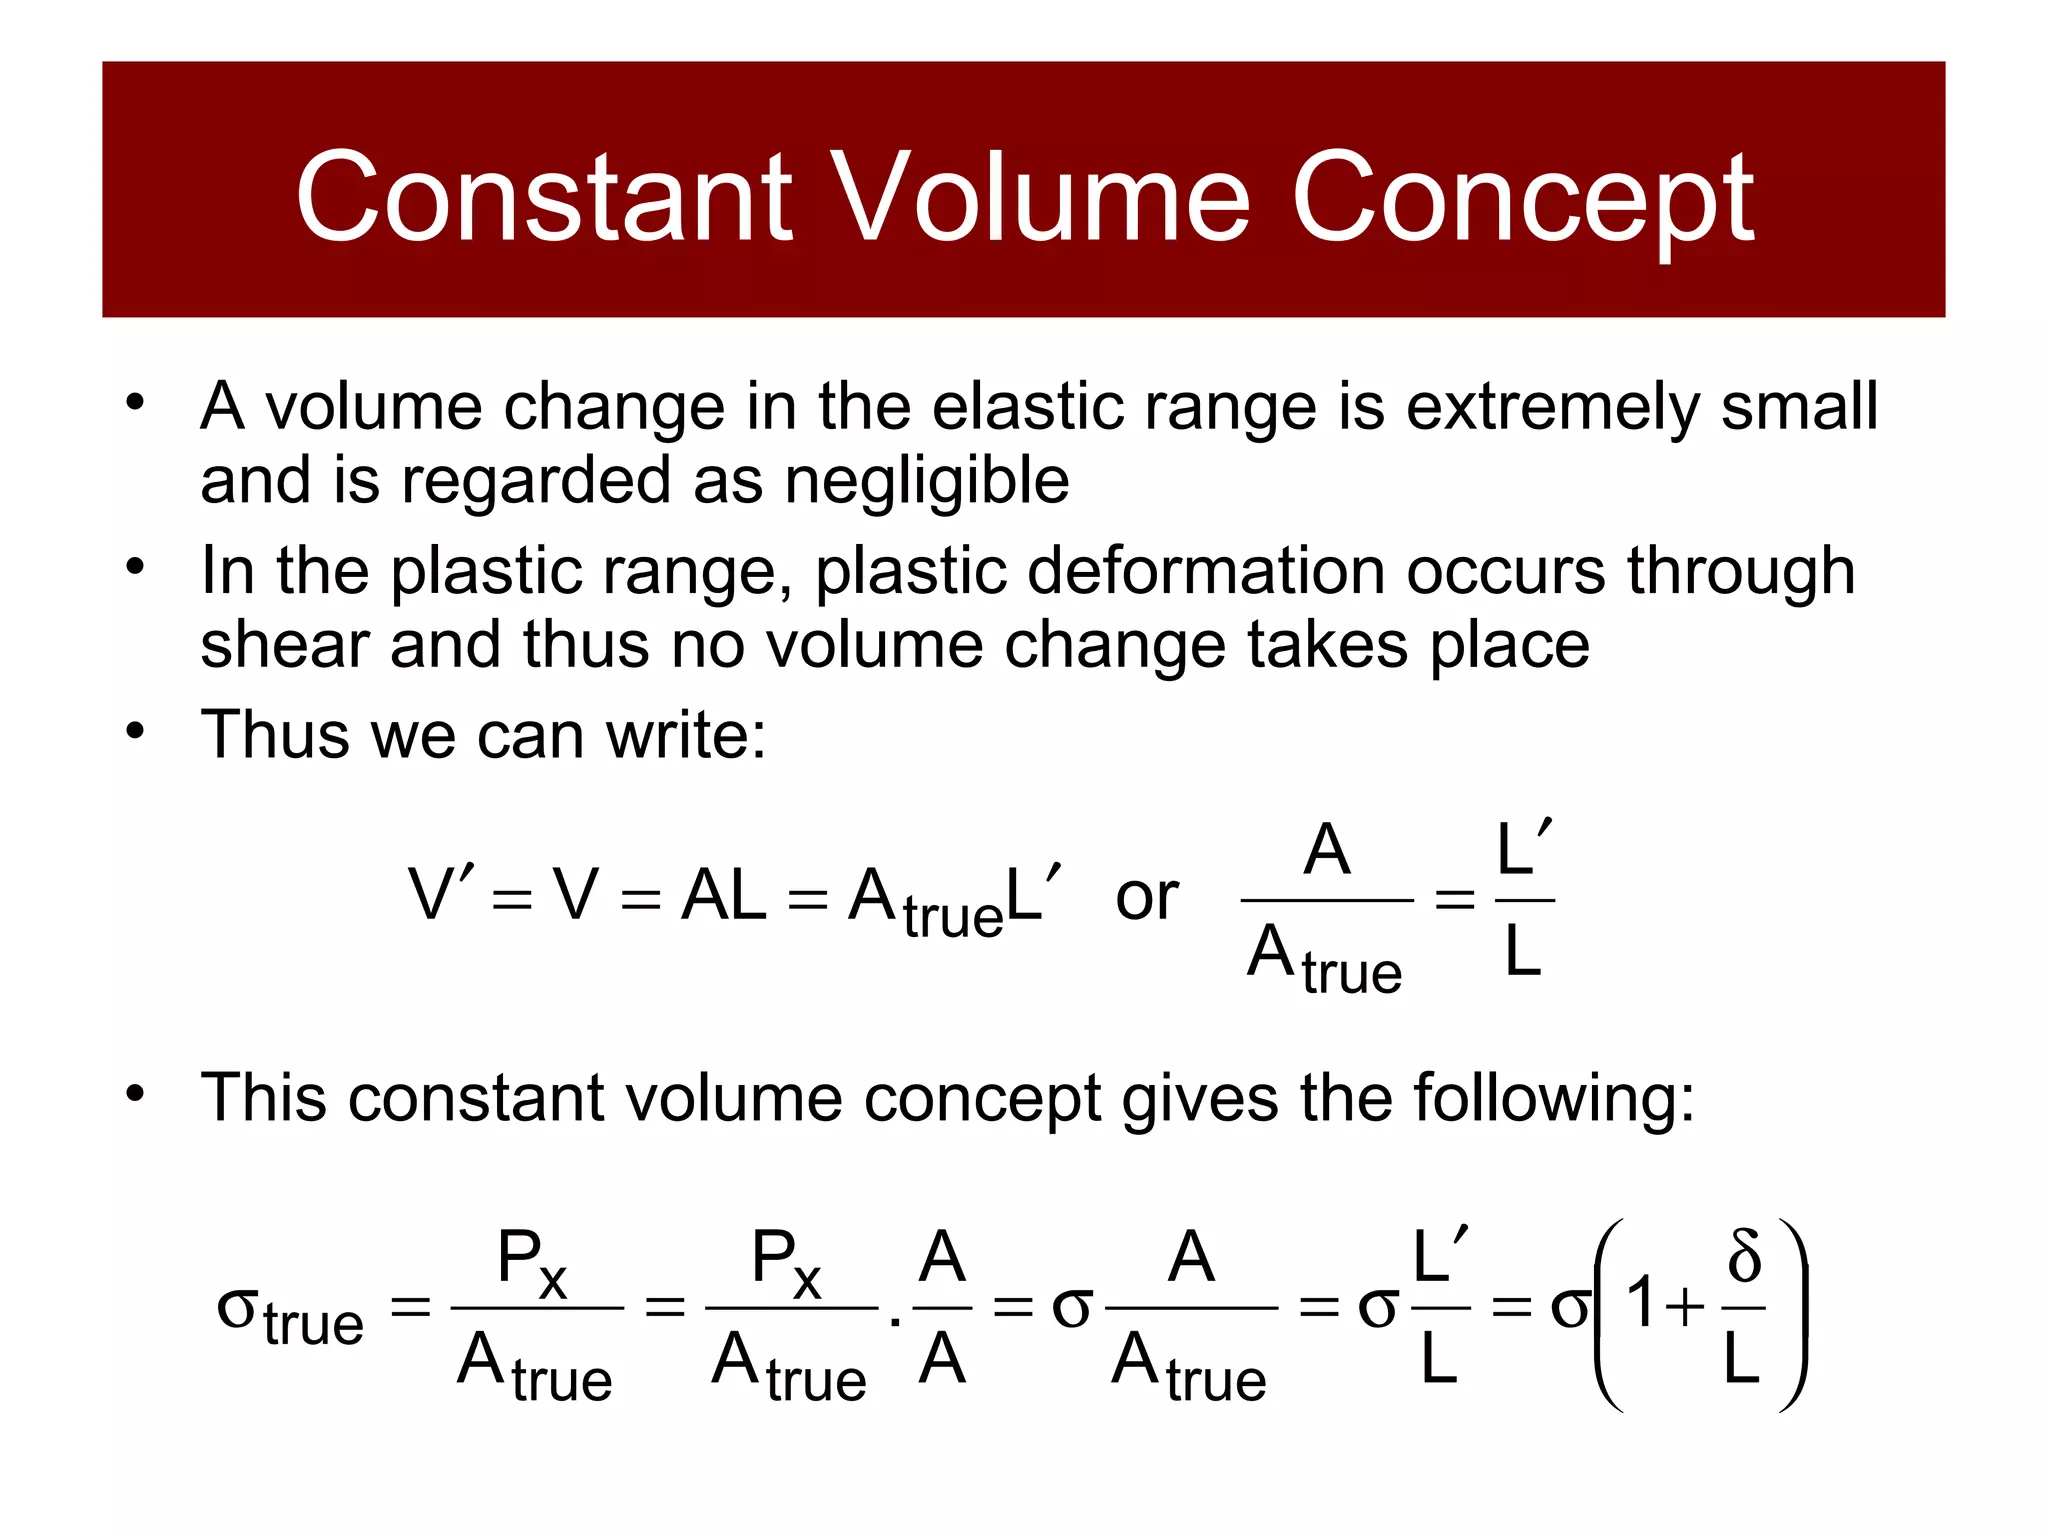
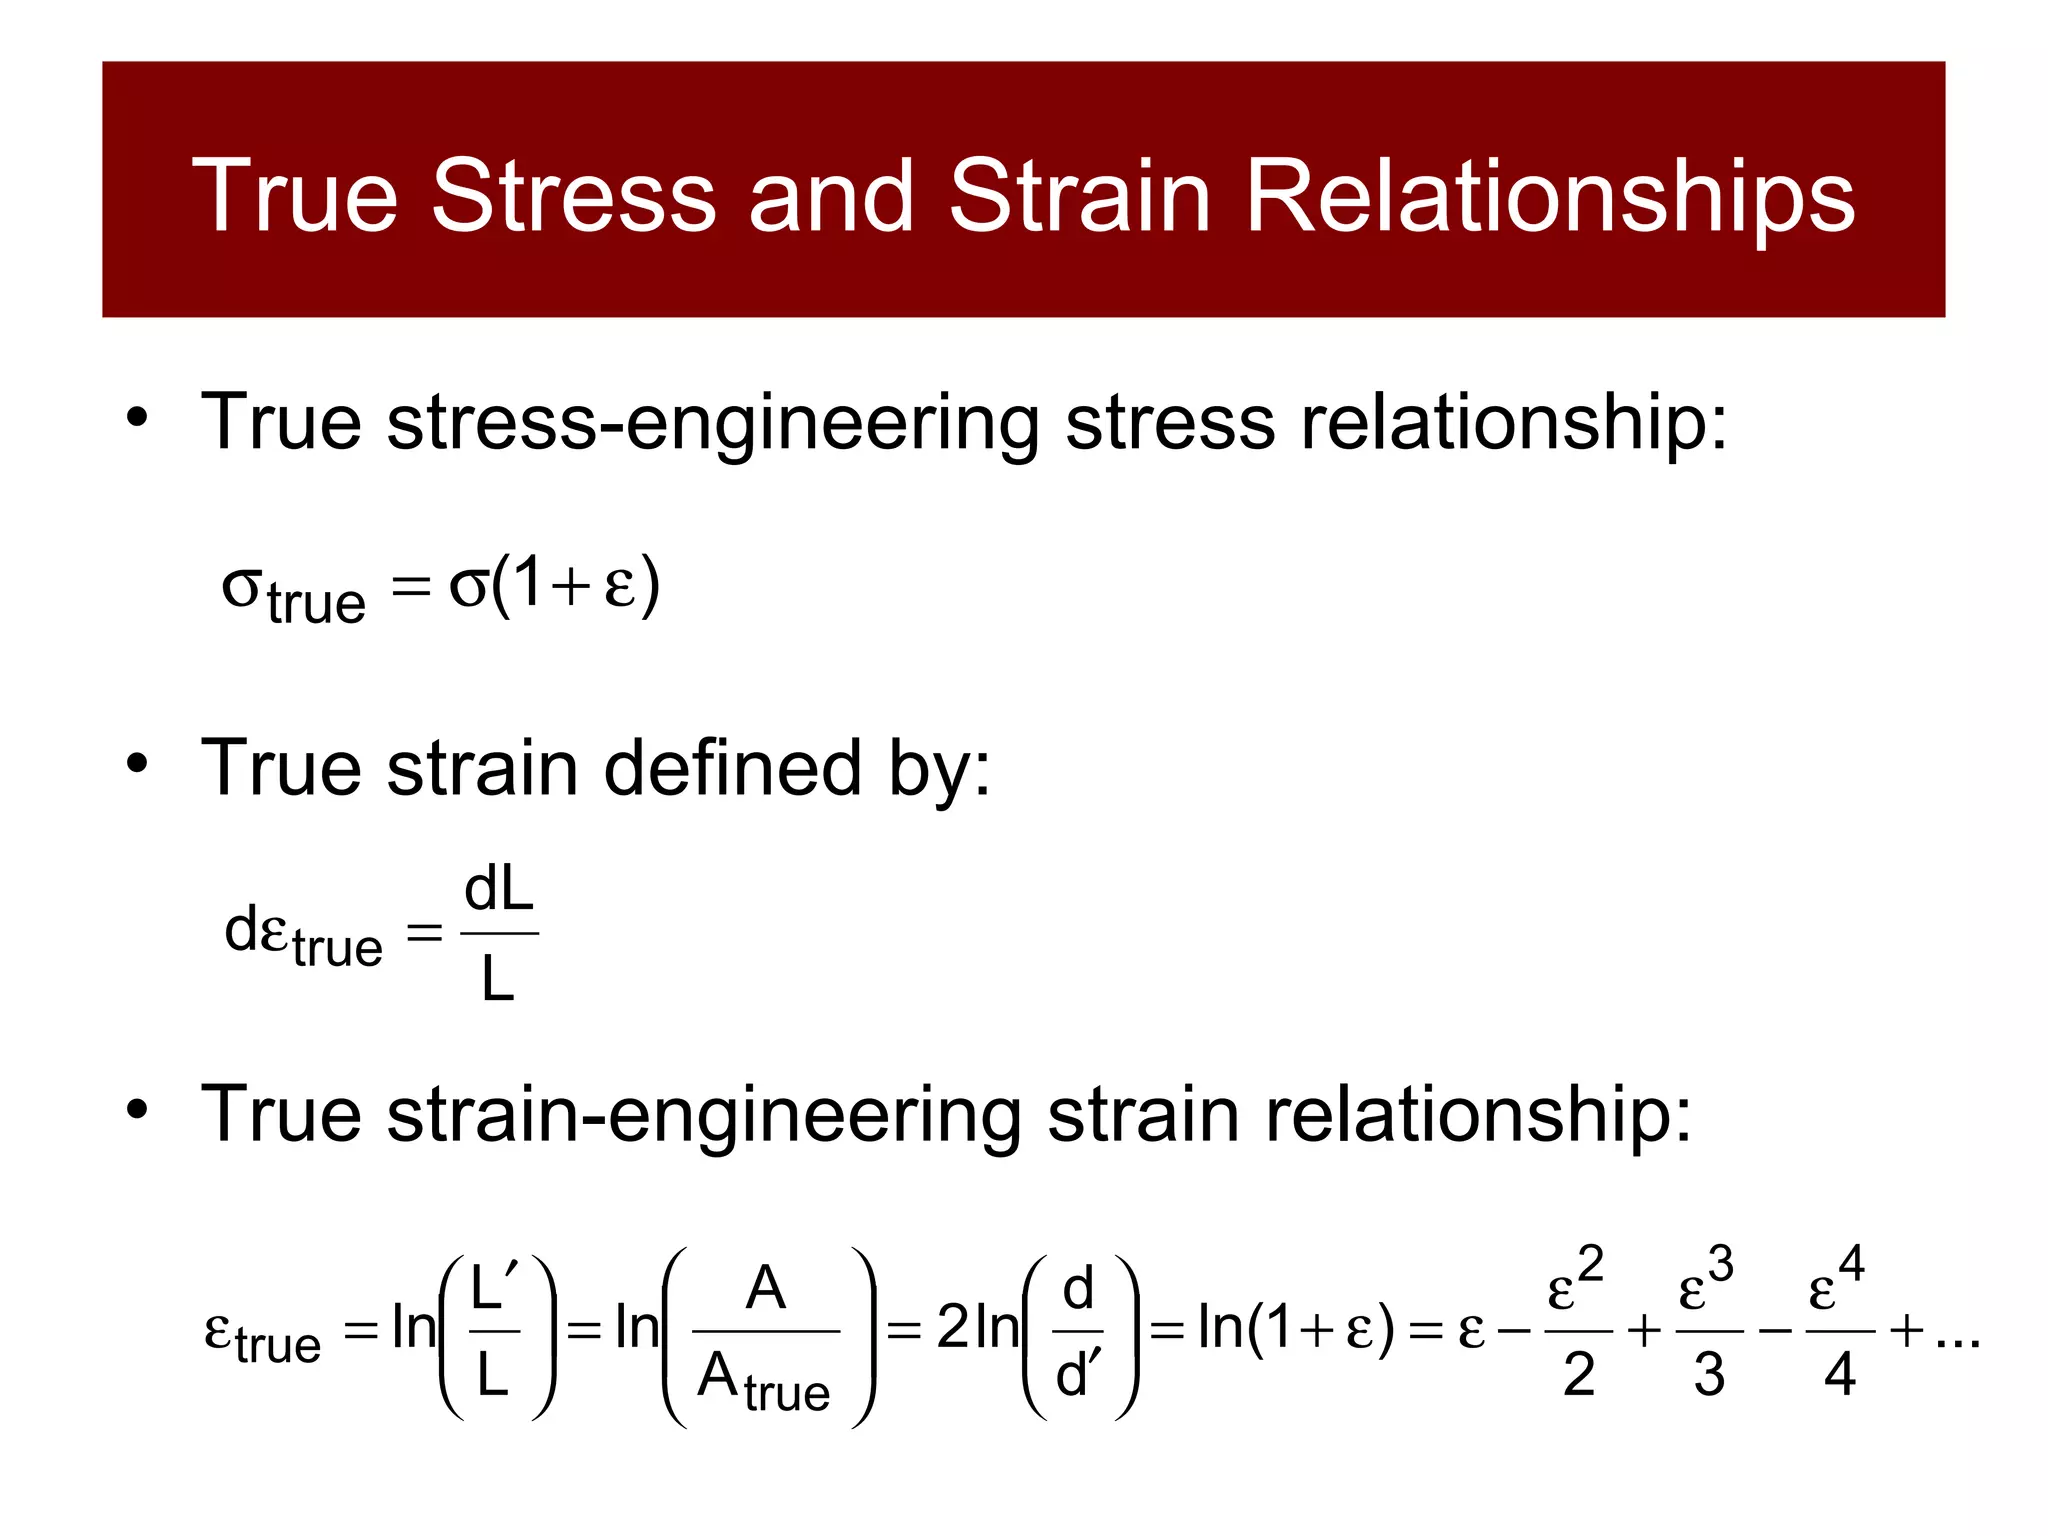
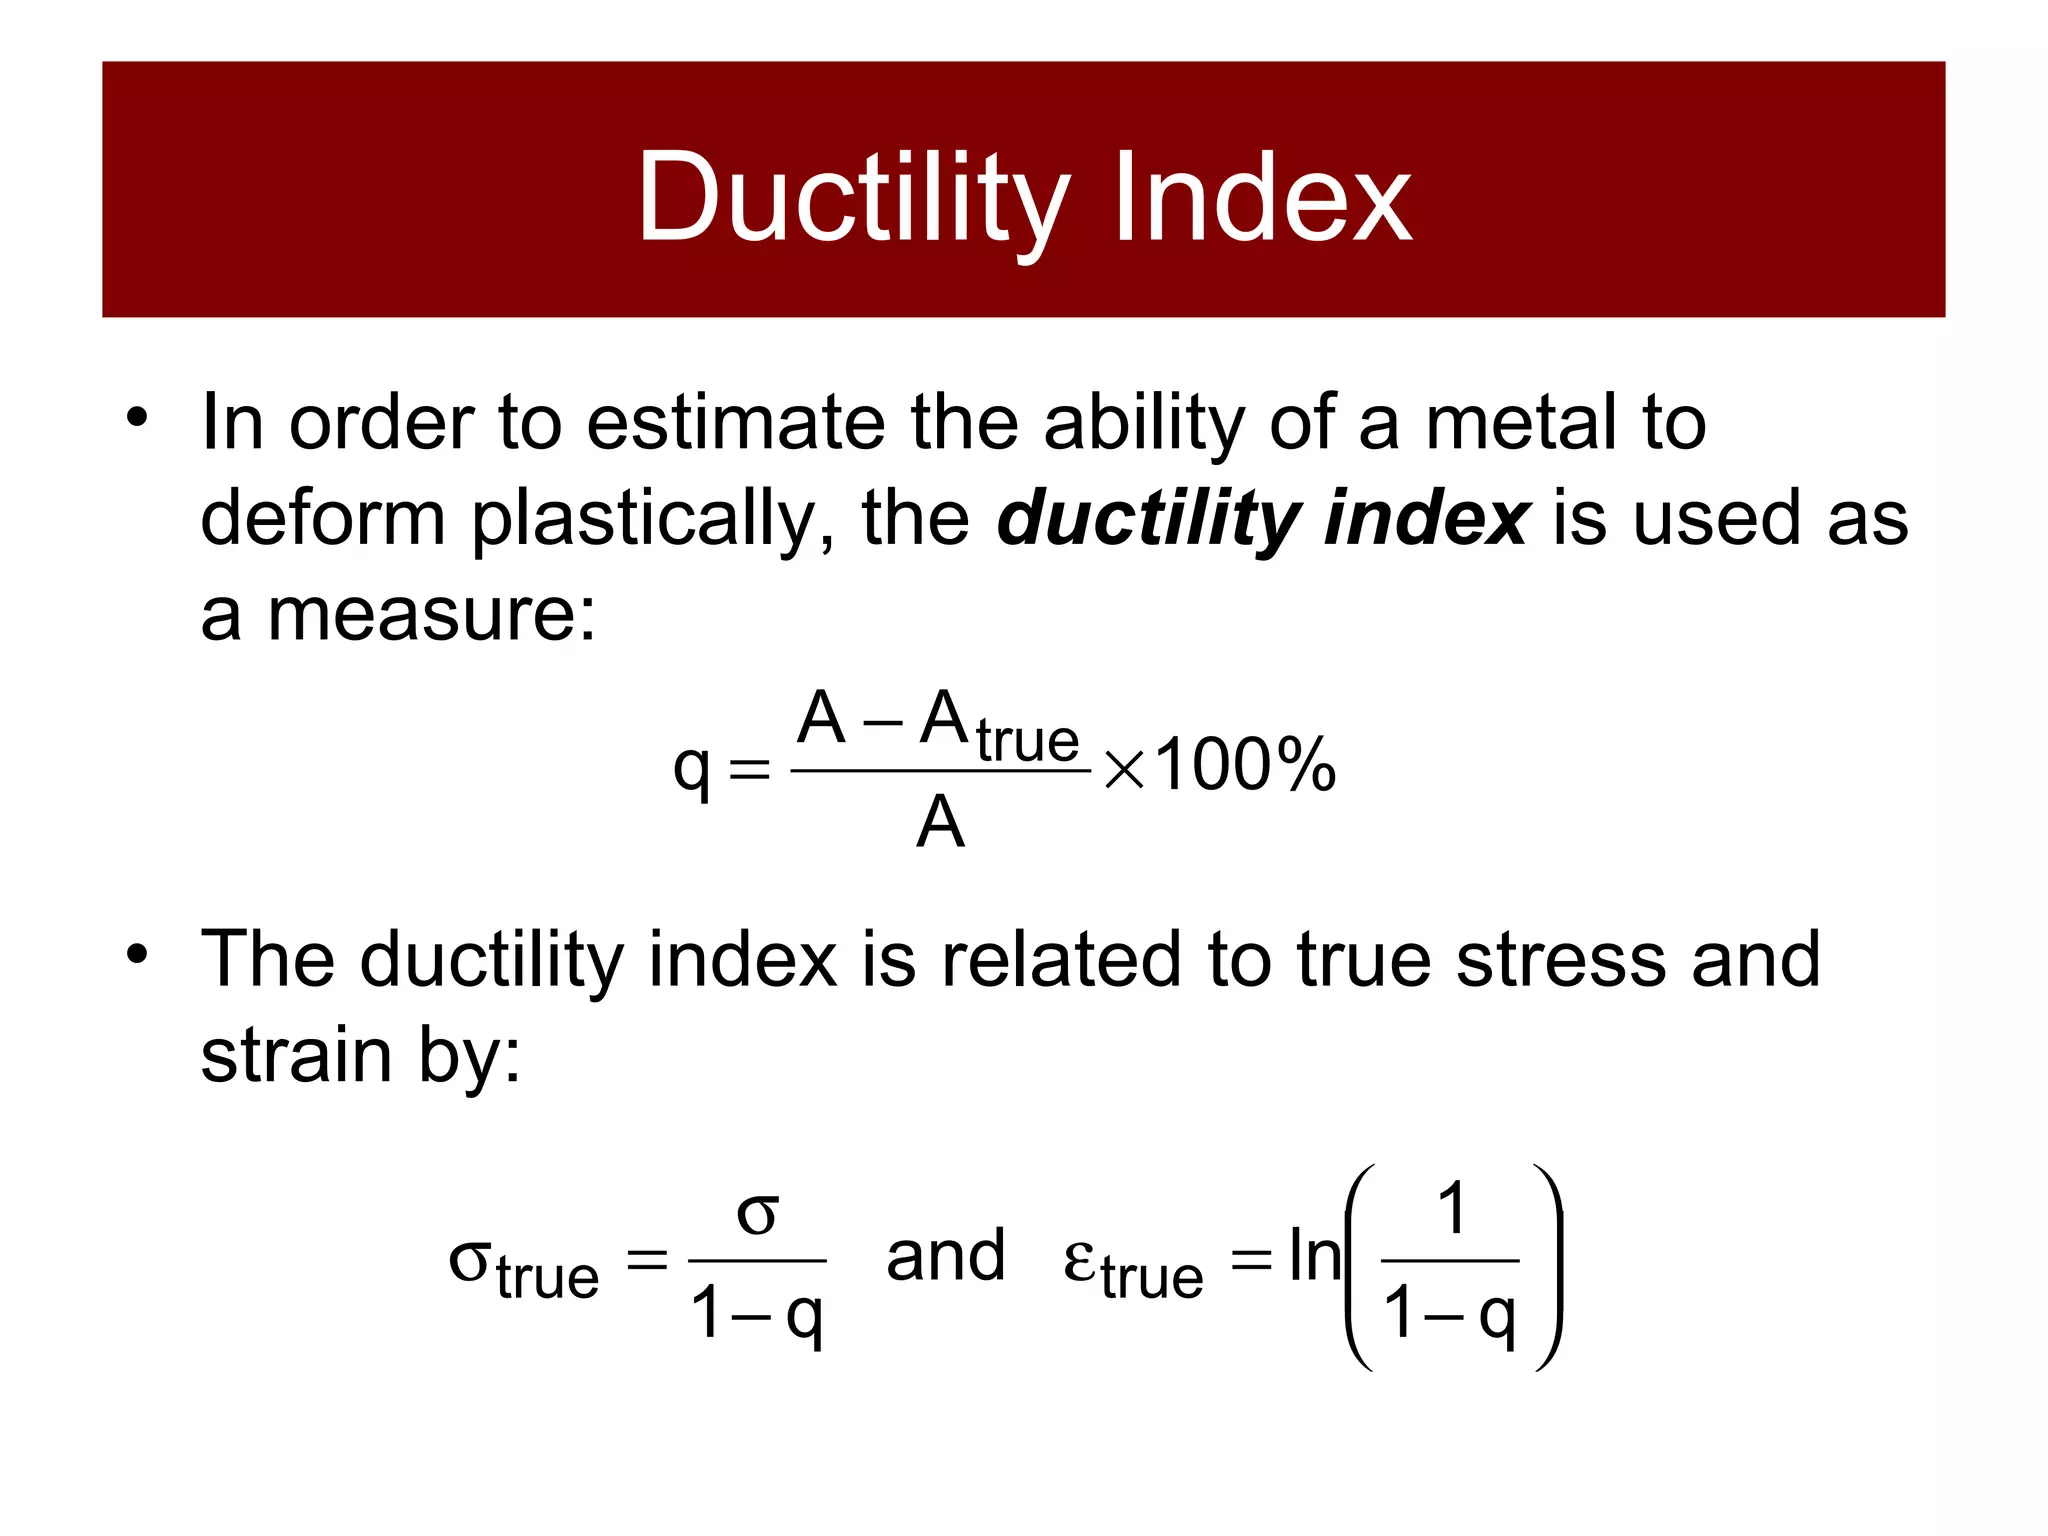
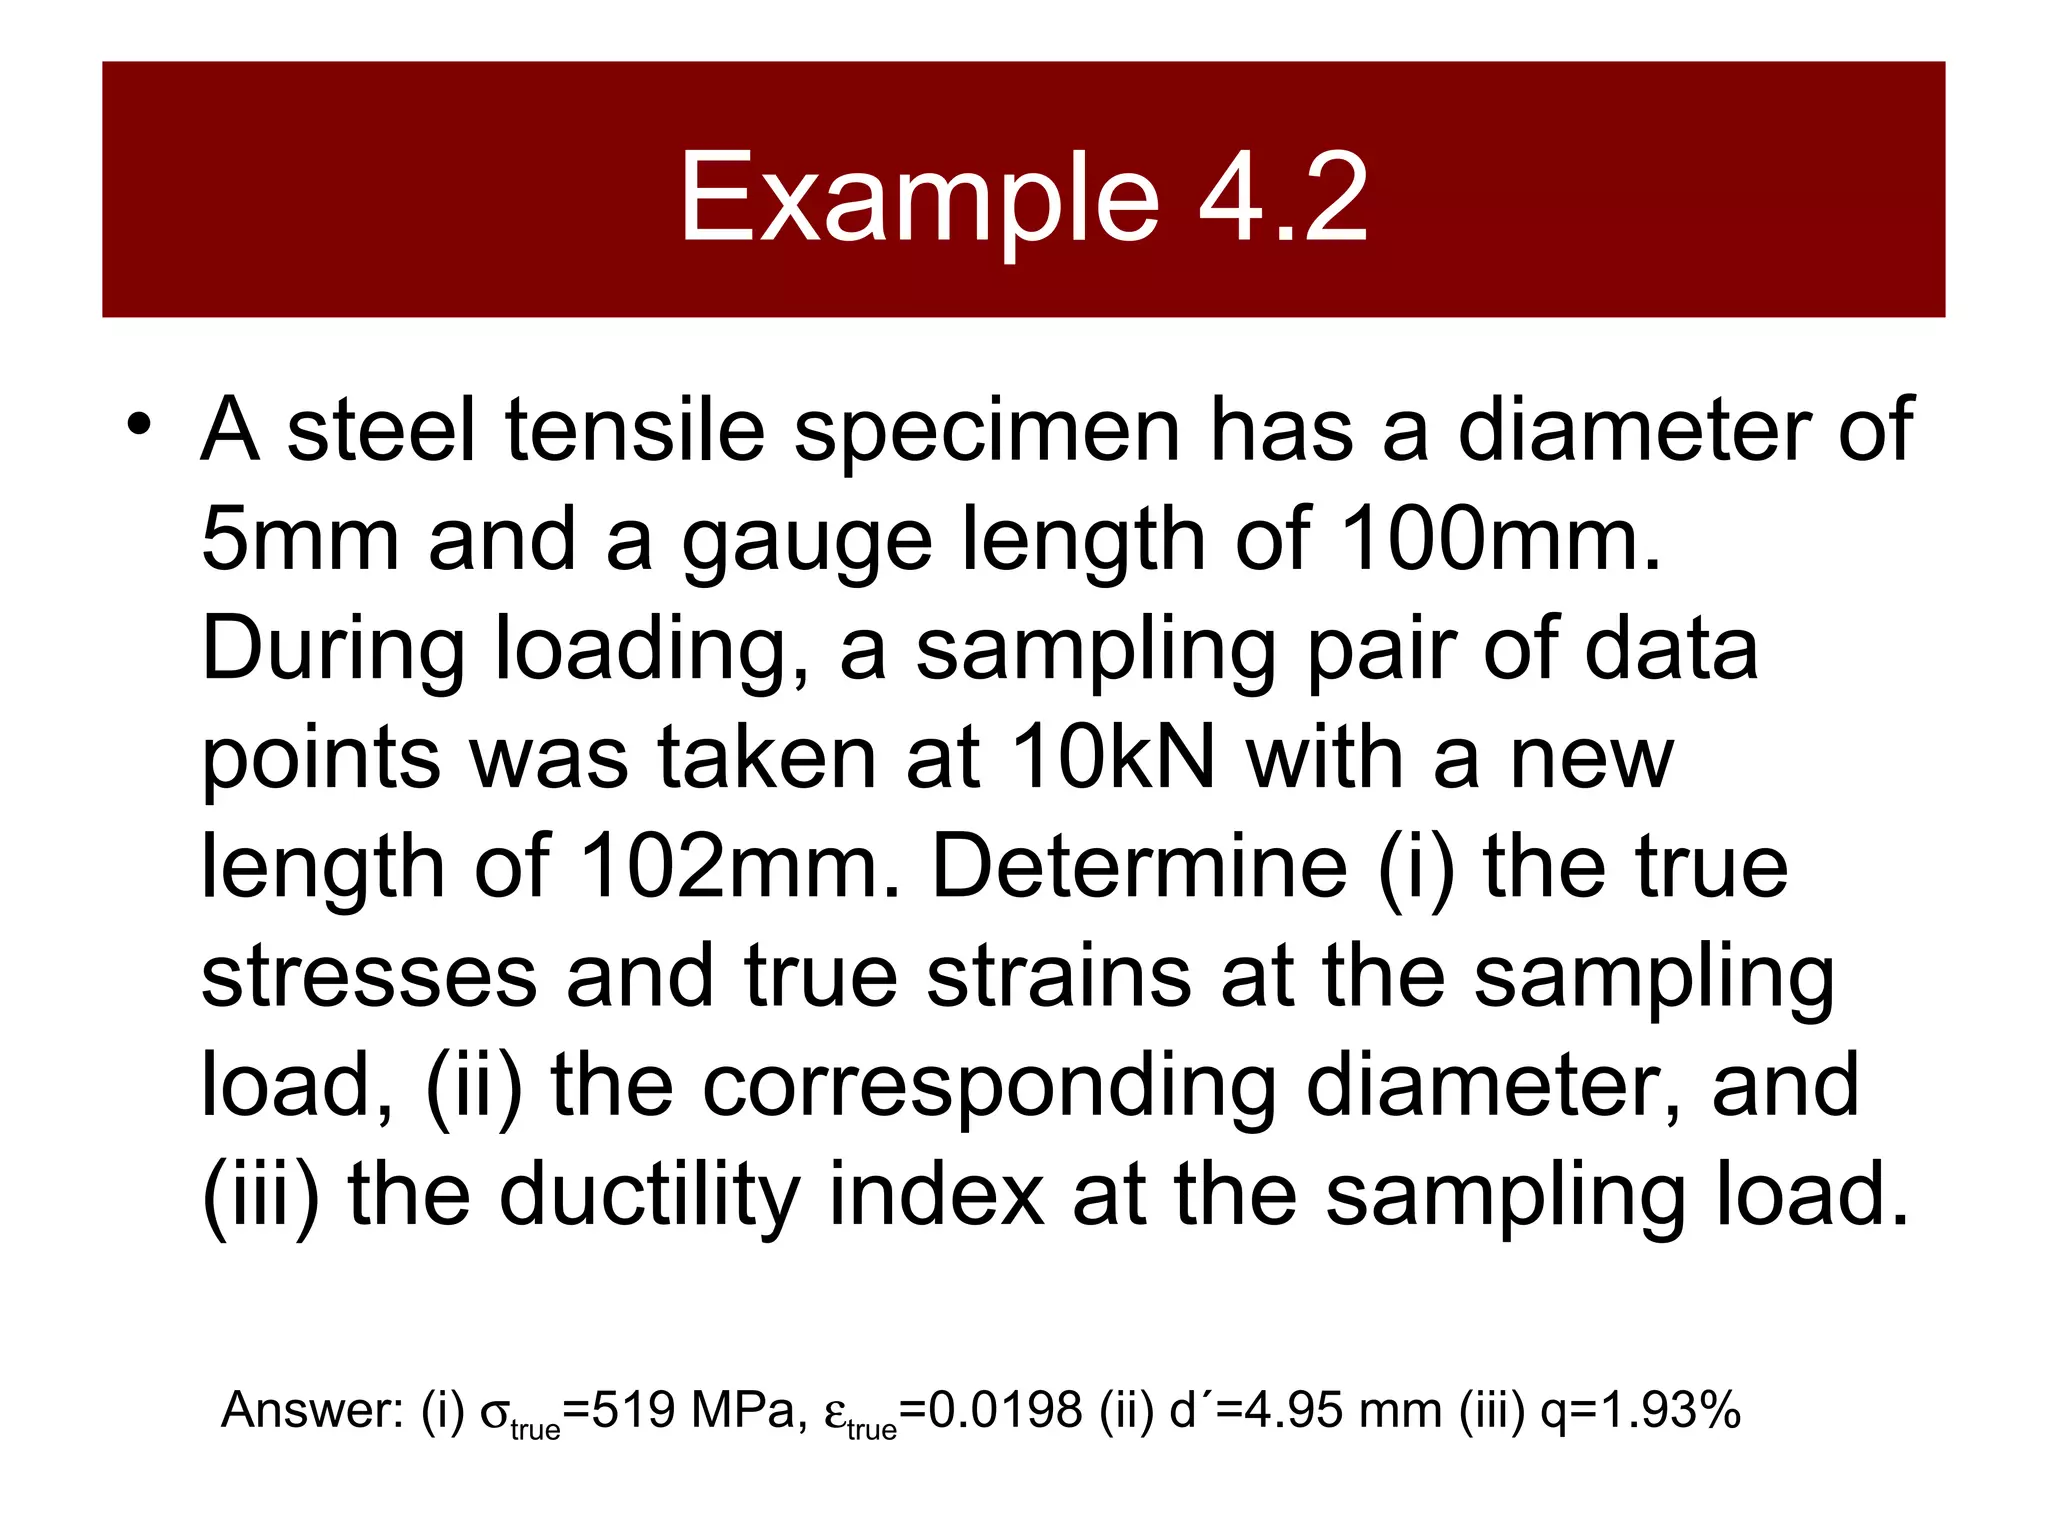
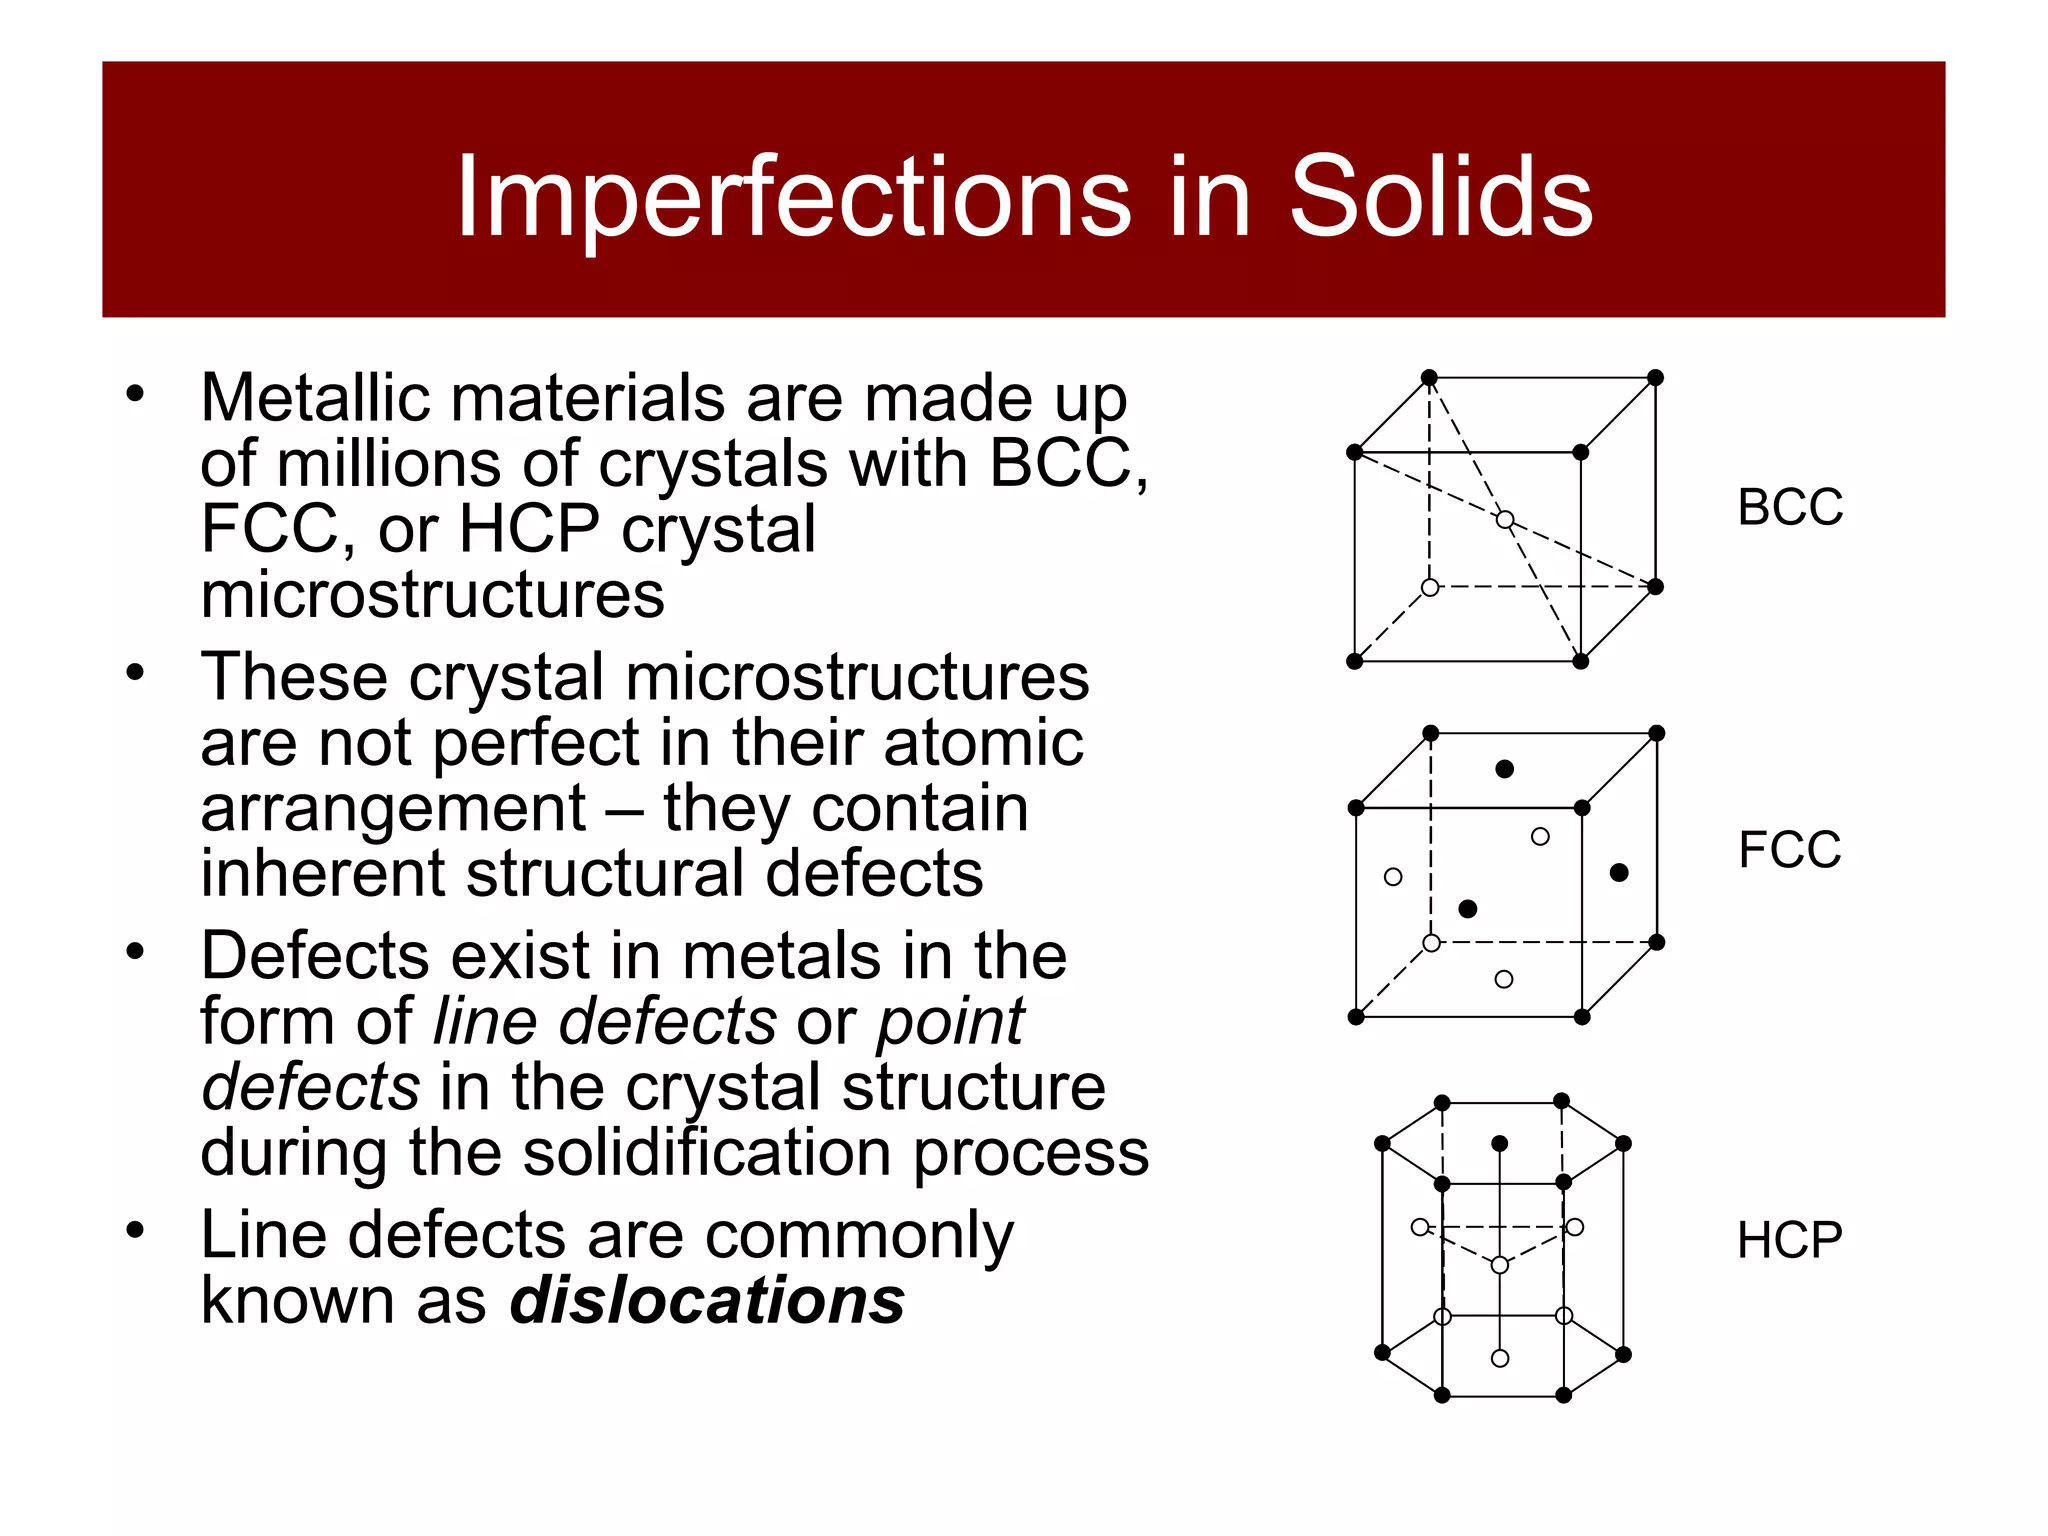
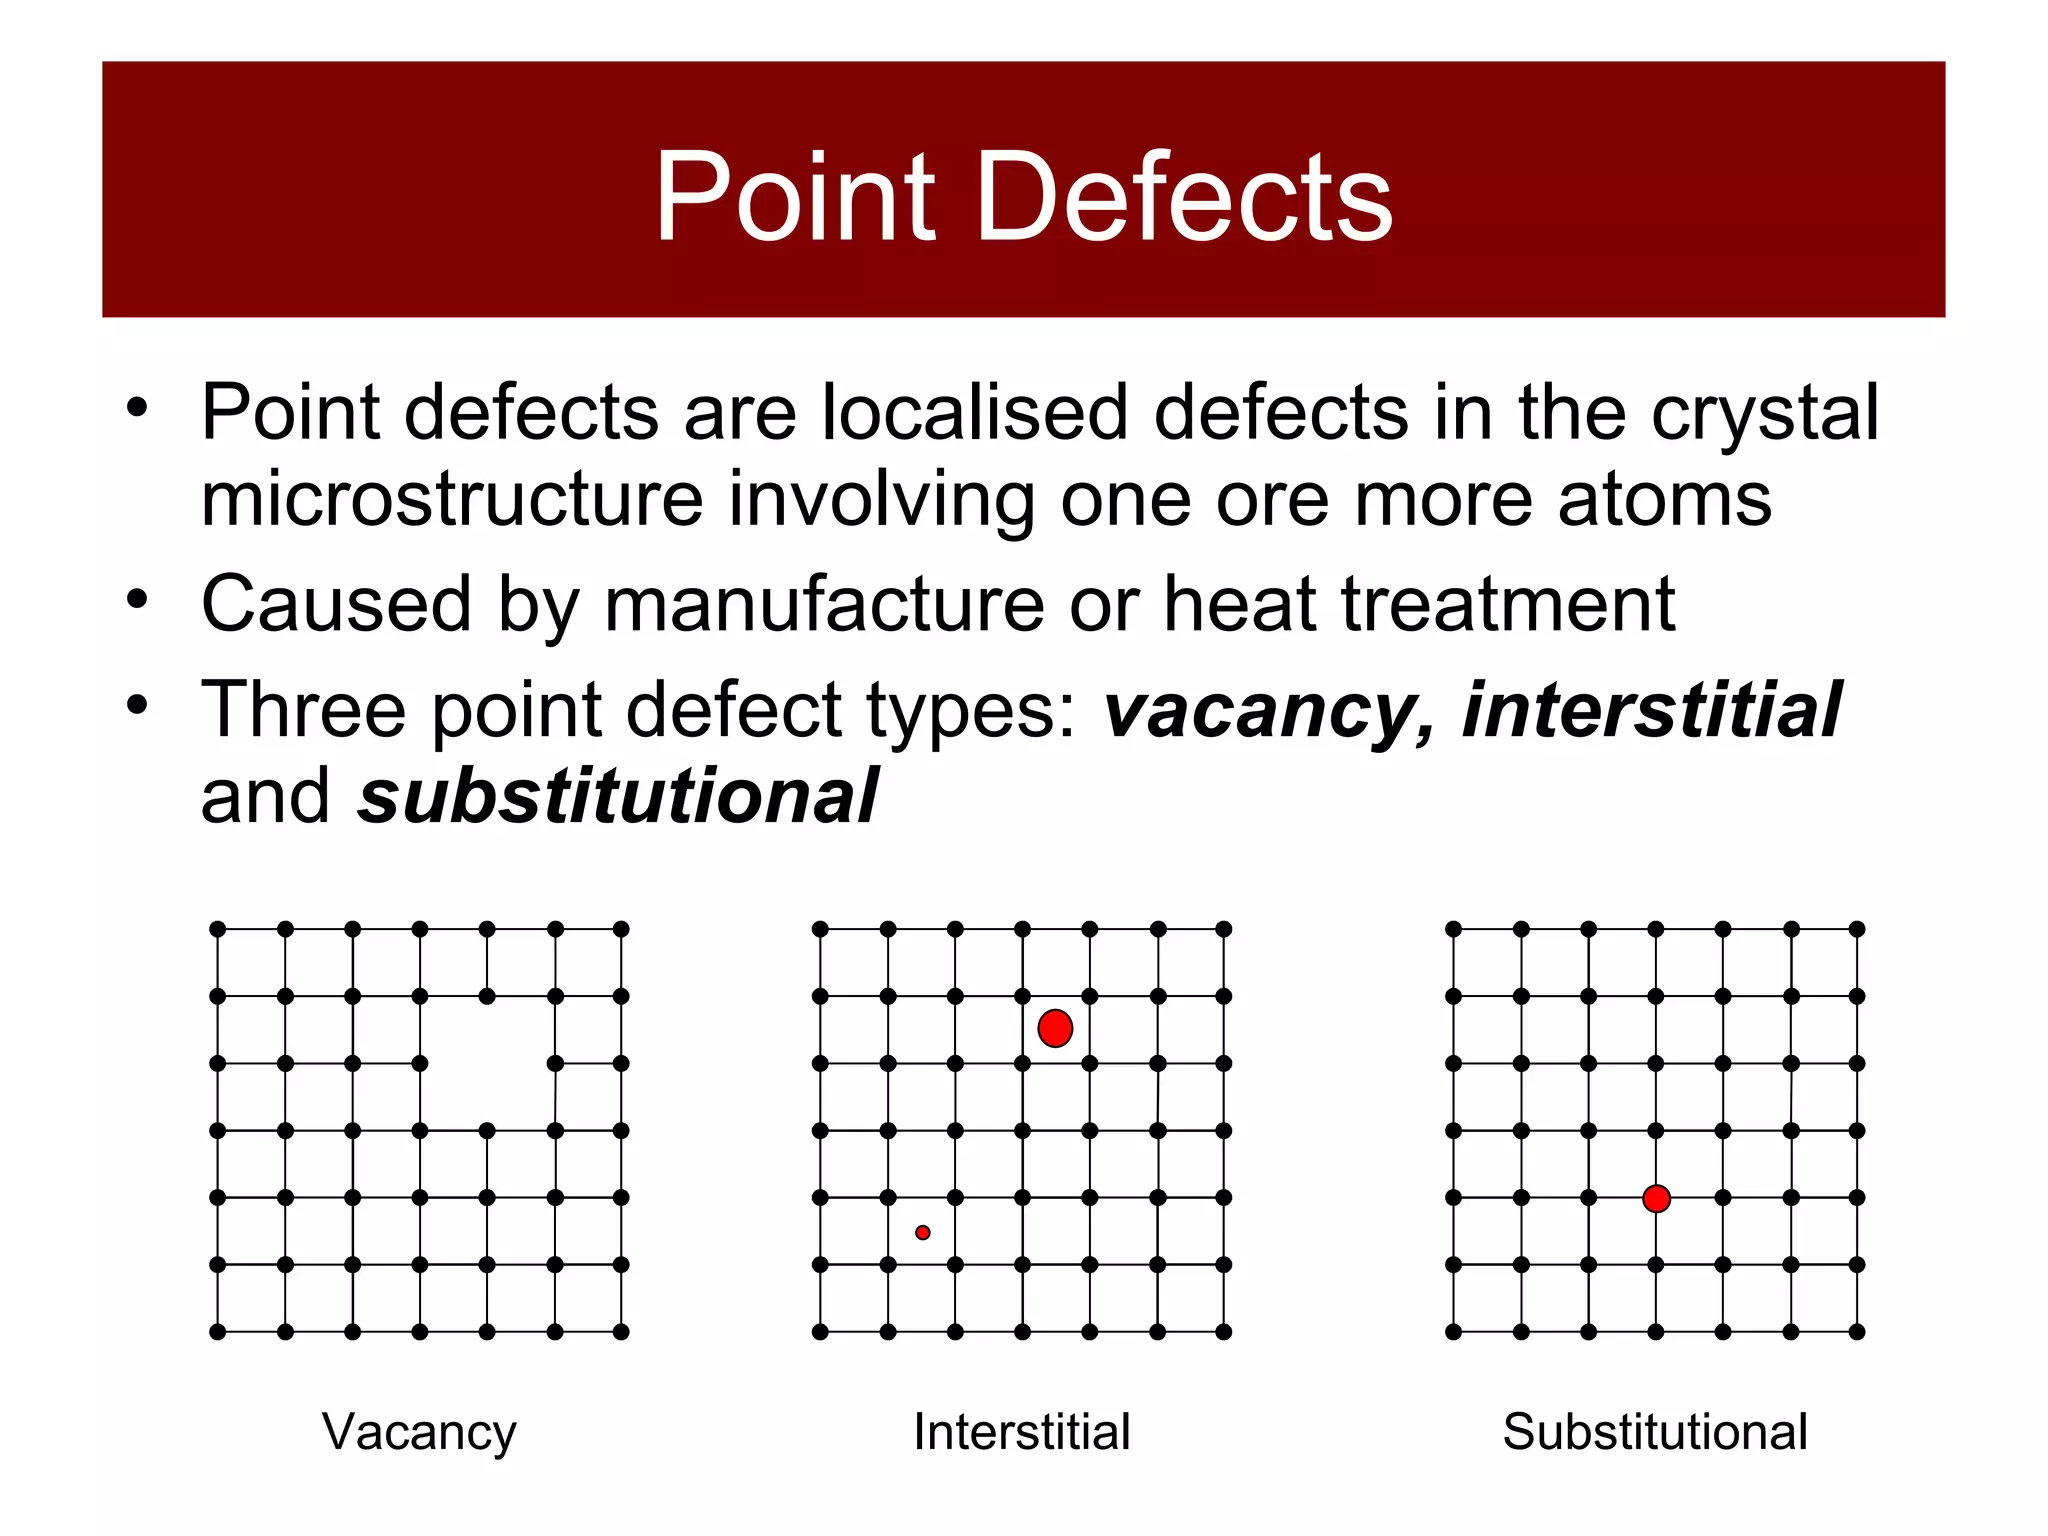
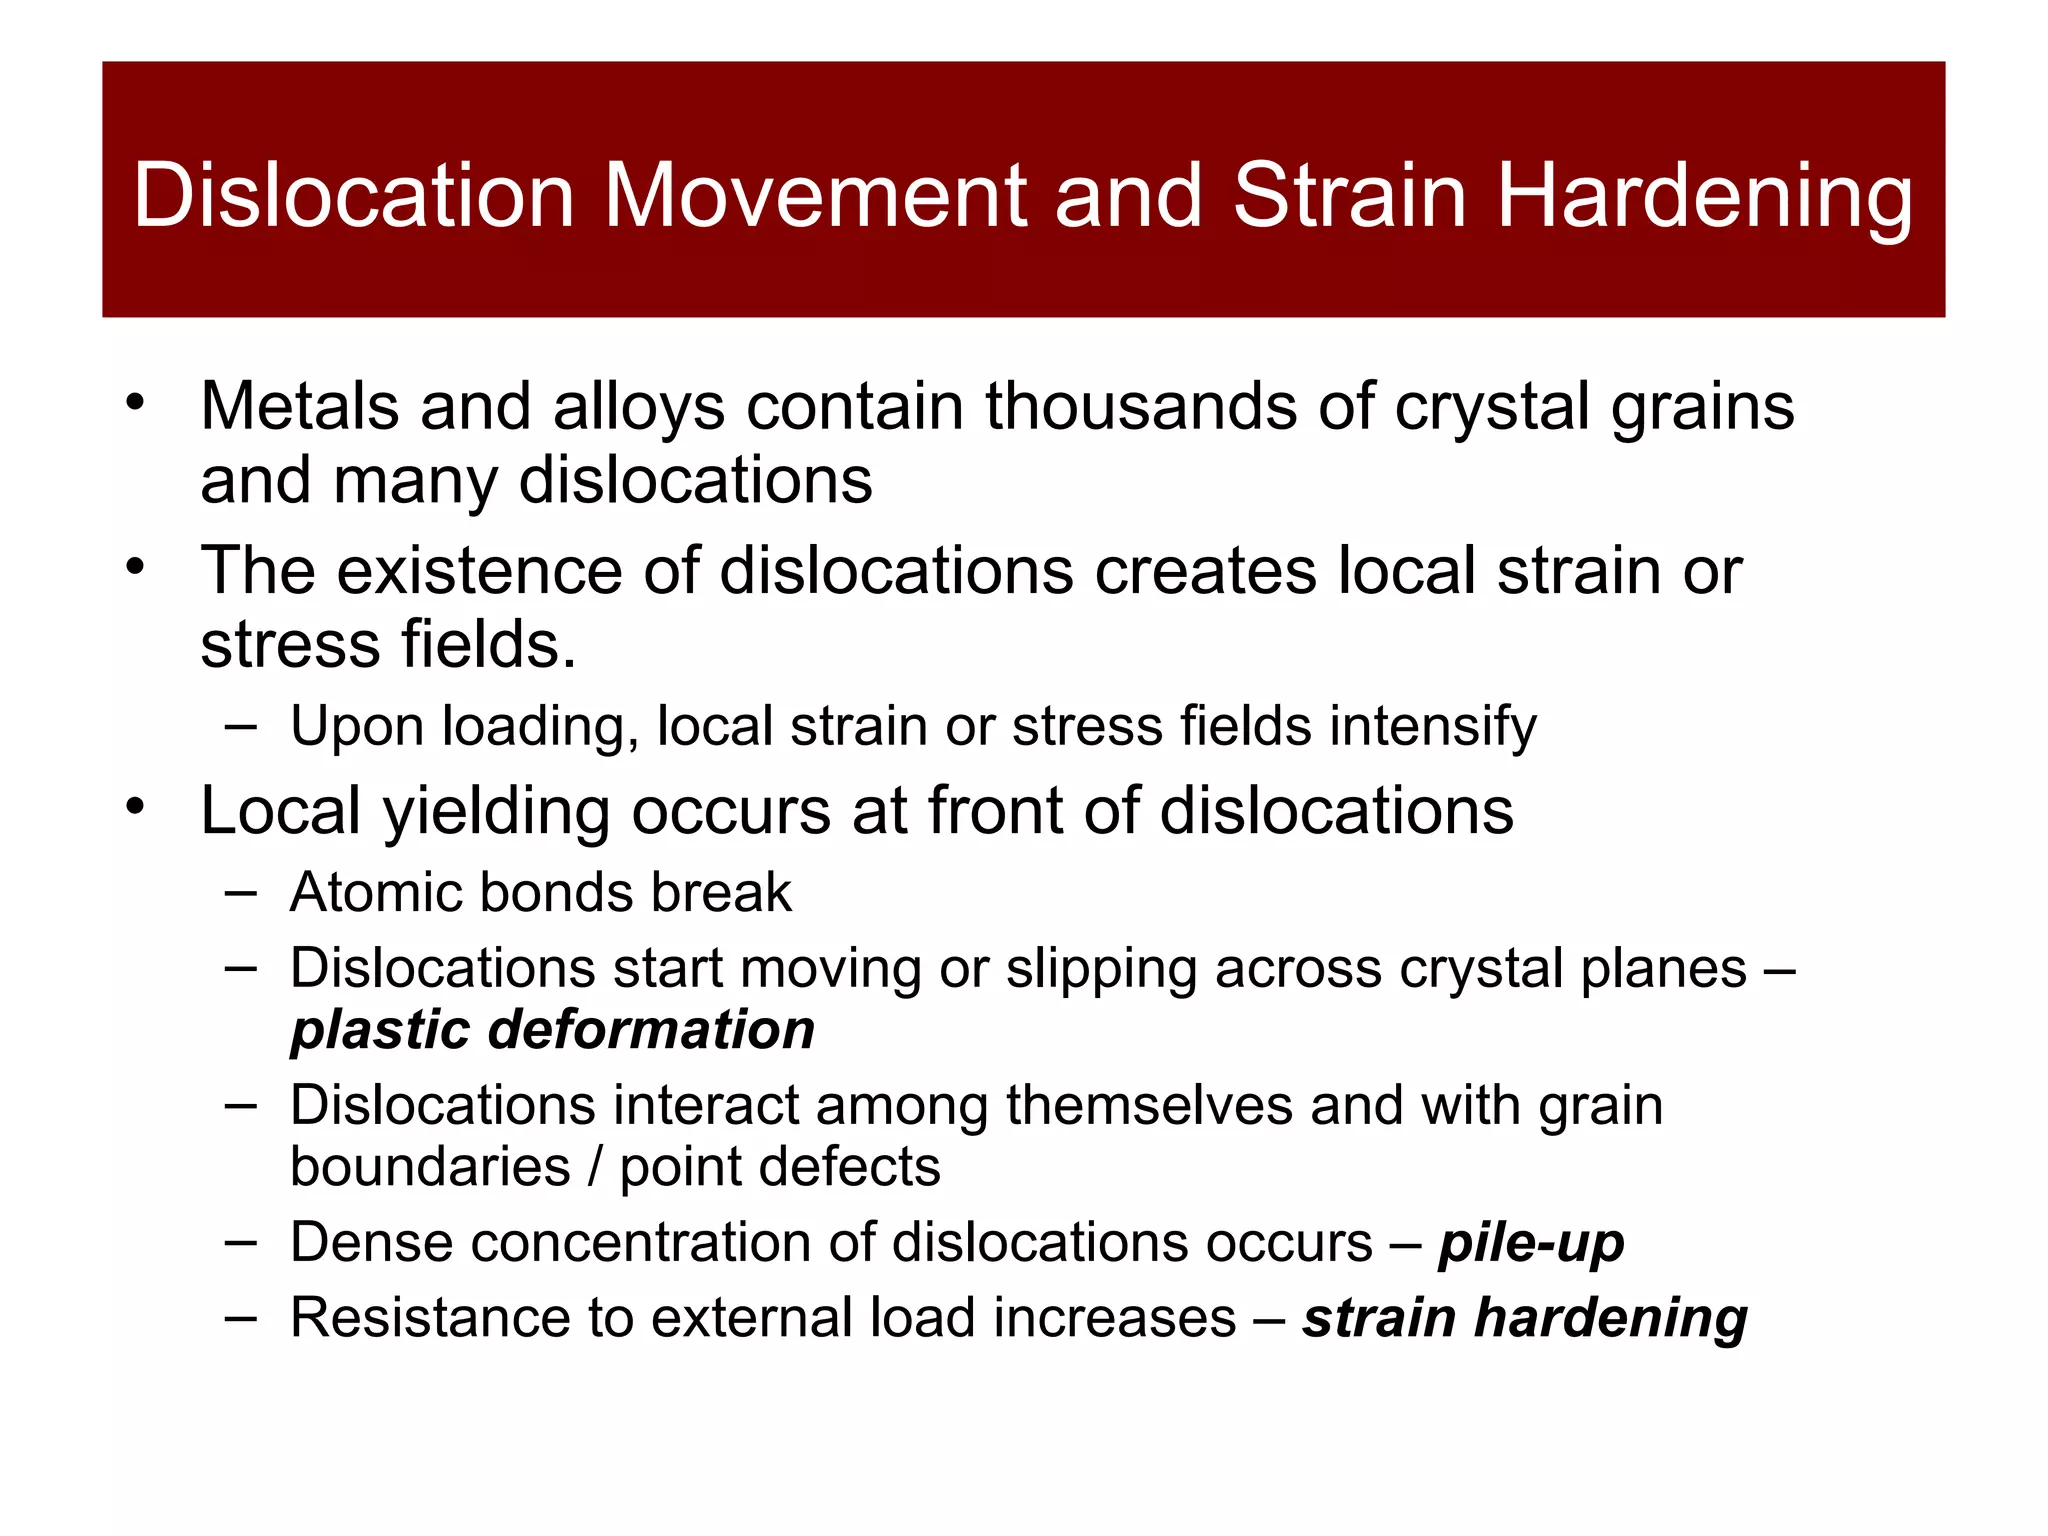
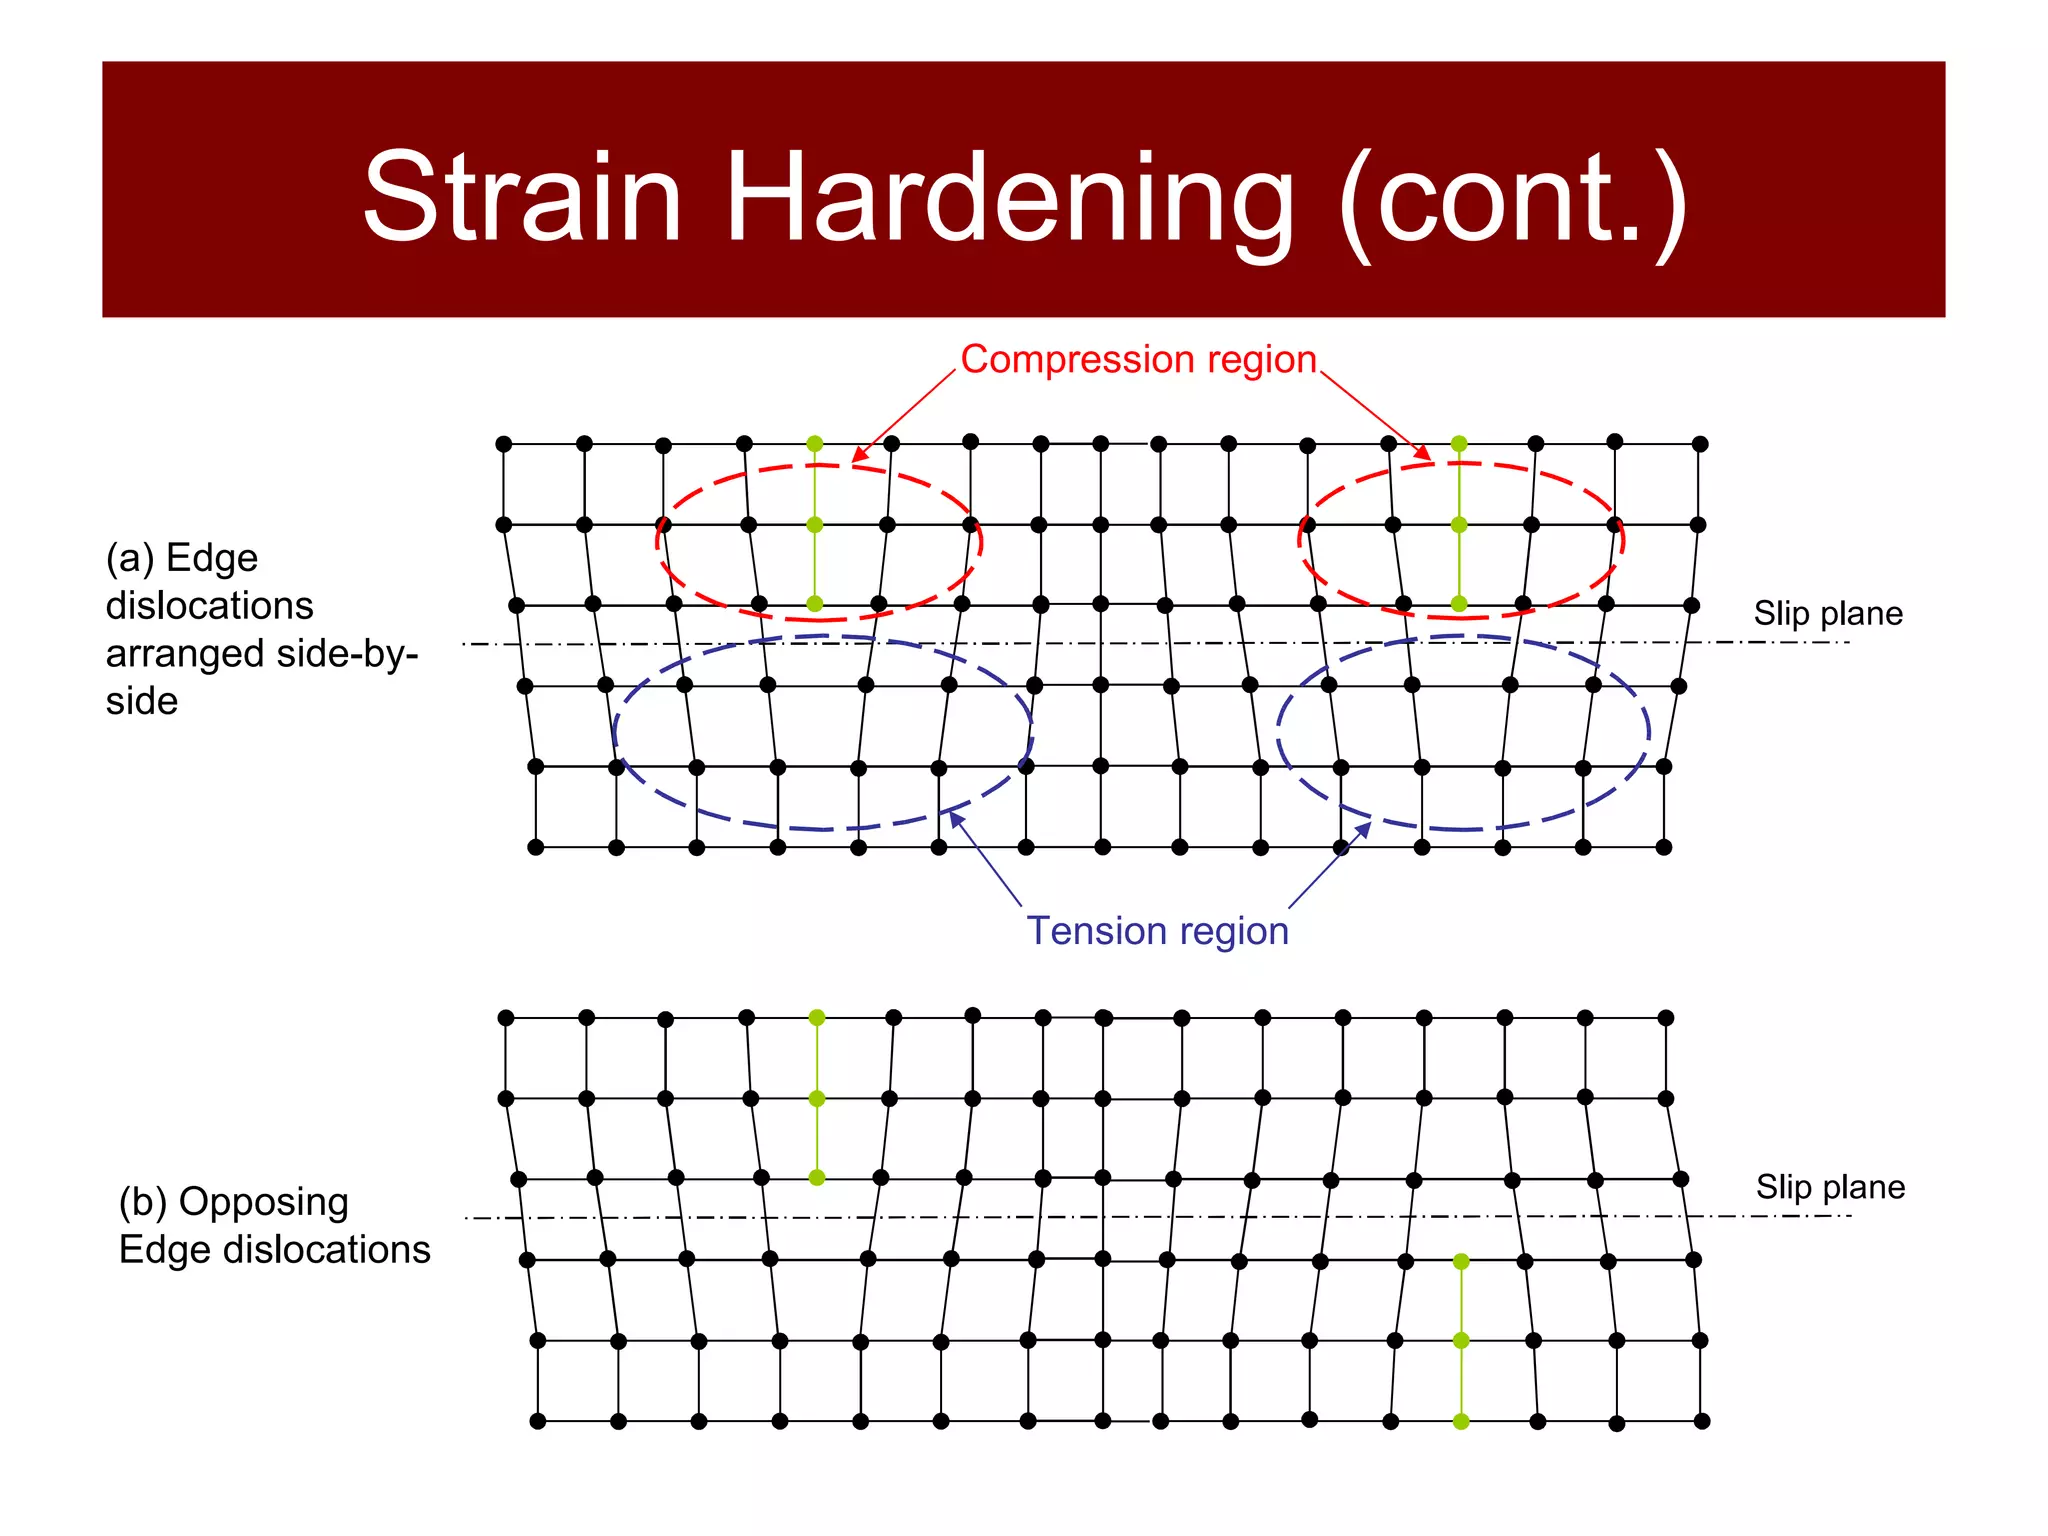
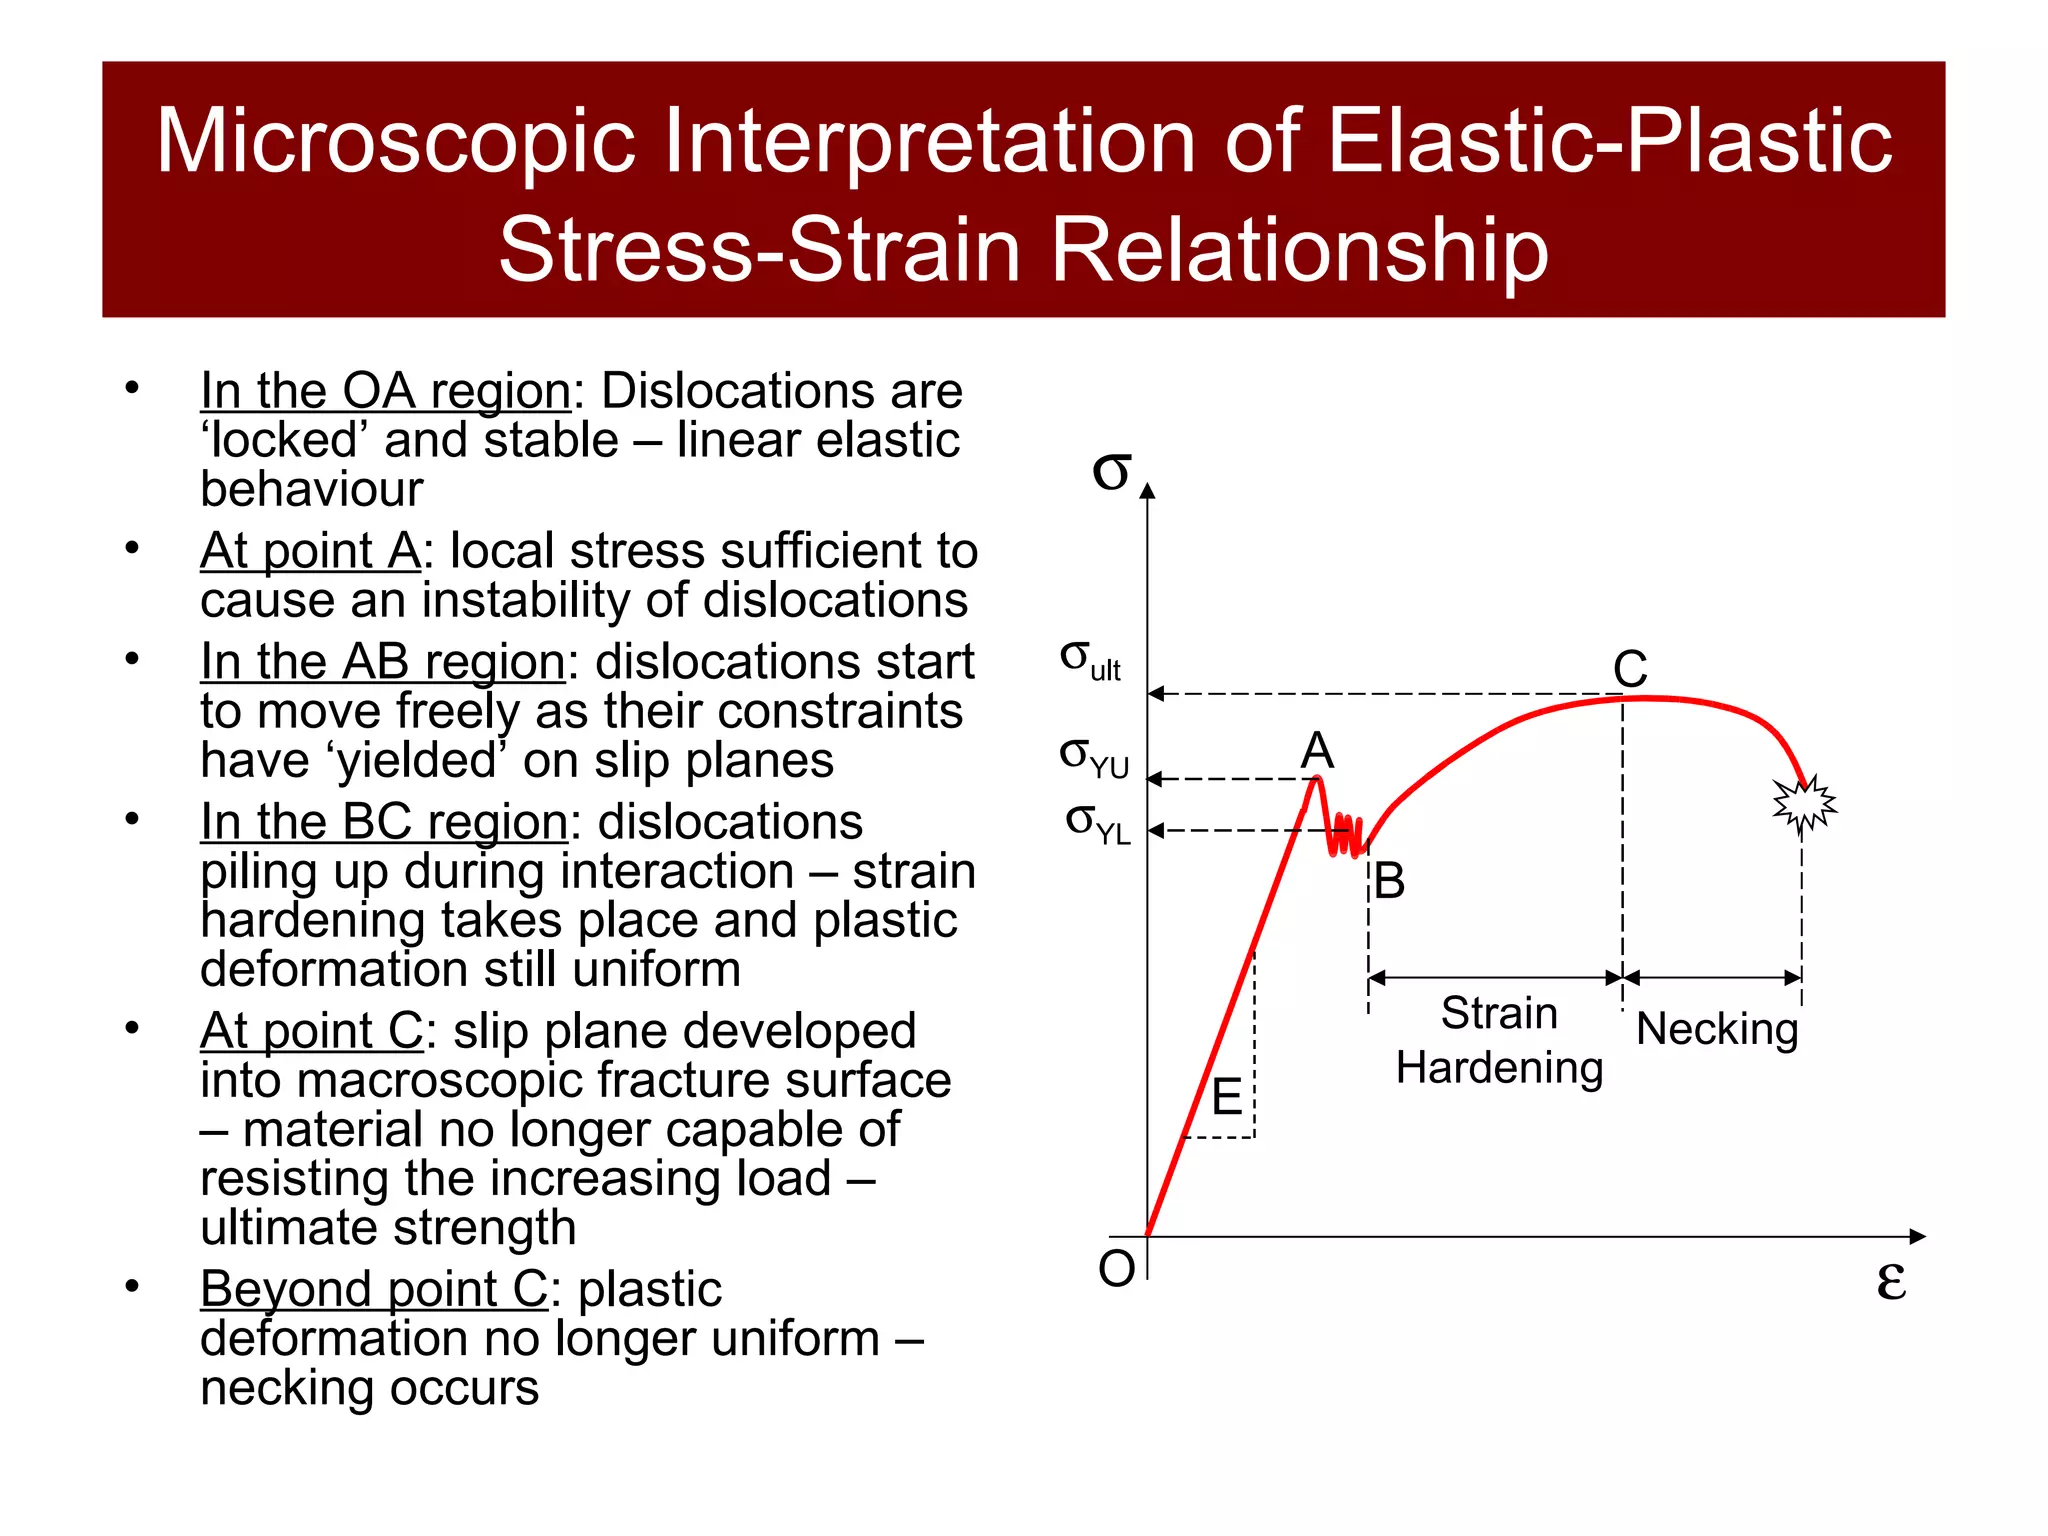
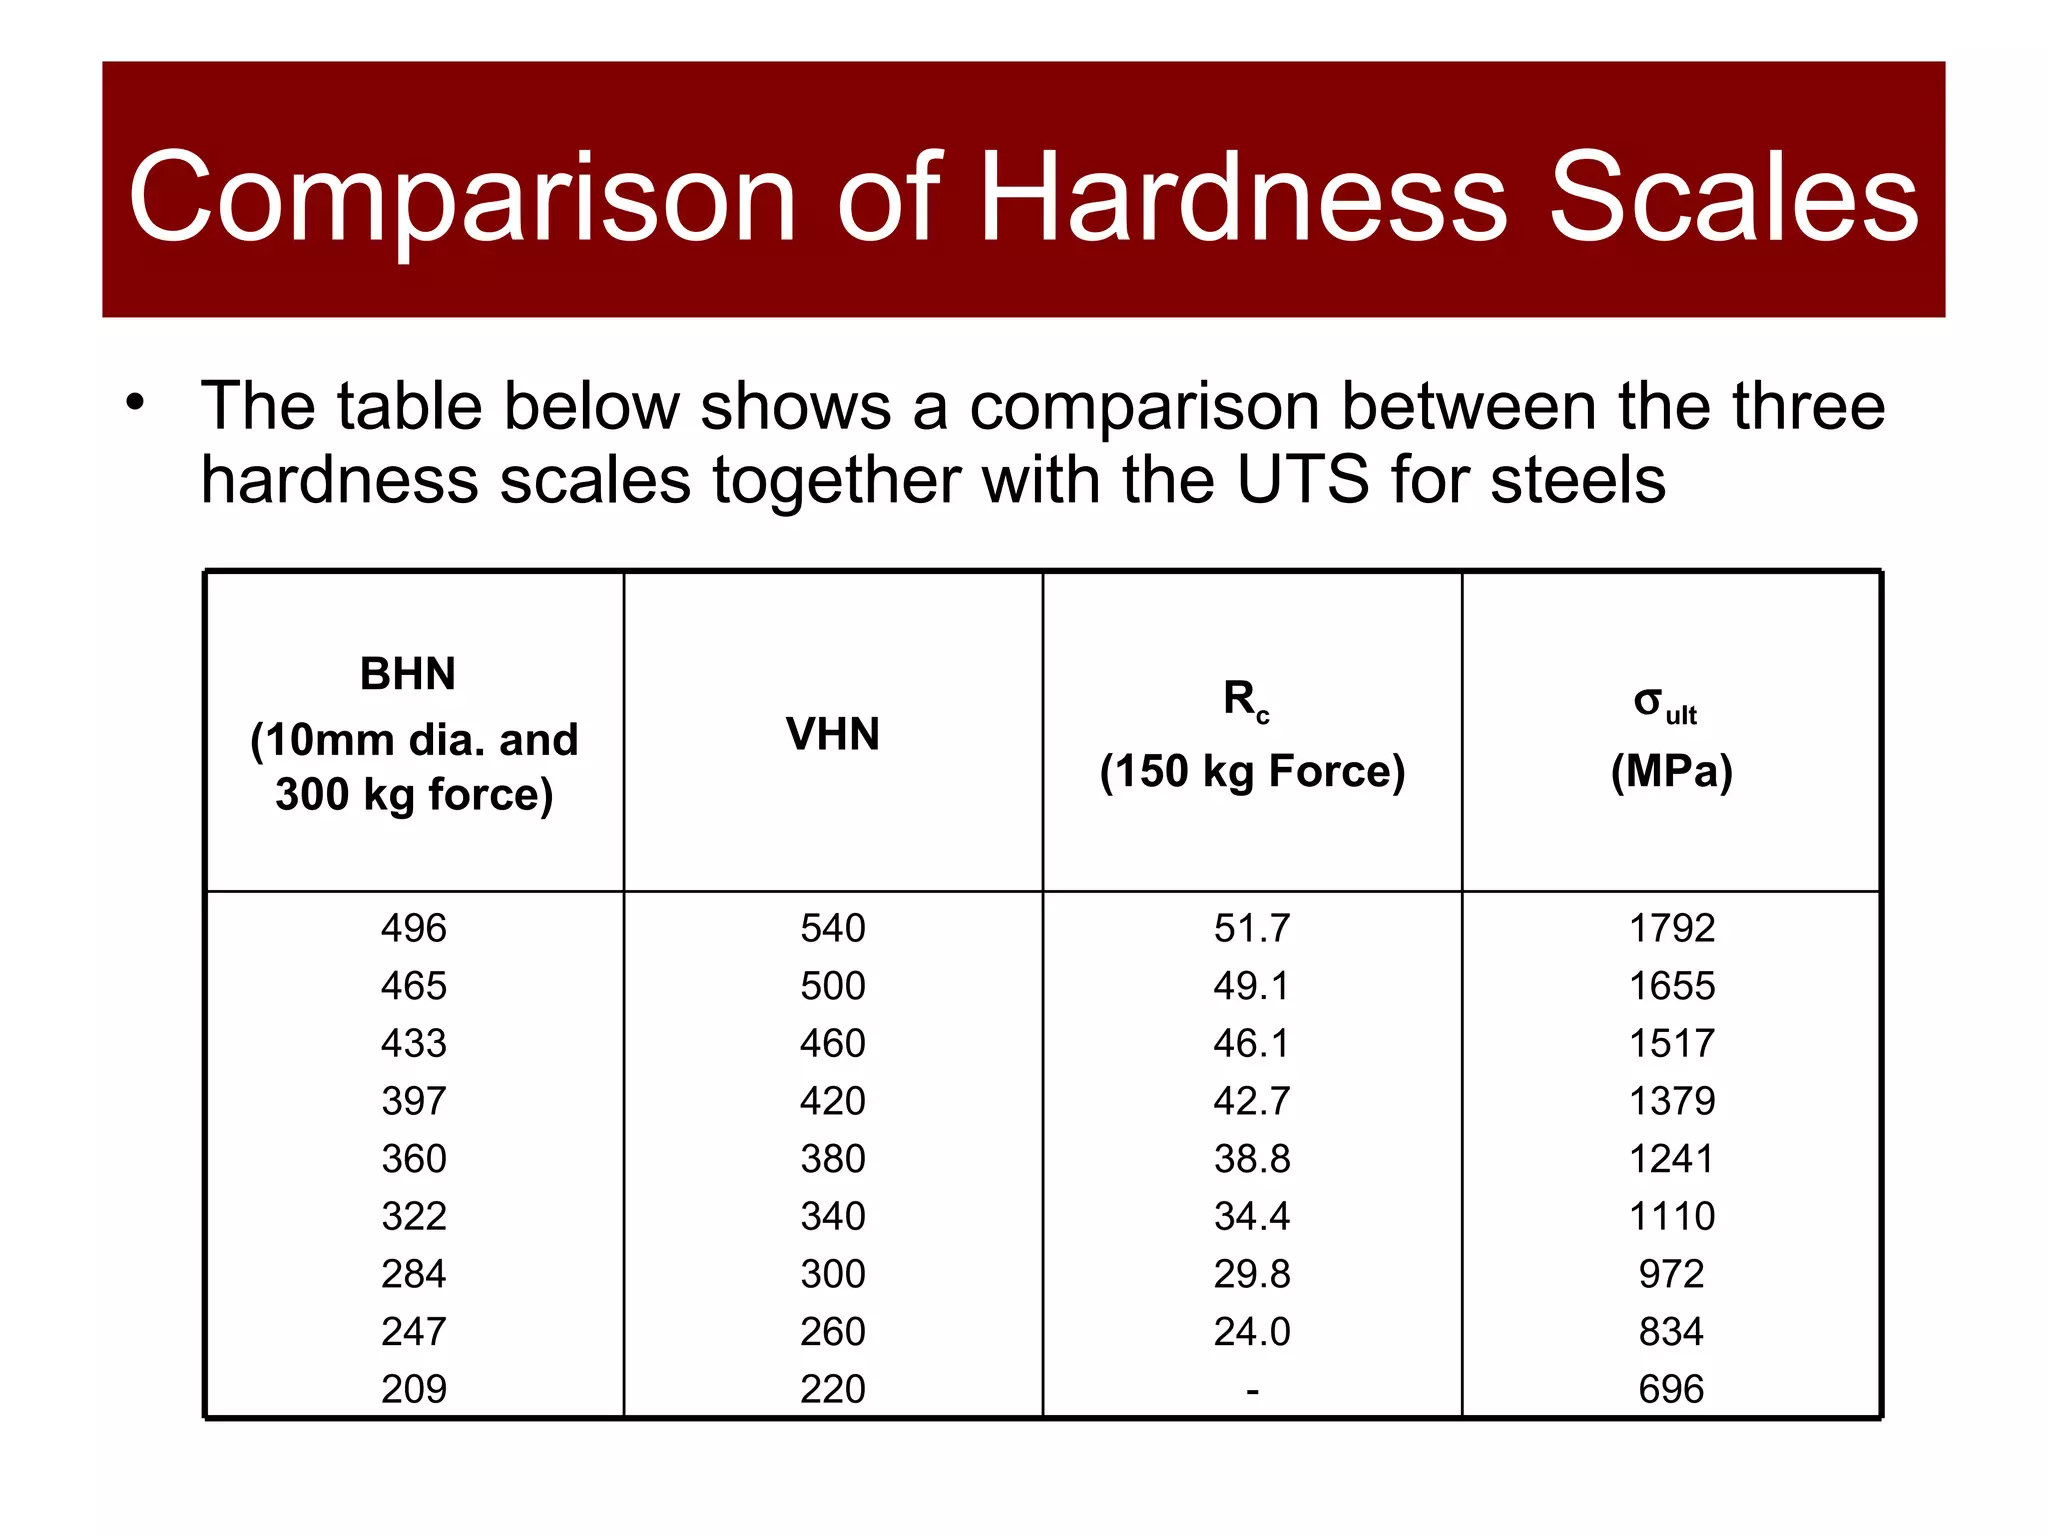
The document discusses the behavior of materials under stress and strain, introducing concepts like elastic and plastic deformation and detailing the micro-structure of materials, particularly polycrystalline materials. It explains stress-strain relationships, including true stress and strain definitions, and various hardness testing methods. Additionally, it covers the implications of dislocations and imperfections in solids on material behavior, ultimately highlighting the importance of mechanical properties in structural design.


