
![Weldability
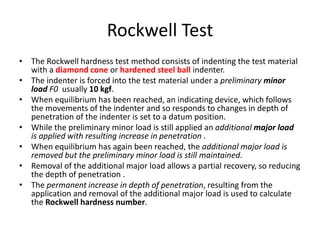
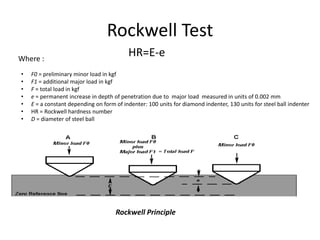
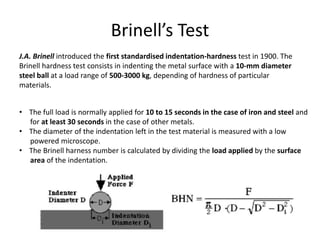
• The weldability, also known as joinability,[1] of a
material refers to its ability to be welded.
• Many metals and thermoplastics can be welded,
but some are easier to weld than others .
• A material's weldability is used to determine the
welding process and to compare the final weld
quality to other materials.](https://image.slidesharecdn.com/mechprops-170329020458/85/Mech-props-25-320.jpg)


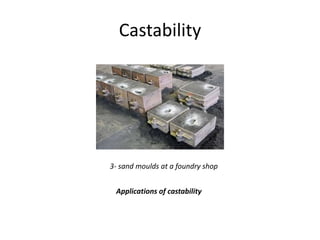
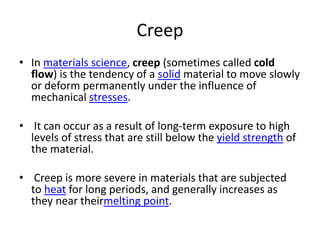
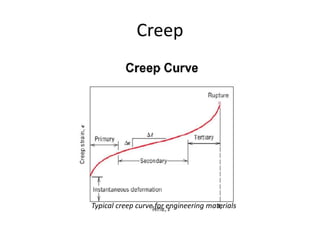
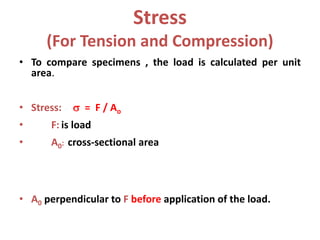
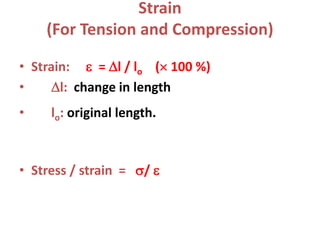
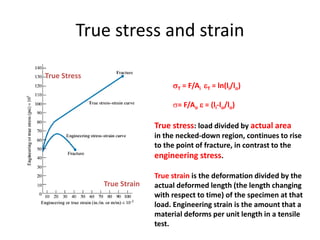
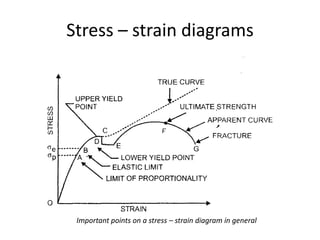
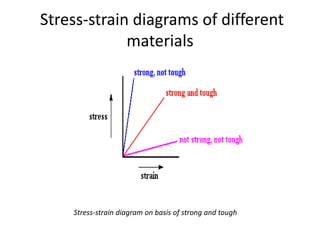
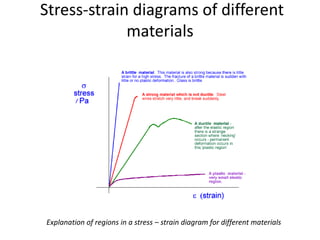
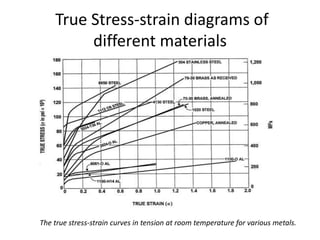
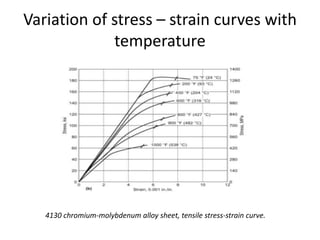
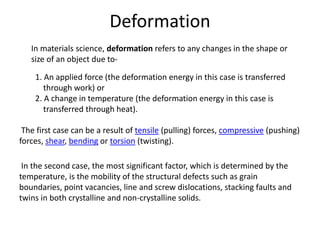
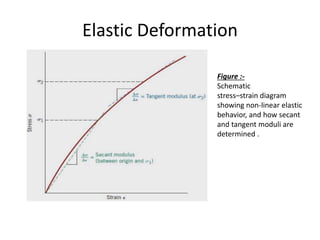
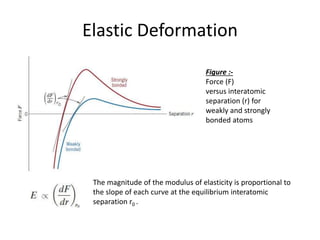
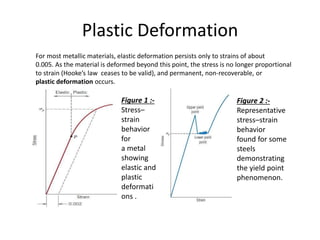
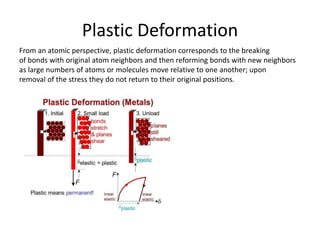
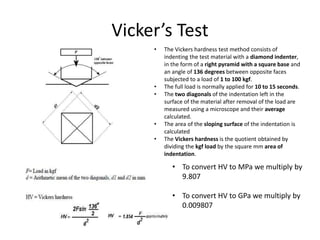
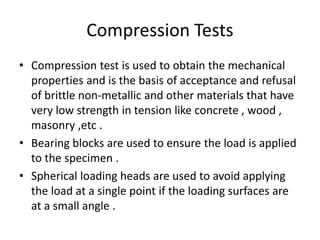
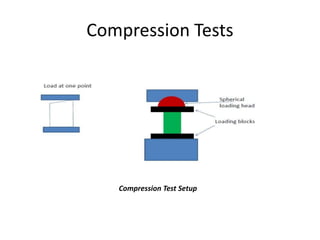
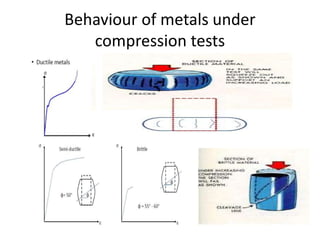
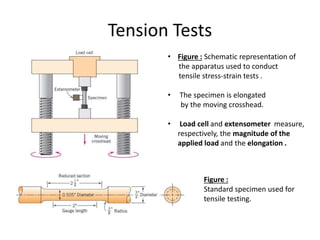
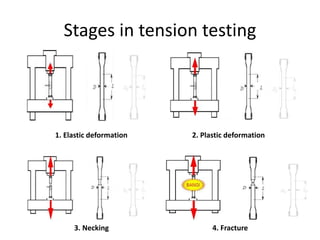
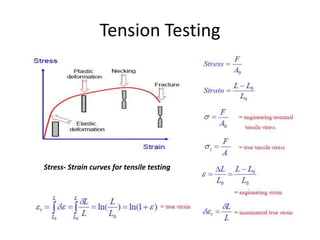


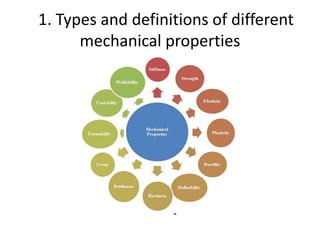
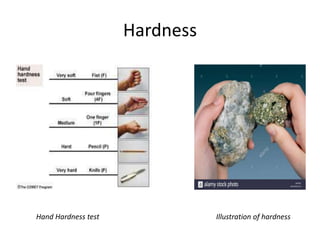
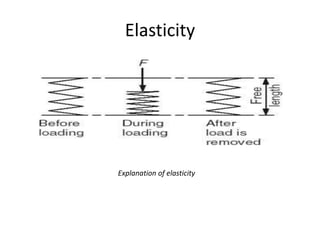
Mechanical properties refer to how materials behave under forces or pressures. This document discusses key mechanical properties including brittleness, hardness, strength, stiffness, ductility, malleability, elasticity, plasticity, creep, and weldability. It describes how these properties are defined, measured, and their significance for material selection and design. Measurement techniques covered include indentation hardness tests like Rockwell and Brinell, and tension tests. The document also examines stress-strain diagrams and how they vary for different materials and temperatures.


![[Deck] What's New in Spark-Iceberg Integration via DSV2.pptx](https://cdn.slidesharecdn.com/ss_thumbnails/deckwhatsnewinspark-icebergintegrationviadsv2-260210005337-25955b12-thumbnail.jpg?width=640&height=640&fit=bounds)


