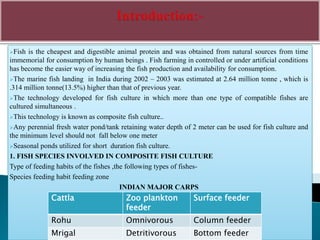
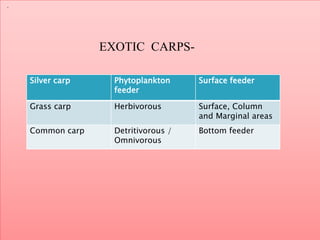
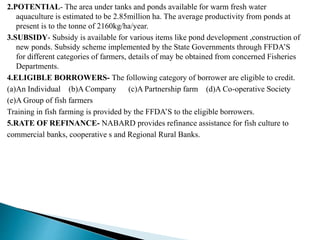
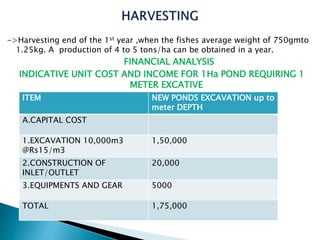
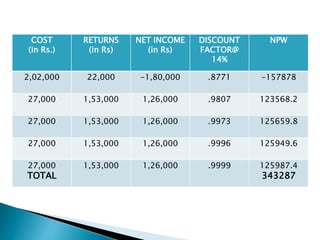
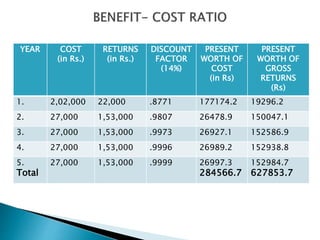
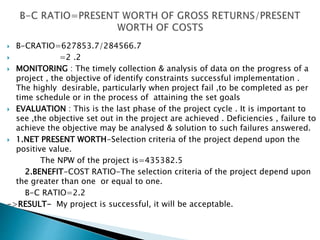
SUBMITTED TO
Dr. AJAY KUMAR GAURAHA
Department of Agricultural Economics
SUBMITTED BY
Manisha Sonwani
M.Sc.(Ag.) Previous year
Deptt.of Agricultural Economics
Fish is the cheapest and digestible animal protein and was obtained from natural sources from time
immemorial for consumption by human beings . Fish farming in controlled or under artificial conditions
has become the easier way of increasing the fish production and availability for consumption.
The marine fish landing in India during 2002 – 2003 was estimated at 2.64 million tonne , which is
.314 million tonne(13.5%) higher than that of previous year.
The technology developed for fish culture in which more than one type of compatible fishes are
cultured simultaneous .
This technology is known as composite fish culture..
Any perennial fresh water pond/tank retaining water depth of 2 meter can be used for fish culture and
the minimum level should not fall below one meter
Seasonal ponds utilized for short duration fish culture.
1. FISH SPECIES INVOLVED IN COMPOSITE FISH CULTURE
Type of feeding habits of the fishes ,the following types of fishes-
Species feeding habit feeding zone
INDIAN MAJOR CARPS
Cattla Zoo plankton
feeder
Surface feeder
Rohu Omnivorous Column feeder
Mrigal Detritivorous Bottom feeder
.
EXOTIC CARPS-
Silver carp Phytoplankton
feeder
Surface feeder
Grass carp Herbivorous Surface, Column
and Marginal areas
Common carp Detritivorous /
Omnivorous
Bottom feeder
S.No State 2005-06 2006-07 2007-08
1 Gujarat 733.82 747.33 721.91
2 Maharashtra 580.55 595.94 556.45
3 Karnataka 297.57 292.46 297.69
4 Kerala 636.89 677.63 667.33
5 TamilNadu 463.03 542.28 559.36
6 Andhrapradesh 891.09 856.93 1010.08
7 Orissa 325.45 342.04 349.48
8 West Bengal 1250 1359 1447
9 Puducherry 21.45 39.66 39.01
10 Goa 104.95 102.39 33.43
11 Daman&Diu 17.79 16.41 26.36
12
Andaman&Nico
bar Islands
12.09 28.68 28.68
13 Lakshadweep 11.96 11.75 11.04
Average 411.28 431.73 442.14
2.POTENTIAL- The area under tanks and ponds available for warm fresh water
aquaculture is estimated to be 2.85million ha. The average productivity from ponds at
present is to the tonne of 2160kg/ha/year.
3.SUBSIDY- Subsidy is available for various items like pond development ,construction of
new ponds. Subsidy scheme implemented by the State Governments through FFDA’S
for different categories of farmers, details of may be obtained from concerned Fisheries
Departments.
4.ELIGIBLE BORROWERS- The following category of borrower are eligible to credit.
(a)An Individual (b)A Company (c)A Partnership farm (d)A Co-operative Society
(e)A Group of fish farmers
Training in fish farming is provided by the FFDA’S to the eligible borrowers.
5.RATE OF REFINANCE- NABARD provides refinance assistance for fish culture to
commercial banks, cooperative s and Regional Rural Banks.
Technical parameter that needs for composite fish culture
1 SELECTION OF POND- Selecting the pond is that the soil should be water
retentive, adequate supply of water is assured and that the pond is not in a
flood prone area.
2.POND MANAGEMENT - measures are required –
(a)Prestocking : In case of new ponds ,prestocking operation start with liming
and filling of the pond with water.
->Removal of weeds by manual/mechanical.
->Removal of unwanted and predatory fishes and other animals by sun drying
the pond bed , mahua oil cake@2500kg/ha meter
->Liming- The tanks are acidic in nature are less productive than alkaline
ponds . The following effects-
(a)Increases the pH .
(b)It increases the resistance of soil to parasites.
(c)Its toxic effect kills the parasites.
The normal doses of the lime ranges from 200 to250kg/ha . Actual dose based
on pH of the soil and water-
5.1-6.5 1000
6.6-7.5 500
7.6-8.5 200
8.6-9.5 nil
SOIL (pH) LIME (kg/ha)
4.5-5.0 2,000
 Fertilization of the pond is intensifying fish culture by increasing
the natural productivity of the pond. A combination of both organic
and inorganic fertilizers may be used for best results.
(a) Organic Organic manure applied after a gap
of 3 days from the date of liming.
(b) Inorganic Inorganic fertilizer to be undertaken
after 15 days of organic manuring .
Requirement of nitrogenous and
phosphate fertilizers vary as per the
nature of soil fertility indicated.
Soil fertility
status
Ammonium
sulphate
Urea
1. Nitrogen
(mg/100 g soil)
a) High (51-75) 70 30
b) Medium (26-50) 90 40
c) Low (up to 25) 140 60
2. Phosphorus
(mg/100 g soil)
Single super
phosphate
Triple super
phosphate
a) High (7-12) 40 15
b) Medium (4-6)
c) Low (up to 3)
50
70
20
30
STOCKING: The pond ready for stocking after 15 days of application of
fertilizer . Fish fingerlings 10 cm size (approx) used for
stocking@5000nos./ha.
Depending on availability of seed and market condition , stocking can be of 3
,4,or 6 species combination in the following ratio.
SPECIES COMBINATION(ratio)
SPECIES 3-SPECIES 4-SPECIES 6-SPECIES
CATLA 4.0 3.0 1.5
ROHU 3.0 3.0 2.0
MRIGAL 3.0 2.0 1.5
SILVER CARP - - 1.5
GRASS CARP - - 1.5
COMMON
CARP
- 2.0 2.0
 (A) Supplementary feeding : Fishes need more food than available naturally
in the pond . Fishes can be fed with a mixture of bran and oilcake in equal
quantities daily . The feed should be placed on a bamboo tray and lowered
to the pond bottom or sprayed at the corners . The recommended feeding
rate is as under:
CULTURE PERIOD QUANTITY PER DAY (kg)
1. QUARTER 1.5-3
2. QUARTER 3 -6
3.QUARTER 6 - 9
4.QUARTER 9 - 12
TOTAL(for the year) 1,655 - 2700
->Harvesting end of the 1st year ,when the fishes average weight of 750gmto
1.25kg. A production of 4 to 5 tons/ha can be obtained in a year.
FINANCIAL ANALYSIS
INDICATIVE UNIT COST AND INCOME FOR 1Ha POND REQUIRING 1
METER EXCATIVE
ITEM NEW PONDS EXCAVATION up to
meter DEPTH
A.CAPITAL COST
1.EXCAVATION 10,000m3
@Rs15/m3
1,50,000
2.CONSTRUCTION OF
INLET/OUTLET
20,000
3.EQUIPMENTS AND GEAR 5000
TOTAL 1,75,000
RECURRING COST
1.LIME 500kg@Rs.5/ kg 2500
2.FINGERLINGS 500Nos.@Rs400/1000 Nos. 2000
3.ORGANIC
MANURE(COWDUNG)15tonne@Rs.300/tonn
4500
4.UREA 330kg@Rs.5/kg 1650
5.TRIPLE SUPER PHOSPHATE 165kg@ Rs.5%kg 825
6.MUSTARD OIL CAKE 1350kg@ Rs.6/kg 8100
7.RICE BRAN:1350 kg@Rs.3/kg
8.INSURANCE COST@4% OF SEED &FERTILIZER
9.MISCELLANEOUS INCLUDE HARVESTING,
MARKETING EXPENSES & WATCH & WARD etc
TOTAL.
4050
960
2415
27000
INCOME
1.PRODUCTION(from end 1st year ) 3000kg
2.SALE PRICE(Perkg) Rs.60/-
TOTAL INCOME Rs.180,000/-
A.COST YEAR1 YEAR2 YEAR3 YEAR4 YEAR5
1.FIXED
COST
175000
2.RECURRI
NG COST
27000 27000 27000 27000 27000
TOTAL
COST
202000 27000 27000 27000 27000
B. BENEFIT
COST
1.INCOME
FROM SALE
OF FISH
2.GROSS
INCOME
180000
-22000
180000
153000
180000
153000
180000
153000
180000
153000
COST
(in Rs.)
RETURNS
(in Rs)
NET INCOME
(in Rs)
DISCOUNT
FACTOR@
14%
NPW
2,02,000 22,000 -1,80,000 .8771 -157878
27,000 1,53,000 1,26,000 .9807 123568.2
27,000 1,53,000 1,26,000 .9973 125659.8
27,000 1,53,000 1,26,000 .9996 125949.6
27,000
TOTAL
1,53,000 1,26,000 .9999 125987.4
343287
YEAR COST
(in Rs.)
RETURNS
(in Rs.)
DISCOUNT
FACTOR
(14%)
PRESENT
WORTH OF
COST
(in Rs)
PRESENT
WORTH OF
GROSS
RETURNS
(Rs)
1. 2,02,000 22,000 .8771 177174.2 19296.2
2. 27,000 1,53,000 .9807 26478.9 150047.1
3. 27,000 1,53,000 .9973 26927.1 152586.9
4. 27,000 1,53,000 .9996 26989.2 152938.8
5.
Total
27,000 1,53,000 .9999 26997.3
284566.7
152984.7
627853.7
 B-CRATIO=627853.7/284566.7
 =2 .2
 MONITORING : The timely collection & analysis of data on the progress of a
project , the objective of identify constraints successful implementation .
The highly desirable, particularly when project fail ,to be completed as per
time schedule or in the process of attaining the set goals
 EVALUATION : This is the last phase of the project cycle . It is important to
see ,the objective set out in the project are achieved . Deficiencies , failure to
achieve the objective may be analysed & solution to such failures answered.
 1.NET PRESENT WORTH-Selection criteria of the project depend upon the
positive value.
The NPW of the project is=435382.5
2.BENEFIT-COST RATIO-The selection criteria of the project depend upon
the greater than one or equal to one.
B-C RATIO=2.2
->RESULT- My project is successful, it will be acceptable.
case study of agricultural project

case study of agricultural project

  • 1.
    SUBMITTED TO Dr. AJAYKUMAR GAURAHA Department of Agricultural Economics SUBMITTED BY Manisha Sonwani M.Sc.(Ag.) Previous year Deptt.of Agricultural Economics
  • 2.
    Fish is thecheapest and digestible animal protein and was obtained from natural sources from time immemorial for consumption by human beings . Fish farming in controlled or under artificial conditions has become the easier way of increasing the fish production and availability for consumption. The marine fish landing in India during 2002 – 2003 was estimated at 2.64 million tonne , which is .314 million tonne(13.5%) higher than that of previous year. The technology developed for fish culture in which more than one type of compatible fishes are cultured simultaneous . This technology is known as composite fish culture.. Any perennial fresh water pond/tank retaining water depth of 2 meter can be used for fish culture and the minimum level should not fall below one meter Seasonal ponds utilized for short duration fish culture. 1. FISH SPECIES INVOLVED IN COMPOSITE FISH CULTURE Type of feeding habits of the fishes ,the following types of fishes- Species feeding habit feeding zone INDIAN MAJOR CARPS Cattla Zoo plankton feeder Surface feeder Rohu Omnivorous Column feeder Mrigal Detritivorous Bottom feeder
  • 3.
    . EXOTIC CARPS- Silver carpPhytoplankton feeder Surface feeder Grass carp Herbivorous Surface, Column and Marginal areas Common carp Detritivorous / Omnivorous Bottom feeder
  • 4.
    S.No State 2005-062006-07 2007-08 1 Gujarat 733.82 747.33 721.91 2 Maharashtra 580.55 595.94 556.45 3 Karnataka 297.57 292.46 297.69 4 Kerala 636.89 677.63 667.33 5 TamilNadu 463.03 542.28 559.36 6 Andhrapradesh 891.09 856.93 1010.08 7 Orissa 325.45 342.04 349.48 8 West Bengal 1250 1359 1447 9 Puducherry 21.45 39.66 39.01 10 Goa 104.95 102.39 33.43 11 Daman&Diu 17.79 16.41 26.36 12 Andaman&Nico bar Islands 12.09 28.68 28.68 13 Lakshadweep 11.96 11.75 11.04 Average 411.28 431.73 442.14
  • 5.
    2.POTENTIAL- The areaunder tanks and ponds available for warm fresh water aquaculture is estimated to be 2.85million ha. The average productivity from ponds at present is to the tonne of 2160kg/ha/year. 3.SUBSIDY- Subsidy is available for various items like pond development ,construction of new ponds. Subsidy scheme implemented by the State Governments through FFDA’S for different categories of farmers, details of may be obtained from concerned Fisheries Departments. 4.ELIGIBLE BORROWERS- The following category of borrower are eligible to credit. (a)An Individual (b)A Company (c)A Partnership farm (d)A Co-operative Society (e)A Group of fish farmers Training in fish farming is provided by the FFDA’S to the eligible borrowers. 5.RATE OF REFINANCE- NABARD provides refinance assistance for fish culture to commercial banks, cooperative s and Regional Rural Banks.
  • 6.
    Technical parameter thatneeds for composite fish culture 1 SELECTION OF POND- Selecting the pond is that the soil should be water retentive, adequate supply of water is assured and that the pond is not in a flood prone area. 2.POND MANAGEMENT - measures are required – (a)Prestocking : In case of new ponds ,prestocking operation start with liming and filling of the pond with water. ->Removal of weeds by manual/mechanical. ->Removal of unwanted and predatory fishes and other animals by sun drying the pond bed , mahua oil cake@2500kg/ha meter ->Liming- The tanks are acidic in nature are less productive than alkaline ponds . The following effects- (a)Increases the pH . (b)It increases the resistance of soil to parasites. (c)Its toxic effect kills the parasites. The normal doses of the lime ranges from 200 to250kg/ha . Actual dose based on pH of the soil and water-
  • 7.
    5.1-6.5 1000 6.6-7.5 500 7.6-8.5200 8.6-9.5 nil SOIL (pH) LIME (kg/ha) 4.5-5.0 2,000
  • 8.
     Fertilization ofthe pond is intensifying fish culture by increasing the natural productivity of the pond. A combination of both organic and inorganic fertilizers may be used for best results. (a) Organic Organic manure applied after a gap of 3 days from the date of liming. (b) Inorganic Inorganic fertilizer to be undertaken after 15 days of organic manuring . Requirement of nitrogenous and phosphate fertilizers vary as per the nature of soil fertility indicated.
  • 9.
    Soil fertility status Ammonium sulphate Urea 1. Nitrogen (mg/100g soil) a) High (51-75) 70 30 b) Medium (26-50) 90 40 c) Low (up to 25) 140 60 2. Phosphorus (mg/100 g soil) Single super phosphate Triple super phosphate a) High (7-12) 40 15 b) Medium (4-6) c) Low (up to 3) 50 70 20 30
  • 10.
    STOCKING: The pondready for stocking after 15 days of application of fertilizer . Fish fingerlings 10 cm size (approx) used for stocking@5000nos./ha. Depending on availability of seed and market condition , stocking can be of 3 ,4,or 6 species combination in the following ratio. SPECIES COMBINATION(ratio) SPECIES 3-SPECIES 4-SPECIES 6-SPECIES CATLA 4.0 3.0 1.5 ROHU 3.0 3.0 2.0 MRIGAL 3.0 2.0 1.5 SILVER CARP - - 1.5 GRASS CARP - - 1.5 COMMON CARP - 2.0 2.0
  • 11.
     (A) Supplementaryfeeding : Fishes need more food than available naturally in the pond . Fishes can be fed with a mixture of bran and oilcake in equal quantities daily . The feed should be placed on a bamboo tray and lowered to the pond bottom or sprayed at the corners . The recommended feeding rate is as under: CULTURE PERIOD QUANTITY PER DAY (kg) 1. QUARTER 1.5-3 2. QUARTER 3 -6 3.QUARTER 6 - 9 4.QUARTER 9 - 12 TOTAL(for the year) 1,655 - 2700
  • 12.
    ->Harvesting end ofthe 1st year ,when the fishes average weight of 750gmto 1.25kg. A production of 4 to 5 tons/ha can be obtained in a year. FINANCIAL ANALYSIS INDICATIVE UNIT COST AND INCOME FOR 1Ha POND REQUIRING 1 METER EXCATIVE ITEM NEW PONDS EXCAVATION up to meter DEPTH A.CAPITAL COST 1.EXCAVATION 10,000m3 @Rs15/m3 1,50,000 2.CONSTRUCTION OF INLET/OUTLET 20,000 3.EQUIPMENTS AND GEAR 5000 TOTAL 1,75,000
  • 13.
    RECURRING COST 1.LIME 500kg@Rs.5/kg 2500 2.FINGERLINGS 500Nos.@Rs400/1000 Nos. 2000 3.ORGANIC MANURE(COWDUNG)15tonne@Rs.300/tonn 4500 4.UREA 330kg@Rs.5/kg 1650 5.TRIPLE SUPER PHOSPHATE 165kg@ Rs.5%kg 825 6.MUSTARD OIL CAKE 1350kg@ Rs.6/kg 8100 7.RICE BRAN:1350 kg@Rs.3/kg 8.INSURANCE COST@4% OF SEED &FERTILIZER 9.MISCELLANEOUS INCLUDE HARVESTING, MARKETING EXPENSES & WATCH & WARD etc TOTAL. 4050 960 2415 27000
  • 14.
    INCOME 1.PRODUCTION(from end 1styear ) 3000kg 2.SALE PRICE(Perkg) Rs.60/- TOTAL INCOME Rs.180,000/-
  • 15.
    A.COST YEAR1 YEAR2YEAR3 YEAR4 YEAR5 1.FIXED COST 175000 2.RECURRI NG COST 27000 27000 27000 27000 27000 TOTAL COST 202000 27000 27000 27000 27000 B. BENEFIT COST 1.INCOME FROM SALE OF FISH 2.GROSS INCOME 180000 -22000 180000 153000 180000 153000 180000 153000 180000 153000
  • 16.
    COST (in Rs.) RETURNS (in Rs) NETINCOME (in Rs) DISCOUNT FACTOR@ 14% NPW 2,02,000 22,000 -1,80,000 .8771 -157878 27,000 1,53,000 1,26,000 .9807 123568.2 27,000 1,53,000 1,26,000 .9973 125659.8 27,000 1,53,000 1,26,000 .9996 125949.6 27,000 TOTAL 1,53,000 1,26,000 .9999 125987.4 343287
  • 17.
    YEAR COST (in Rs.) RETURNS (inRs.) DISCOUNT FACTOR (14%) PRESENT WORTH OF COST (in Rs) PRESENT WORTH OF GROSS RETURNS (Rs) 1. 2,02,000 22,000 .8771 177174.2 19296.2 2. 27,000 1,53,000 .9807 26478.9 150047.1 3. 27,000 1,53,000 .9973 26927.1 152586.9 4. 27,000 1,53,000 .9996 26989.2 152938.8 5. Total 27,000 1,53,000 .9999 26997.3 284566.7 152984.7 627853.7
  • 18.
     B-CRATIO=627853.7/284566.7  =2.2  MONITORING : The timely collection & analysis of data on the progress of a project , the objective of identify constraints successful implementation . The highly desirable, particularly when project fail ,to be completed as per time schedule or in the process of attaining the set goals  EVALUATION : This is the last phase of the project cycle . It is important to see ,the objective set out in the project are achieved . Deficiencies , failure to achieve the objective may be analysed & solution to such failures answered.  1.NET PRESENT WORTH-Selection criteria of the project depend upon the positive value. The NPW of the project is=435382.5 2.BENEFIT-COST RATIO-The selection criteria of the project depend upon the greater than one or equal to one. B-C RATIO=2.2 ->RESULT- My project is successful, it will be acceptable.