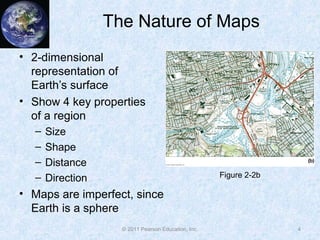
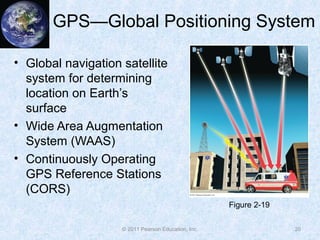
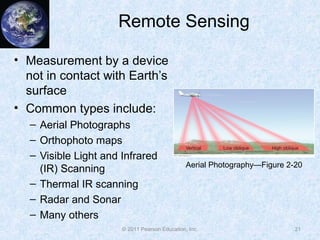
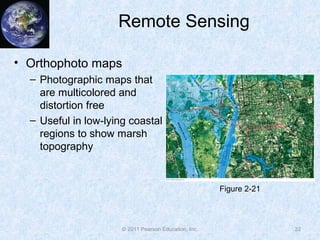
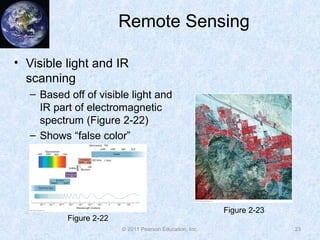
Chapter 2: Portraying Earth
McKnight’s Physical Geography:
A Landscape Appreciation,
Tenth Edition, Hess
Portraying Earth
• The Nature of Maps
• Map Scale
• Map Essentials
• The Role of Globes
• Map Projections
• Families of Map Projections
• Isolines
2© 2011 Pearson Education, Inc.
Portraying Earth
• GPS—Global Positioning System
• Remote Sensing
• GIS—Geographic Information Systems
• Tools of the Geographer
3© 2011 Pearson Education, Inc.
The Nature of Maps
• 2-dimensional
representation of
Earth’s surface
• Show 4 key properties
of a region
– Size
– Shape
– Distance
– Direction
• Maps are imperfect, since
Earth is a sphere
4© 2011 Pearson Education, Inc.
Figure 2-2b
Map Scale
• Maps are always smaller than
the area they represent
• Map scales are necessary to
understand realistic distances
on map
• Scale is relationship between
area on map and area on
Earth
• Three primary types
– Graphic
– Fractional
– Verbal
5© 2011 Pearson Education, Inc.
Figure 2-3
Map Scale
• Large versus small map scales
6© 2011 Pearson Education, Inc.
Figure 2-4
Map Essentials
• Need several properties
of maps to help with
interpretation:
– Title
– Date
– Legend
– Scale
– Direction
– Location
– Data Source
– Map Projection
7© 2011 Pearson Education, Inc.
Figure 2-5
The Role of Globes
• Advantages of Globes
– Maintains correct geographic
relationships between points
– Can accurately represent spatial
relationships between points on
Earth
• Disadvantages of Globes
– Only can see a hemisphere at a
time
– Large and bulky
– Cannot contain much detail
8© 2011 Pearson Education, Inc.
Figure 2-6
Map Projections
• Challenge of the cartographer (“mapmaker”)
– Combine geographic exactness of globe with convenience of
flat map
• Definition of map projection
• Principle behind map projections
• Two primary types
– Equivalent—ratio of areal size on map and Earth is the same
– Conformal—shape of locations on the map is the same as on
Earth
9© 2011 Pearson Education, Inc.
Map Projections
• Equivalence versus conformality dilemma
10© 2011 Pearson Education, Inc.
Figure 2-10
Families of Map Projections
• Cylindrical Projections
– “Wrap” the globe in a
cylinder of paper
– Paper tangent to Earth
at equator
– Conformal projection
– Mercator projection is
most famous
11© 2011 Pearson Education, Inc.
Figure 2-7
Families of Map Projections
• Plane Projections
– Project globe onto a
paper that is tangent to
globe at some point
– Displays one
hemisphere well
– Equivalent projection
– An example is an
orthographic plane
projection (Figure 2-13)
12© 2011 Pearson Education, Inc.
Figure 2-9
Families of Map Projections
• Conic Projections
– Project the map onto a
cone tangent to or
intersecting the globe
– Principal parallel
– Good for mapping
small areas on Earth
– Impractical for global
mapping
13© 2011 Pearson Education, Inc.
Figure 2-8
Families of Map Projections
• Pseudocylindrical
Projections
– A mix of conformal and
equivalent
– Central parallel and
meridian cross at right
angles
– Oval shaped; distortion
increases as you move
away from the center
14© 2011 Pearson Education, Inc.
Figure 2-11
Families of Map Projections
• Interrupted Projections
– Minimize distortion
– Discontinuous map,
shapes and sizes
maintained
– Typically oceans are
distorted; land masses
maintain original
shape and size
– Goode’s projection
15© 2011 Pearson Education, Inc.
Figure 2-14
Isolines
• Definition
• Many types
– Isobar: line of constant
pressure
– Isotherm: line of constant
temperature
– Isohyet: line of constant rain
– Isoamplitude: line of
constant wave amplitude
• Construction steps/rules
16© 2011 Pearson Education, Inc.
Figure 2-16
Isolines
17© 2011 Pearson Education, Inc.
800
700
600 500 400
300
Isolines
• Topographic Maps
– Show elevation
contours
– Contour lines
– Lines closer together
represent steeper
terrain
– Often used in
geography
18© 2011 Pearson Education, Inc.
Figure 2-15
Isolines
• Topographic Maps
– Show elevation
contours
– Lines closer together
represent steeper
terrain
– Often used in
geography
19© 2011 Pearson Education, Inc.
Figure 2-15
GPS—Global Positioning System
• Global navigation satellite
system for determining
location on Earth’s
surface
• Wide Area Augmentation
System (WAAS)
• Continuously Operating
GPS Reference Stations
(CORS)
20© 2011 Pearson Education, Inc.
Figure 2-19
Remote Sensing
• Measurement by a device
not in contact with Earth’s
surface
• Common types include:
– Aerial Photographs
– Orthophoto maps
– Visible Light and Infrared
(IR) Scanning
– Thermal IR scanning
– Radar and Sonar
– Many others
21© 2011 Pearson Education, Inc.
Aerial Photography—Figure 2-20
Remote Sensing
• Orthophoto maps
– Photographic maps that
are multicolored and
distortion free
– Useful in low-lying coastal
regions to show marsh
topography
22© 2011 Pearson Education, Inc.
Figure 2-21
Remote Sensing
• Visible light and IR
scanning
– Based off of visible light and
IR part of electromagnetic
spectrum (Figure 2-22)
– Shows “false color”
23© 2011 Pearson Education, Inc.
Figure 2-23
Figure 2-22
Remote Sensing
• Radar Imagery
– “Radio Detection and Ranging”
– Useful for identifying atmospheric moisture
• Sonar Imagery
– “Sound Navigation and Ranging”
– Permits underwater imaging
• Thermal IR scanning
– Scans in the thermal IR part of spectrum
– Shows images based on temperature
– Often utilized in meteorology
24© 2011 Pearson Education, Inc.
GIS—Geographic Information
Systems
• Computer systems used to
analyze and display spatial
data
• Layers of data used in
mapping
• Requires high powered
computing to process
multiple maps
25© 2011 Pearson Education, Inc.
Figure 2-29
Tools of the Geographer
• Vast array of maps, remotely sensed satellite
imagery, and computer applications
• Difficult to determine the best way to use all of
this information
• Some tools better at identifying features on
Earth than others
• Ultimate goal: “To better understand Earth.”
26© 2011 Pearson Education, Inc.
Summary
• Maps are essential to portray features on Earth’s
surface
• Need a map scale to identify how a map relates
to the actual surface features on Earth
• Many other map properties are essential to
interpreting a map
• Globes have several advantages and
disadvantages
• Representing Earth in 2 dimensions can be done
through map projections
27© 2011 Pearson Education, Inc.
Summary
• Many different map projections exist
• Dilemma of equivalent versus conformal
• Plotting isolines on a map can help with
interpretation of features on the map
• The global positioning system (GPS) helps to
identify location on Earth’s surface
• Remote sensing is a measurement of Earth’s
surface from a system not on Earth’s surface
28© 2011 Pearson Education, Inc.
Summary
• Many different remote sensing instruments
exist, including satellite, radar, and sonar
• GIS are computer systems used to analyze and
display spatial data, often in layers
• The geographer has many tools, but the
ultimate goal is “To better understand Earth.”
29© 2011 Pearson Education, Inc.

Ch02

  • 1.
    Chapter 2: PortrayingEarth McKnight’s Physical Geography: A Landscape Appreciation, Tenth Edition, Hess
  • 2.
    Portraying Earth • TheNature of Maps • Map Scale • Map Essentials • The Role of Globes • Map Projections • Families of Map Projections • Isolines 2© 2011 Pearson Education, Inc.
  • 3.
    Portraying Earth • GPS—GlobalPositioning System • Remote Sensing • GIS—Geographic Information Systems • Tools of the Geographer 3© 2011 Pearson Education, Inc.
  • 4.
    The Nature ofMaps • 2-dimensional representation of Earth’s surface • Show 4 key properties of a region – Size – Shape – Distance – Direction • Maps are imperfect, since Earth is a sphere 4© 2011 Pearson Education, Inc. Figure 2-2b
  • 5.
    Map Scale • Mapsare always smaller than the area they represent • Map scales are necessary to understand realistic distances on map • Scale is relationship between area on map and area on Earth • Three primary types – Graphic – Fractional – Verbal 5© 2011 Pearson Education, Inc. Figure 2-3
  • 6.
    Map Scale • Largeversus small map scales 6© 2011 Pearson Education, Inc. Figure 2-4
  • 7.
    Map Essentials • Needseveral properties of maps to help with interpretation: – Title – Date – Legend – Scale – Direction – Location – Data Source – Map Projection 7© 2011 Pearson Education, Inc. Figure 2-5
  • 8.
    The Role ofGlobes • Advantages of Globes – Maintains correct geographic relationships between points – Can accurately represent spatial relationships between points on Earth • Disadvantages of Globes – Only can see a hemisphere at a time – Large and bulky – Cannot contain much detail 8© 2011 Pearson Education, Inc. Figure 2-6
  • 9.
    Map Projections • Challengeof the cartographer (“mapmaker”) – Combine geographic exactness of globe with convenience of flat map • Definition of map projection • Principle behind map projections • Two primary types – Equivalent—ratio of areal size on map and Earth is the same – Conformal—shape of locations on the map is the same as on Earth 9© 2011 Pearson Education, Inc.
  • 10.
    Map Projections • Equivalenceversus conformality dilemma 10© 2011 Pearson Education, Inc. Figure 2-10
  • 11.
    Families of MapProjections • Cylindrical Projections – “Wrap” the globe in a cylinder of paper – Paper tangent to Earth at equator – Conformal projection – Mercator projection is most famous 11© 2011 Pearson Education, Inc. Figure 2-7
  • 12.
    Families of MapProjections • Plane Projections – Project globe onto a paper that is tangent to globe at some point – Displays one hemisphere well – Equivalent projection – An example is an orthographic plane projection (Figure 2-13) 12© 2011 Pearson Education, Inc. Figure 2-9
  • 13.
    Families of MapProjections • Conic Projections – Project the map onto a cone tangent to or intersecting the globe – Principal parallel – Good for mapping small areas on Earth – Impractical for global mapping 13© 2011 Pearson Education, Inc. Figure 2-8
  • 14.
    Families of MapProjections • Pseudocylindrical Projections – A mix of conformal and equivalent – Central parallel and meridian cross at right angles – Oval shaped; distortion increases as you move away from the center 14© 2011 Pearson Education, Inc. Figure 2-11
  • 15.
    Families of MapProjections • Interrupted Projections – Minimize distortion – Discontinuous map, shapes and sizes maintained – Typically oceans are distorted; land masses maintain original shape and size – Goode’s projection 15© 2011 Pearson Education, Inc. Figure 2-14
  • 16.
    Isolines • Definition • Manytypes – Isobar: line of constant pressure – Isotherm: line of constant temperature – Isohyet: line of constant rain – Isoamplitude: line of constant wave amplitude • Construction steps/rules 16© 2011 Pearson Education, Inc. Figure 2-16
  • 17.
    Isolines 17© 2011 PearsonEducation, Inc. 800 700 600 500 400 300
  • 18.
    Isolines • Topographic Maps –Show elevation contours – Contour lines – Lines closer together represent steeper terrain – Often used in geography 18© 2011 Pearson Education, Inc. Figure 2-15
  • 19.
    Isolines • Topographic Maps –Show elevation contours – Lines closer together represent steeper terrain – Often used in geography 19© 2011 Pearson Education, Inc. Figure 2-15
  • 20.
    GPS—Global Positioning System •Global navigation satellite system for determining location on Earth’s surface • Wide Area Augmentation System (WAAS) • Continuously Operating GPS Reference Stations (CORS) 20© 2011 Pearson Education, Inc. Figure 2-19
  • 21.
    Remote Sensing • Measurementby a device not in contact with Earth’s surface • Common types include: – Aerial Photographs – Orthophoto maps – Visible Light and Infrared (IR) Scanning – Thermal IR scanning – Radar and Sonar – Many others 21© 2011 Pearson Education, Inc. Aerial Photography—Figure 2-20
  • 22.
    Remote Sensing • Orthophotomaps – Photographic maps that are multicolored and distortion free – Useful in low-lying coastal regions to show marsh topography 22© 2011 Pearson Education, Inc. Figure 2-21
  • 23.
    Remote Sensing • Visiblelight and IR scanning – Based off of visible light and IR part of electromagnetic spectrum (Figure 2-22) – Shows “false color” 23© 2011 Pearson Education, Inc. Figure 2-23 Figure 2-22
  • 24.
    Remote Sensing • RadarImagery – “Radio Detection and Ranging” – Useful for identifying atmospheric moisture • Sonar Imagery – “Sound Navigation and Ranging” – Permits underwater imaging • Thermal IR scanning – Scans in the thermal IR part of spectrum – Shows images based on temperature – Often utilized in meteorology 24© 2011 Pearson Education, Inc.
  • 25.
    GIS—Geographic Information Systems • Computersystems used to analyze and display spatial data • Layers of data used in mapping • Requires high powered computing to process multiple maps 25© 2011 Pearson Education, Inc. Figure 2-29
  • 26.
    Tools of theGeographer • Vast array of maps, remotely sensed satellite imagery, and computer applications • Difficult to determine the best way to use all of this information • Some tools better at identifying features on Earth than others • Ultimate goal: “To better understand Earth.” 26© 2011 Pearson Education, Inc.
  • 27.
    Summary • Maps areessential to portray features on Earth’s surface • Need a map scale to identify how a map relates to the actual surface features on Earth • Many other map properties are essential to interpreting a map • Globes have several advantages and disadvantages • Representing Earth in 2 dimensions can be done through map projections 27© 2011 Pearson Education, Inc.
  • 28.
    Summary • Many differentmap projections exist • Dilemma of equivalent versus conformal • Plotting isolines on a map can help with interpretation of features on the map • The global positioning system (GPS) helps to identify location on Earth’s surface • Remote sensing is a measurement of Earth’s surface from a system not on Earth’s surface 28© 2011 Pearson Education, Inc.
  • 29.
    Summary • Many differentremote sensing instruments exist, including satellite, radar, and sonar • GIS are computer systems used to analyze and display spatial data, often in layers • The geographer has many tools, but the ultimate goal is “To better understand Earth.” 29© 2011 Pearson Education, Inc.