This document provides instructions for calculating the correlation coefficient between depression and anxiety scores for 12 clients using Excel, and creating a scatter plot to visualize the relationship. The correlation coefficient calculated was 0.625, indicating a moderate positive relationship. The scatter plot was formatted to change the axis labels and title to focus on the correlation between depression and anxiety.
You can enter formulas in two ways, either directly into the cell itself, or at the input line. Either way, you need to start a formula with one of the following symbols: =, + or –. Starting with anything else causes the formula to be treated as if it were text.
Creating Formulas
Understanding Functions
Using regular expressions in functions
Using Pivot tables
The DataPilot dialog
Ms excel 2010 Training in Ambala ! Batra Computer Centrejatin batra
Batra Computer Centre is An ISO certified 9001:2008 training Centre in Ambala.
We Provide Best Ms excel 2010 Training in Ambala. BATRA COMPUTER CENTRE provides best training in C, C++, S.E.O, Web Designing, Web Development and So many other courses are available.
Introduction to Microsoft Excel basics | Excel Intro | Excel | Excel for star...Corp-sKool
Introduction to Microsoft excel. Document to explain basic working fundamental of excel i.e grids (rows and columns)Document specifies basic editing, formatting and validating the data entered in excel.
Introduction to Microsoft Excel basics | Excel Intro | Excel | Excel for star...Corp-sKool
Introduction to Microsoft excel. Document to explain basic working fundamental of excel i.e grids (rows and columns)Document specifies basic editing, formatting and validating the data entered in excel.
You work for a local construction firm Bass Engineering Group .docxrosemarybdodson23141
You work for a local construction firm "Bass Engineering Group" and your supervisor wants to test your knowledge and skills with Microsoft Excel and has instructed you to develop a spreadsheet to calculate weekly payroll. To do this, follow the steps below.
Open a new Microsoft Excel workbook and name the workbook "M6_YourLastName."
When saving this workbook, save to a location for easy access and easy access locations could include your desktop, your documents folder, or an external flash drive. Also, while completing steps for this assignment, it would be a good idea to periodically save your work so that you do not lose any progress.
In your new and opened workbook, notice 3 available worksheets in the bottom left area of the window labeled as “Sheet1,” “Sheet2,” and “Sheet3.” For this assignment, you will use “Sheet1”
For “Sheet1” rename the sheet as “Weekly Payroll” (Hint: Right click on the “Sheet1” tab and the shortcut menu will give you option to rename the sheet.)
For the remaining two worksheets “Sheet2” and “Sheet3” delete these from the workbook. (Hint: Right click on the “Sheet2” tab and the shortcut menu will give you option to delete the sheet and follow the same process to delete “Sheet3”.)
In cell A1 type the name of the construction firm which is "Bass Engineering Group" (Note: It is okay, at this point” for the name to overlap into other columns because in the next step, you are going to merge and center this title).
Using your mouse, select cells A1 through K1, and when these cells are selected, use the “Center and Merge” tool to nicely center the name provided for the local construction firm entered from step 6. (Hint: Click the “?” in the top right area of the Microsoft Excel window and type the keywords “Merge and Center” if you need additional guidance on how to perform this task. Also, the Merge and Center tool can be found under the Home and then under tools for Alignment.)
Now that A1 through K1 is centered and merged, right click on this merged cell and from the shortcut menu select Format Cells. When the Format Cells dialog window appears, click the Alignment Tab and set both the horizontal and vertical alignment to Center. Then click the Font tab and set the font to Arial, set the font style to Bold and set the size to 16. Once formatting is applied, click OK.
For row 2, you will enter labels. For example:
In cell A2, input “EFN” (Reference: EFN stands for Employee First Name)
In cell B2, input “ELN” (Reference: EFN stands for Employee Last Name)
In cell C2, input “HR” (Reference: HR stands for Hourly Rate)
In cell D2, input “OHR” (Reference: OHR stands for Overtime Hourly Rate)
In cell E2, input “THW” (Reference: THW stands for Total Hours Worked)
In cell F2, input “OHW” (Reference: OHW stands for Overtime Hours Worked)
In cell G2, input “GP” (Reference: GP stands for Gross Pay)
In cell H2, input “SST” (Reference: SST stands for Social Security Tax)
In cell I2, input “FWT” (Reference: F.
Essentials of Automations: Optimizing FME Workflows with ParametersSafe Software
Are you looking to streamline your workflows and boost your projects’ efficiency? Do you find yourself searching for ways to add flexibility and control over your FME workflows? If so, you’re in the right place.
Join us for an insightful dive into the world of FME parameters, a critical element in optimizing workflow efficiency. This webinar marks the beginning of our three-part “Essentials of Automation” series. This first webinar is designed to equip you with the knowledge and skills to utilize parameters effectively: enhancing the flexibility, maintainability, and user control of your FME projects.
Here’s what you’ll gain:
- Essentials of FME Parameters: Understand the pivotal role of parameters, including Reader/Writer, Transformer, User, and FME Flow categories. Discover how they are the key to unlocking automation and optimization within your workflows.
- Practical Applications in FME Form: Delve into key user parameter types including choice, connections, and file URLs. Allow users to control how a workflow runs, making your workflows more reusable. Learn to import values and deliver the best user experience for your workflows while enhancing accuracy.
- Optimization Strategies in FME Flow: Explore the creation and strategic deployment of parameters in FME Flow, including the use of deployment and geometry parameters, to maximize workflow efficiency.
- Pro Tips for Success: Gain insights on parameterizing connections and leveraging new features like Conditional Visibility for clarity and simplicity.
We’ll wrap up with a glimpse into future webinars, followed by a Q&A session to address your specific questions surrounding this topic.
Don’t miss this opportunity to elevate your FME expertise and drive your projects to new heights of efficiency.
LF Energy Webinar: Electrical Grid Modelling and Simulation Through PowSyBl -...DanBrown980551
Do you want to learn how to model and simulate an electrical network from scratch in under an hour?
Then welcome to this PowSyBl workshop, hosted by Rte, the French Transmission System Operator (TSO)!
During the webinar, you will discover the PowSyBl ecosystem as well as handle and study an electrical network through an interactive Python notebook.
PowSyBl is an open source project hosted by LF Energy, which offers a comprehensive set of features for electrical grid modelling and simulation. Among other advanced features, PowSyBl provides:
- A fully editable and extendable library for grid component modelling;
- Visualization tools to display your network;
- Grid simulation tools, such as power flows, security analyses (with or without remedial actions) and sensitivity analyses;
The framework is mostly written in Java, with a Python binding so that Python developers can access PowSyBl functionalities as well.
What you will learn during the webinar:
- For beginners: discover PowSyBl's functionalities through a quick general presentation and the notebook, without needing any expert coding skills;
- For advanced developers: master the skills to efficiently apply PowSyBl functionalities to your real-world scenarios.
State of ICS and IoT Cyber Threat Landscape Report 2024 previewPrayukth K V
The IoT and OT threat landscape report has been prepared by the Threat Research Team at Sectrio using data from Sectrio, cyber threat intelligence farming facilities spread across over 85 cities around the world. In addition, Sectrio also runs AI-based advanced threat and payload engagement facilities that serve as sinks to attract and engage sophisticated threat actors, and newer malware including new variants and latent threats that are at an earlier stage of development.
The latest edition of the OT/ICS and IoT security Threat Landscape Report 2024 also covers:
State of global ICS asset and network exposure
Sectoral targets and attacks as well as the cost of ransom
Global APT activity, AI usage, actor and tactic profiles, and implications
Rise in volumes of AI-powered cyberattacks
Major cyber events in 2024
Malware and malicious payload trends
Cyberattack types and targets
Vulnerability exploit attempts on CVEs
Attacks on counties – USA
Expansion of bot farms – how, where, and why
In-depth analysis of the cyber threat landscape across North America, South America, Europe, APAC, and the Middle East
Why are attacks on smart factories rising?
Cyber risk predictions
Axis of attacks – Europe
Systemic attacks in the Middle East
Download the full report from here:
https://sectrio.com/resources/ot-threat-landscape-reports/sectrio-releases-ot-ics-and-iot-security-threat-landscape-report-2024/
"Impact of front-end architecture on development cost", Viktor TurskyiFwdays
I have heard many times that architecture is not important for the front-end. Also, many times I have seen how developers implement features on the front-end just following the standard rules for a framework and think that this is enough to successfully launch the project, and then the project fails. How to prevent this and what approach to choose? I have launched dozens of complex projects and during the talk we will analyze which approaches have worked for me and which have not.
Builder.ai Founder Sachin Dev Duggal's Strategic Approach to Create an Innova...Ramesh Iyer
In today's fast-changing business world, Companies that adapt and embrace new ideas often need help to keep up with the competition. However, fostering a culture of innovation takes much work. It takes vision, leadership and willingness to take risks in the right proportion. Sachin Dev Duggal, co-founder of Builder.ai, has perfected the art of this balance, creating a company culture where creativity and growth are nurtured at each stage.
UiPath Test Automation using UiPath Test Suite series, part 3DianaGray10
Welcome to UiPath Test Automation using UiPath Test Suite series part 3. In this session, we will cover desktop automation along with UI automation.
Topics covered:
UI automation Introduction,
UI automation Sample
Desktop automation flow
Pradeep Chinnala, Senior Consultant Automation Developer @WonderBotz and UiPath MVP
Deepak Rai, Automation Practice Lead, Boundaryless Group and UiPath MVP
PHP Frameworks: I want to break free (IPC Berlin 2024)Ralf Eggert
In this presentation, we examine the challenges and limitations of relying too heavily on PHP frameworks in web development. We discuss the history of PHP and its frameworks to understand how this dependence has evolved. The focus will be on providing concrete tips and strategies to reduce reliance on these frameworks, based on real-world examples and practical considerations. The goal is to equip developers with the skills and knowledge to create more flexible and future-proof web applications. We'll explore the importance of maintaining autonomy in a rapidly changing tech landscape and how to make informed decisions in PHP development.
This talk is aimed at encouraging a more independent approach to using PHP frameworks, moving towards a more flexible and future-proof approach to PHP development.
UiPath Test Automation using UiPath Test Suite series, part 4DianaGray10
Welcome to UiPath Test Automation using UiPath Test Suite series part 4. In this session, we will cover Test Manager overview along with SAP heatmap.
The UiPath Test Manager overview with SAP heatmap webinar offers a concise yet comprehensive exploration of the role of a Test Manager within SAP environments, coupled with the utilization of heatmaps for effective testing strategies.
Participants will gain insights into the responsibilities, challenges, and best practices associated with test management in SAP projects. Additionally, the webinar delves into the significance of heatmaps as a visual aid for identifying testing priorities, areas of risk, and resource allocation within SAP landscapes. Through this session, attendees can expect to enhance their understanding of test management principles while learning practical approaches to optimize testing processes in SAP environments using heatmap visualization techniques
What will you get from this session?
1. Insights into SAP testing best practices
2. Heatmap utilization for testing
3. Optimization of testing processes
4. Demo
Topics covered:
Execution from the test manager
Orchestrator execution result
Defect reporting
SAP heatmap example with demo
Speaker:
Deepak Rai, Automation Practice Lead, Boundaryless Group and UiPath MVP
Dev Dives: Train smarter, not harder – active learning and UiPath LLMs for do...UiPathCommunity
💥 Speed, accuracy, and scaling – discover the superpowers of GenAI in action with UiPath Document Understanding and Communications Mining™:
See how to accelerate model training and optimize model performance with active learning
Learn about the latest enhancements to out-of-the-box document processing – with little to no training required
Get an exclusive demo of the new family of UiPath LLMs – GenAI models specialized for processing different types of documents and messages
This is a hands-on session specifically designed for automation developers and AI enthusiasts seeking to enhance their knowledge in leveraging the latest intelligent document processing capabilities offered by UiPath.
Speakers:
👨🏫 Andras Palfi, Senior Product Manager, UiPath
👩🏫 Lenka Dulovicova, Product Program Manager, UiPath
The Art of the Pitch: WordPress Relationships and SalesLaura Byrne
Clients don’t know what they don’t know. What web solutions are right for them? How does WordPress come into the picture? How do you make sure you understand scope and timeline? What do you do if sometime changes?
All these questions and more will be explored as we talk about matching clients’ needs with what your agency offers without pulling teeth or pulling your hair out. Practical tips, and strategies for successful relationship building that leads to closing the deal.
Let's dive deeper into the world of ODC! Ricardo Alves (OutSystems) will join us to tell all about the new Data Fabric. After that, Sezen de Bruijn (OutSystems) will get into the details on how to best design a sturdy architecture within ODC.
Transcript: Selling digital books in 2024: Insights from industry leaders - T...BookNet Canada
The publishing industry has been selling digital audiobooks and ebooks for over a decade and has found its groove. What’s changed? What has stayed the same? Where do we go from here? Join a group of leading sales peers from across the industry for a conversation about the lessons learned since the popularization of digital books, best practices, digital book supply chain management, and more.
Link to video recording: https://bnctechforum.ca/sessions/selling-digital-books-in-2024-insights-from-industry-leaders/
Presented by BookNet Canada on May 28, 2024, with support from the Department of Canadian Heritage.
Transcript: Selling digital books in 2024: Insights from industry leaders - T...
Calculating a correlation coefficient and scatter plot using excel
1. Calculating a Correlation Coefficient and Scatter Plot using Excel
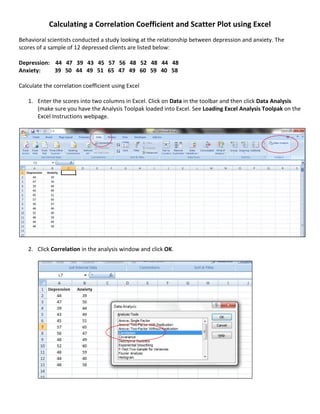
Behavioral scientists conducted a study looking at the relationship between depression and anxiety. The
scores of a sample of 12 depressed clients are listed below:
Depression: 44 47 39 43 45 57 56 48 52 48 44 48
Anxiety: 39 50 44 49 51 65 47 49 60 59 40 58
Calculate the correlation coefficient using Excel
1. Enter the scores into two columns in Excel. Click on Data in the toolbar and then click Data Analysis
(make sure you have the Analysis Toolpak loaded into Excel. See Loading Excel Analysis Toolpak on the
Excel Instructions webpage.
2. Click Correlation in the analysis window and click OK.
2. 3. Click on the Input Range box and highlight cells A1 to B13. Make sure you have the box next to Labels
in first row clicked.
4. Click on the Output Range box and click cell B15. Click OK.
The correlation coefficient will appear. In this example the correlation between Depression and Anxiety
is .625
3. CREATING A SCATTERPLOT
1. Highlight cells A1 to B13. Click on the Insert tab in toolbar and then click Scatter.
2. Choose the first box.
4. 3. The scatterplot will appear.
4. To change the title of the graph, click on Anxiety and type Correlation between Depression and
Anxiety. Click on the Anxiety legend and hit the Delete key on your key board to remove.
5. To change the values on the horizontal and vertical axes, click on any place in the scatterplot and then
click the Layout tab on the toolbar and then click on Axis.
5. 6. Click Primary Horizontal Axis and then More Primary Horizontal Axis Options.
7. Click the Fixed button to minimize the horizontal axis values and type 35 in the box. Click Close.
6. 8. Next click Primary Vertical Axis and More Primary Vertical Axis Options.
9. Click the Fixed button to minimize the vertical axis values and type 30 in the box. Click Close.
7. 10. The minimum values on both the horizontal vertical axes have been changed. The formatting of the
scatterplot is complete. The plot shows a moderately positive relationship between depression and
anxiety.