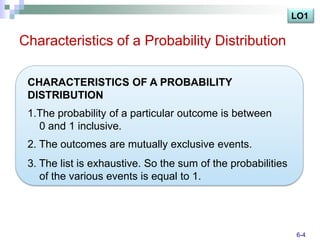
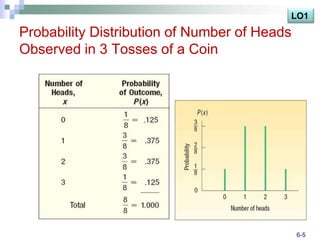
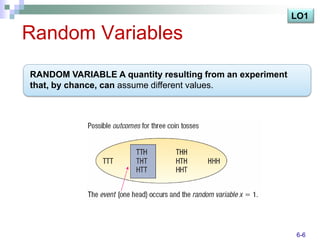
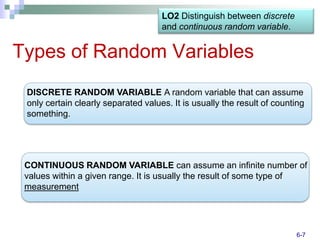
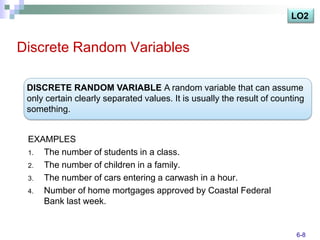
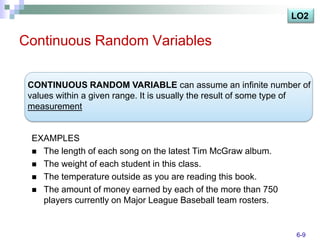
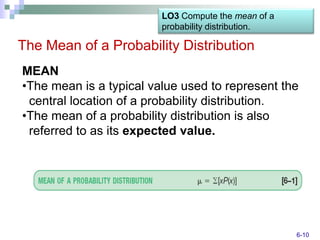
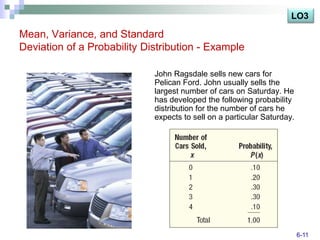
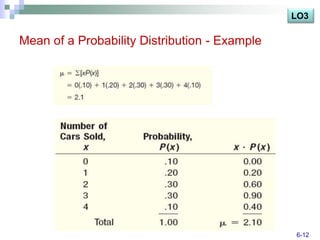
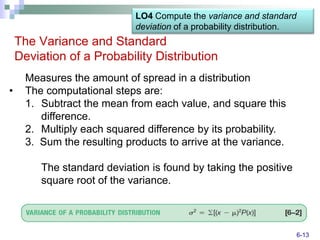
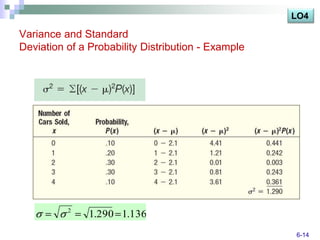
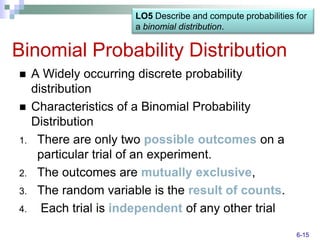
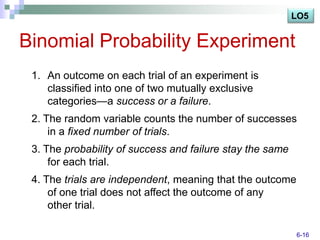
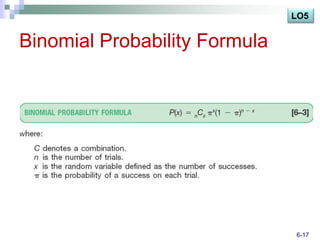
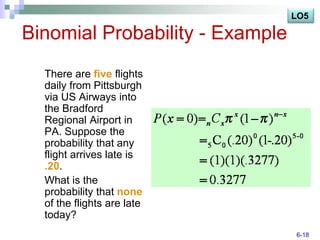
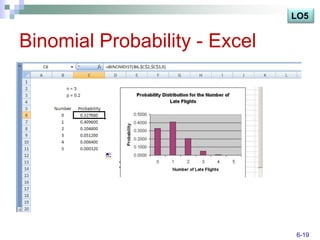
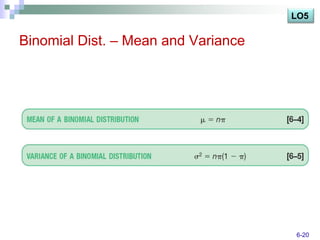
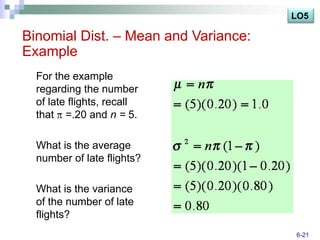
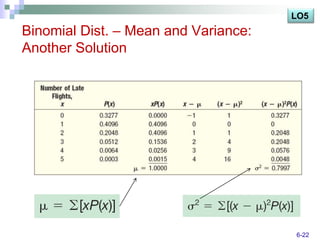
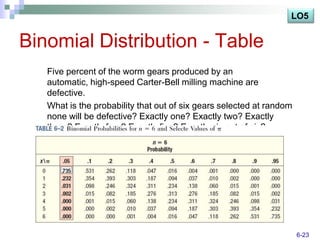
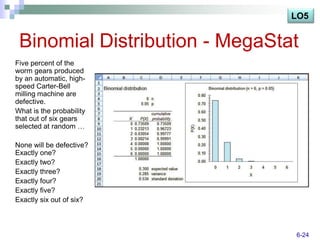
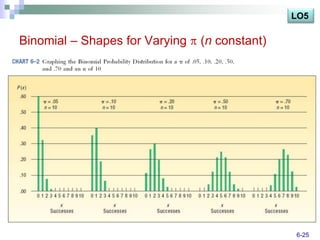
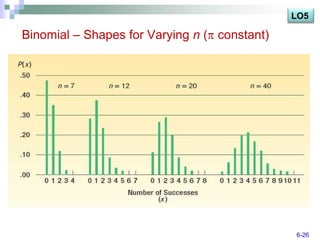
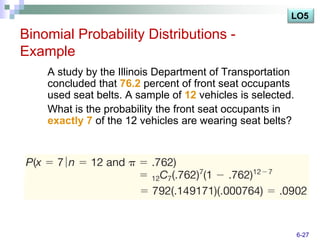
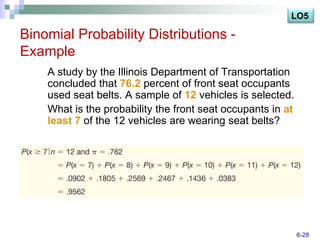
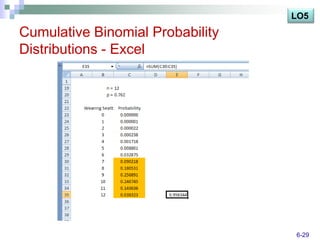
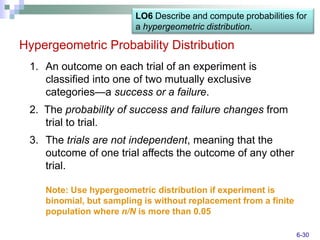
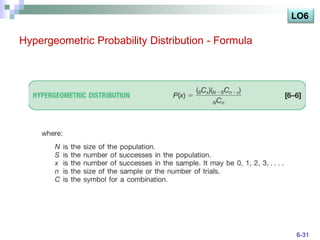
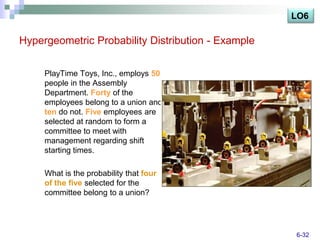
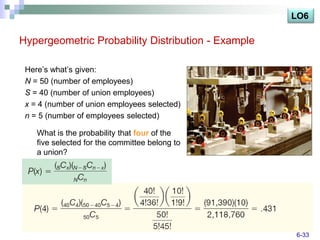
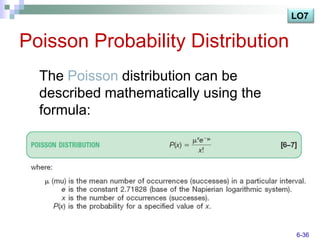
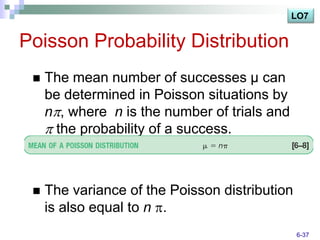
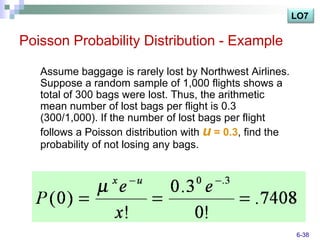
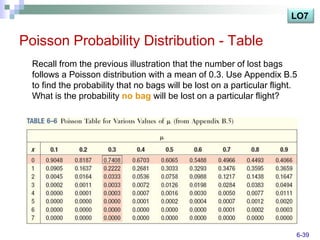
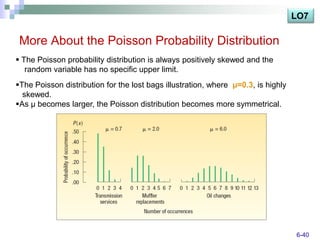
The document discusses various probability distributions including discrete, binomial, hypergeometric, and Poisson distributions. It provides learning objectives on identifying characteristics of probability distributions, distinguishing between discrete and continuous random variables, computing means, variances and probabilities. Examples are given to illustrate computing probabilities and distributions for binomial, hypergeometric and Poisson distributions. The key characteristics, formulas, and applications of each distribution are defined.
Accounting Cycle- Accruals and Defferls- Adjusting entriesFaHaD .H. NooR
An accrual occurs before a payment or receipt. A deferral occurs after a payment or receipt. There are accruals for expenses and for revenues. There are deferrals for expenses and for revenues.
An accrual of an expense refers to the reporting of an expense and the related liability in the period in which they occur, and that period is prior to the period in which the payment is made. An example of an accrual for an expense is the electricity that is used in December, but the payment will not be made until January.
An accrual of revenues refers to the reporting of revenues and the related receivables in the period in which they are earned, and that period is prior to the period of the cash receipt. An example of the accrual of revenues is the interest earned in December on an investment in a government bond, but the interest will not be received until January.
A deferral of an expense refers to a payment that was made in one period, but will be reported as an expense in a later period. An example is the payment in December for the six-month insurance premium that will be reported as an expense in the months of January through June.
A deferral of revenues refers to receipts in one accounting period, but they will be earned in future accounting periods. For example, the insurance company has a cash receipt in December for a six-month insurance premium. However, the insurance company will report this as part of its revenues in January through June.
Bad debts and Provision for Bad debts. Bad Debts. When the firm finds that it is impossible to collect a debt, that debt should be written off as a bad debt.
Defined Expected utility theory,
Defined Prospect Theory,
Defined Disposition effect
Defined Heuristics and biases
Contact: rehankango@ymail.com +92337548656
This presentation is prepared by Toran Lal Verma. The presentation deals with the calculation of cost of debt, equity, preference share and retained earnings.
Cengage Learning Webinar, Developmental Math Course Redesign in North CarolinaCengage Learning
Learn how professors at Central Carolina Community College and Citrus College are implementing new developmental math practices and courses based on North Carolina's state standards, and how you can too with this session dedicated to developmental math course redesign in North Carolina.
In this presentation, Alan Tussy, Citrus College, and Lisa Key Brown, Central Caroline Community College, discussed how Central Carolina is using booklets specifically designed for North Carolina (Tussy, A Modular Curriculum for North Carolina) and the pre-built software-WebAssign in a lecture/lab and online distance education format. Custom booklets with the rich applications to enhance the pedagogy shift to conceptual and contextual understanding of mathematics were explored.
Software Delivery At the Speed of AI: Inflectra Invests In AI-Powered QualityInflectra
In this insightful webinar, Inflectra explores how artificial intelligence (AI) is transforming software development and testing. Discover how AI-powered tools are revolutionizing every stage of the software development lifecycle (SDLC), from design and prototyping to testing, deployment, and monitoring.
Learn about:
• The Future of Testing: How AI is shifting testing towards verification, analysis, and higher-level skills, while reducing repetitive tasks.
• Test Automation: How AI-powered test case generation, optimization, and self-healing tests are making testing more efficient and effective.
• Visual Testing: Explore the emerging capabilities of AI in visual testing and how it's set to revolutionize UI verification.
• Inflectra's AI Solutions: See demonstrations of Inflectra's cutting-edge AI tools like the ChatGPT plugin and Azure Open AI platform, designed to streamline your testing process.
Whether you're a developer, tester, or QA professional, this webinar will give you valuable insights into how AI is shaping the future of software delivery.
GDG Cloud Southlake #33: Boule & Rebala: Effective AppSec in SDLC using Deplo...James Anderson
Effective Application Security in Software Delivery lifecycle using Deployment Firewall and DBOM
The modern software delivery process (or the CI/CD process) includes many tools, distributed teams, open-source code, and cloud platforms. Constant focus on speed to release software to market, along with the traditional slow and manual security checks has caused gaps in continuous security as an important piece in the software supply chain. Today organizations feel more susceptible to external and internal cyber threats due to the vast attack surface in their applications supply chain and the lack of end-to-end governance and risk management.
The software team must secure its software delivery process to avoid vulnerability and security breaches. This needs to be achieved with existing tool chains and without extensive rework of the delivery processes. This talk will present strategies and techniques for providing visibility into the true risk of the existing vulnerabilities, preventing the introduction of security issues in the software, resolving vulnerabilities in production environments quickly, and capturing the deployment bill of materials (DBOM).
Speakers:
Bob Boule
Robert Boule is a technology enthusiast with PASSION for technology and making things work along with a knack for helping others understand how things work. He comes with around 20 years of solution engineering experience in application security, software continuous delivery, and SaaS platforms. He is known for his dynamic presentations in CI/CD and application security integrated in software delivery lifecycle.
Gopinath Rebala
Gopinath Rebala is the CTO of OpsMx, where he has overall responsibility for the machine learning and data processing architectures for Secure Software Delivery. Gopi also has a strong connection with our customers, leading design and architecture for strategic implementations. Gopi is a frequent speaker and well-known leader in continuous delivery and integrating security into software delivery.
PHP Frameworks: I want to break free (IPC Berlin 2024)Ralf Eggert
In this presentation, we examine the challenges and limitations of relying too heavily on PHP frameworks in web development. We discuss the history of PHP and its frameworks to understand how this dependence has evolved. The focus will be on providing concrete tips and strategies to reduce reliance on these frameworks, based on real-world examples and practical considerations. The goal is to equip developers with the skills and knowledge to create more flexible and future-proof web applications. We'll explore the importance of maintaining autonomy in a rapidly changing tech landscape and how to make informed decisions in PHP development.
This talk is aimed at encouraging a more independent approach to using PHP frameworks, moving towards a more flexible and future-proof approach to PHP development.
Transcript: Selling digital books in 2024: Insights from industry leaders - T...BookNet Canada
The publishing industry has been selling digital audiobooks and ebooks for over a decade and has found its groove. What’s changed? What has stayed the same? Where do we go from here? Join a group of leading sales peers from across the industry for a conversation about the lessons learned since the popularization of digital books, best practices, digital book supply chain management, and more.
Link to video recording: https://bnctechforum.ca/sessions/selling-digital-books-in-2024-insights-from-industry-leaders/
Presented by BookNet Canada on May 28, 2024, with support from the Department of Canadian Heritage.
GraphRAG is All You need? LLM & Knowledge GraphGuy Korland
Guy Korland, CEO and Co-founder of FalkorDB, will review two articles on the integration of language models with knowledge graphs.
1. Unifying Large Language Models and Knowledge Graphs: A Roadmap.
https://arxiv.org/abs/2306.08302
2. Microsoft Research's GraphRAG paper and a review paper on various uses of knowledge graphs:
https://www.microsoft.com/en-us/research/blog/graphrag-unlocking-llm-discovery-on-narrative-private-data/
JMeter webinar - integration with InfluxDB and GrafanaRTTS
Watch this recorded webinar about real-time monitoring of application performance. See how to integrate Apache JMeter, the open-source leader in performance testing, with InfluxDB, the open-source time-series database, and Grafana, the open-source analytics and visualization application.
In this webinar, we will review the benefits of leveraging InfluxDB and Grafana when executing load tests and demonstrate how these tools are used to visualize performance metrics.
Length: 30 minutes
Session Overview
-------------------------------------------
During this webinar, we will cover the following topics while demonstrating the integrations of JMeter, InfluxDB and Grafana:
- What out-of-the-box solutions are available for real-time monitoring JMeter tests?
- What are the benefits of integrating InfluxDB and Grafana into the load testing stack?
- Which features are provided by Grafana?
- Demonstration of InfluxDB and Grafana using a practice web application
To view the webinar recording, go to:
https://www.rttsweb.com/jmeter-integration-webinar
Let's dive deeper into the world of ODC! Ricardo Alves (OutSystems) will join us to tell all about the new Data Fabric. After that, Sezen de Bruijn (OutSystems) will get into the details on how to best design a sturdy architecture within ODC.
LF Energy Webinar: Electrical Grid Modelling and Simulation Through PowSyBl -...DanBrown980551
Do you want to learn how to model and simulate an electrical network from scratch in under an hour?
Then welcome to this PowSyBl workshop, hosted by Rte, the French Transmission System Operator (TSO)!
During the webinar, you will discover the PowSyBl ecosystem as well as handle and study an electrical network through an interactive Python notebook.
PowSyBl is an open source project hosted by LF Energy, which offers a comprehensive set of features for electrical grid modelling and simulation. Among other advanced features, PowSyBl provides:
- A fully editable and extendable library for grid component modelling;
- Visualization tools to display your network;
- Grid simulation tools, such as power flows, security analyses (with or without remedial actions) and sensitivity analyses;
The framework is mostly written in Java, with a Python binding so that Python developers can access PowSyBl functionalities as well.
What you will learn during the webinar:
- For beginners: discover PowSyBl's functionalities through a quick general presentation and the notebook, without needing any expert coding skills;
- For advanced developers: master the skills to efficiently apply PowSyBl functionalities to your real-world scenarios.
Kubernetes & AI - Beauty and the Beast !?! @KCD Istanbul 2024Tobias Schneck
As AI technology is pushing into IT I was wondering myself, as an “infrastructure container kubernetes guy”, how get this fancy AI technology get managed from an infrastructure operational view? Is it possible to apply our lovely cloud native principals as well? What benefit’s both technologies could bring to each other?
Let me take this questions and provide you a short journey through existing deployment models and use cases for AI software. On practical examples, we discuss what cloud/on-premise strategy we may need for applying it to our own infrastructure to get it to work from an enterprise perspective. I want to give an overview about infrastructure requirements and technologies, what could be beneficial or limiting your AI use cases in an enterprise environment. An interactive Demo will give you some insides, what approaches I got already working for real.
Connector Corner: Automate dynamic content and events by pushing a buttonDianaGray10
Here is something new! In our next Connector Corner webinar, we will demonstrate how you can use a single workflow to:
Create a campaign using Mailchimp with merge tags/fields
Send an interactive Slack channel message (using buttons)
Have the message received by managers and peers along with a test email for review
But there’s more:
In a second workflow supporting the same use case, you’ll see:
Your campaign sent to target colleagues for approval
If the “Approve” button is clicked, a Jira/Zendesk ticket is created for the marketing design team
But—if the “Reject” button is pushed, colleagues will be alerted via Slack message
Join us to learn more about this new, human-in-the-loop capability, brought to you by Integration Service connectors.
And...
Speakers:
Akshay Agnihotri, Product Manager
Charlie Greenberg, Host
The Art of the Pitch: WordPress Relationships and SalesLaura Byrne
Clients don’t know what they don’t know. What web solutions are right for them? How does WordPress come into the picture? How do you make sure you understand scope and timeline? What do you do if sometime changes?
All these questions and more will be explored as we talk about matching clients’ needs with what your agency offers without pulling teeth or pulling your hair out. Practical tips, and strategies for successful relationship building that leads to closing the deal.
2. Learning Objectives
LO1 Identify the characteristics of a probability distribution.
LO2 Distinguish between discrete and continuous random
variable.
LO3 Compute the mean of a probability distribution.
LO4 Compute the variance and standard deviation of a
probability distribution.
LO5 Describe and compute probabilities for a binomial
distribution.
LO6 Describe and compute probabilities for a
hypergeometric distribution.
LO7 Describe and compute probabilities for a Poisson
distribution. 6-2
3. LO1 Identify the characteristics
of a probability distribution.
What is a Probability Distribution?
PROBABILITY DISTRIBUTION A listing of all the outcomes of
an experiment and the probability associated with each outcome.
Experiment:
Toss a coin three times.
Observe the number of
heads. The possible
results are: Zero heads,
One head,
Two heads, and
Three heads.
What is the probability
distribution for the
number of heads?
6-3
4. LO1
Characteristics of a Probability Distribution
CHARACTERISTICS OF A PROBABILITY
DISTRIBUTION
1.The probability of a particular outcome is between
0 and 1 inclusive.
2. The outcomes are mutually exclusive events.
3. The list is exhaustive. So the sum of the probabilities
of the various events is equal to 1.
6-4
7. LO2 Distinguish between discrete
and continuous random variable.
Types of Random Variables
DISCRETE RANDOM VARIABLE A random variable that can assume
only certain clearly separated values. It is usually the result of counting
something.
CONTINUOUS RANDOM VARIABLE can assume an infinite number of
values within a given range. It is usually the result of some type of
measurement
6-7
8. LO2
Discrete Random Variables
DISCRETE RANDOM VARIABLE A random variable that can assume
only certain clearly separated values. It is usually the result of counting
something.
EXAMPLES
1. The number of students in a class.
2. The number of children in a family.
3. The number of cars entering a carwash in a hour.
4. Number of home mortgages approved by Coastal Federal
Bank last week.
6-8
9. LO2
Continuous Random Variables
CONTINUOUS RANDOM VARIABLE can assume an infinite number of
values within a given range. It is usually the result of some type of
measurement
EXAMPLES
The length of each song on the latest Tim McGraw album.
The weight of each student in this class.
The temperature outside as you are reading this book.
The amount of money earned by each of the more than 750
players currently on Major League Baseball team rosters.
6-9
10. LO3 Compute the mean of a
probability distribution.
The Mean of a Probability Distribution
MEAN
•The mean is a typical value used to represent the
central location of a probability distribution.
•The mean of a probability distribution is also
referred to as its expected value.
6-10
11. LO3
Mean, Variance, and Standard
Deviation of a Probability Distribution - Example
John Ragsdale sells new cars for
Pelican Ford. John usually sells the
largest number of cars on Saturday. He
has developed the following probability
distribution for the number of cars he
expects to sell on a particular Saturday.
6-11
12. LO3
Mean of a Probability Distribution - Example
6-12
13. LO4 Compute the variance and standard
deviation of a probability distribution.
The Variance and Standard
Deviation of a Probability Distribution
Measures the amount of spread in a distribution
• The computational steps are:
1. Subtract the mean from each value, and square this
difference.
2. Multiply each squared difference by its probability.
3. Sum the resulting products to arrive at the variance.
The standard deviation is found by taking the positive
square root of the variance.
6-13
15. LO5 Describe and compute probabilities for
a binomial distribution.
Binomial Probability Distribution
A Widely occurring discrete probability
distribution
Characteristics of a Binomial Probability
Distribution
1. There are only two possible outcomes on a
particular trial of an experiment.
2. The outcomes are mutually exclusive,
3. The random variable is the result of counts.
4. Each trial is independent of any other trial
6-15
16. LO5
Binomial Probability Experiment
1. An outcome on each trial of an experiment is
classified into one of two mutually exclusive
categories—a success or a failure.
2. The random variable counts the number of successes
in a fixed number of trials.
3. The probability of success and failure stay the same
for each trial.
4. The trials are independent, meaning that the outcome
of one trial does not affect the outcome of any
other trial.
6-16
18. LO5
Binomial Probability - Example
There are five flights
daily from Pittsburgh
via US Airways into
the Bradford
Regional Airport in
PA. Suppose the
probability that any
flight arrives late is
.20.
What is the
probability that none
of the flights are late
today?
6-18
21. LO5
Binomial Dist. – Mean and Variance:
Example
For the example
regarding the number
of late flights, recall
that =.20 and n = 5.
What is the average
number of late flights?
What is the variance
of the number of late
flights?
6-21
23. LO5
Binomial Distribution - Table
Five percent of the worm gears produced by an
automatic, high-speed Carter-Bell milling machine are
defective.
What is the probability that out of six gears selected at random
none will be defective? Exactly one? Exactly two? Exactly
three? Exactly four? Exactly five? Exactly six out of six?
6-23
24. LO5
Binomial Distribution - MegaStat
Five percent of the
worm gears produced
by an automatic, high-
speed Carter-Bell
milling machine are
defective.
What is the probability
that out of six gears
selected at random …
None will be defective?
Exactly one?
Exactly two?
Exactly three?
Exactly four?
Exactly five?
Exactly six out of six?
6-24
27. LO5
Binomial Probability Distributions -
Example
A study by the Illinois Department of Transportation
concluded that 76.2 percent of front seat occupants
used seat belts. A sample of 12 vehicles is selected.
What is the probability the front seat occupants in
exactly 7 of the 12 vehicles are wearing seat belts?
6-27
28. LO5
Binomial Probability Distributions -
Example
A study by the Illinois Department of Transportation
concluded that 76.2 percent of front seat occupants
used seat belts. A sample of 12 vehicles is selected.
What is the probability the front seat occupants in at
least 7 of the 12 vehicles are wearing seat belts?
6-28
30. LO6 Describe and compute probabilities for
a hypergeometric distribution.
Hypergeometric Probability Distribution
1. An outcome on each trial of an experiment is
classified into one of two mutually exclusive
categories—a success or a failure.
2. The probability of success and failure changes from
trial to trial.
3. The trials are not independent, meaning that the
outcome of one trial affects the outcome of any other
trial.
Note: Use hypergeometric distribution if experiment is
binomial, but sampling is without replacement from a finite
population where n/N is more than 0.05
6-30
32. LO6
Hypergeometric Probability Distribution - Example
PlayTime Toys, Inc., employs 50
people in the Assembly
Department. Forty of the
employees belong to a union and
ten do not. Five employees are
selected at random to form a
committee to meet with
management regarding shift
starting times.
What is the probability that four
of the five selected for the
committee belong to a union?
6-32
33. LO6
Hypergeometric Probability Distribution - Example
Here’s what’s given:
N = 50 (number of employees)
S = 40 (number of union employees)
x = 4 (number of union employees selected)
n = 5 (number of employees selected)
What is the probability that four of the
five selected for the committee belong to
a union?
33
6-33
34. LO7 Describe and compute
probabilities for a Poisson distribution.
Poisson Probability Distribution
The Poisson probability distribution
describes the number of times some event
occurs during a specified interval. The
interval may be time, distance, area, or volume.
Assumptions of the Poisson Distribution
The probability is proportional to the length of the
interval.
The intervals are independent.
6-34
35. LO7
Poisson Probability Distribution
The Poisson probability distribution is characterized
by the number of times an event happens during
some interval or continuum.
Examples include:
• The number of misspelled words per page in a
newspaper.
• The number of calls per hour received by Dyson
Vacuum Cleaner Company.
• The number of vehicles sold per day at Hyatt Buick
GMC in Durham, North Carolina.
• The number of goals scored in a college soccer game.
6-35
37. LO7
Poisson Probability Distribution
The mean number of successes μ can
be determined in Poisson situations by
n , where n is the number of trials and
the probability of a success.
The variance of the Poisson distribution
is also equal to n .
6-37
38. LO7
Poisson Probability Distribution - Example
Assume baggage is rarely lost by Northwest Airlines.
Suppose a random sample of 1,000 flights shows a
total of 300 bags were lost. Thus, the arithmetic
mean number of lost bags per flight is 0.3
(300/1,000). If the number of lost bags per flight
follows a Poisson distribution with u = 0.3, find the
probability of not losing any bags.
6-38
39. LO7
Poisson Probability Distribution - Table
Recall from the previous illustration that the number of lost bags
follows a Poisson distribution with a mean of 0.3. Use Appendix B.5
to find the probability that no bags will be lost on a particular flight.
What is the probability no bag will be lost on a particular flight?
6-39
40. LO7
More About the Poisson Probability Distribution
The Poisson probability distribution is always positively skewed and the
random variable has no specific upper limit.
The Poisson distribution for the lost bags illustration, where µ=0.3, is highly
skewed.
As µ becomes larger, the Poisson distribution becomes more symmetrical.
6-40