Here are the steps to solve this problem:
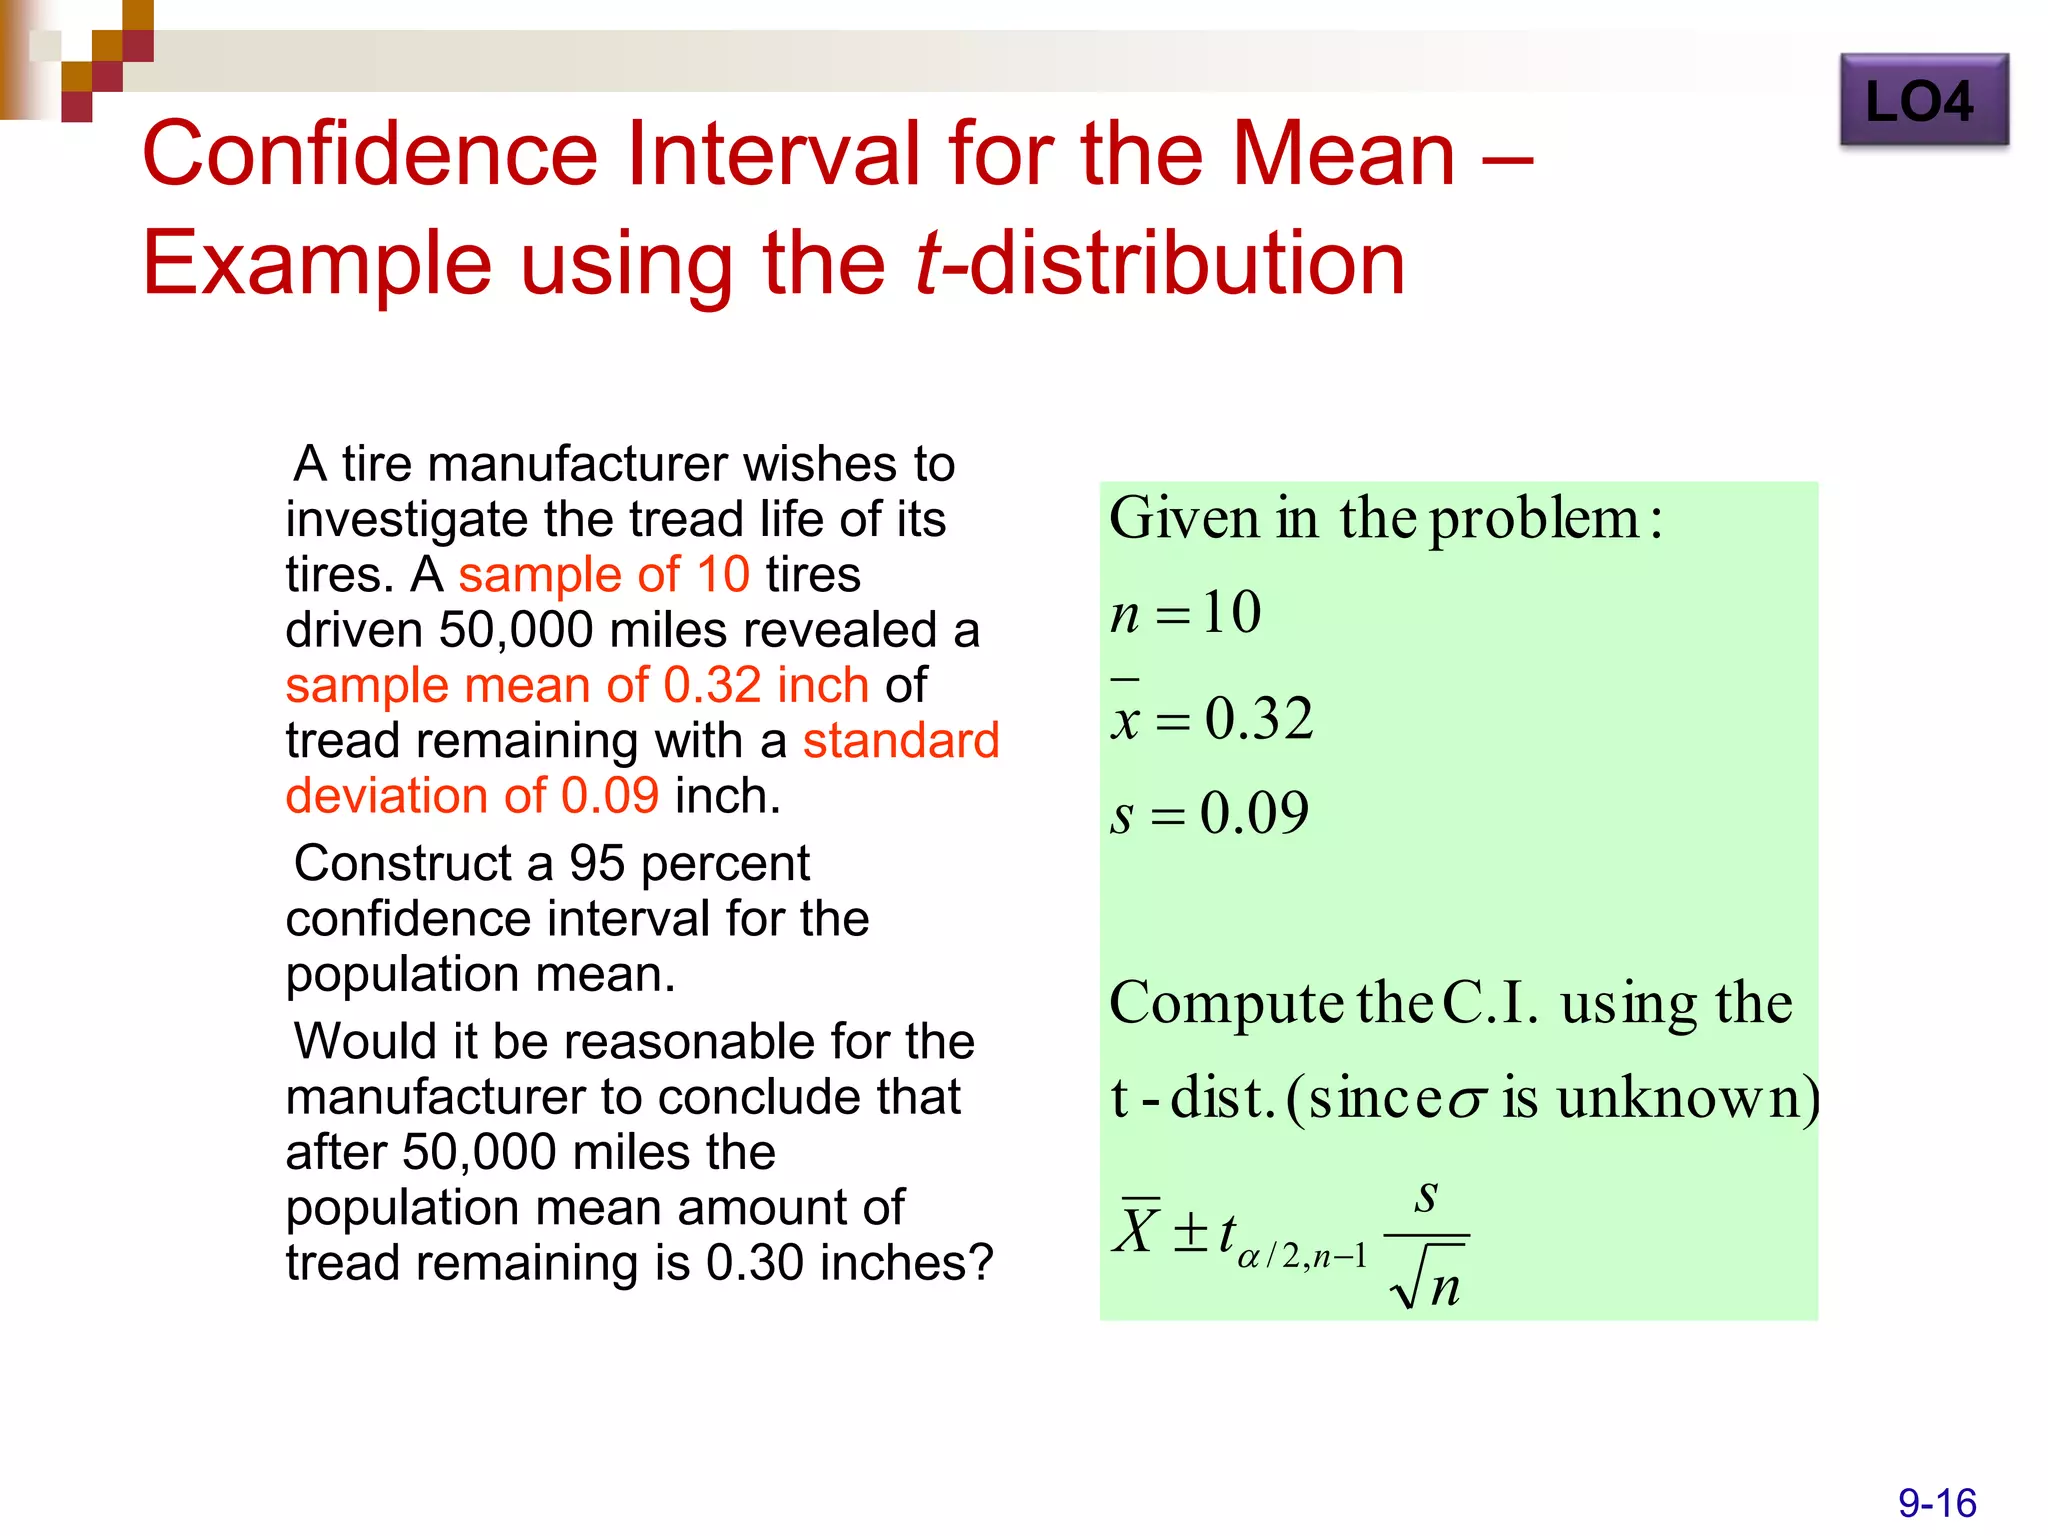
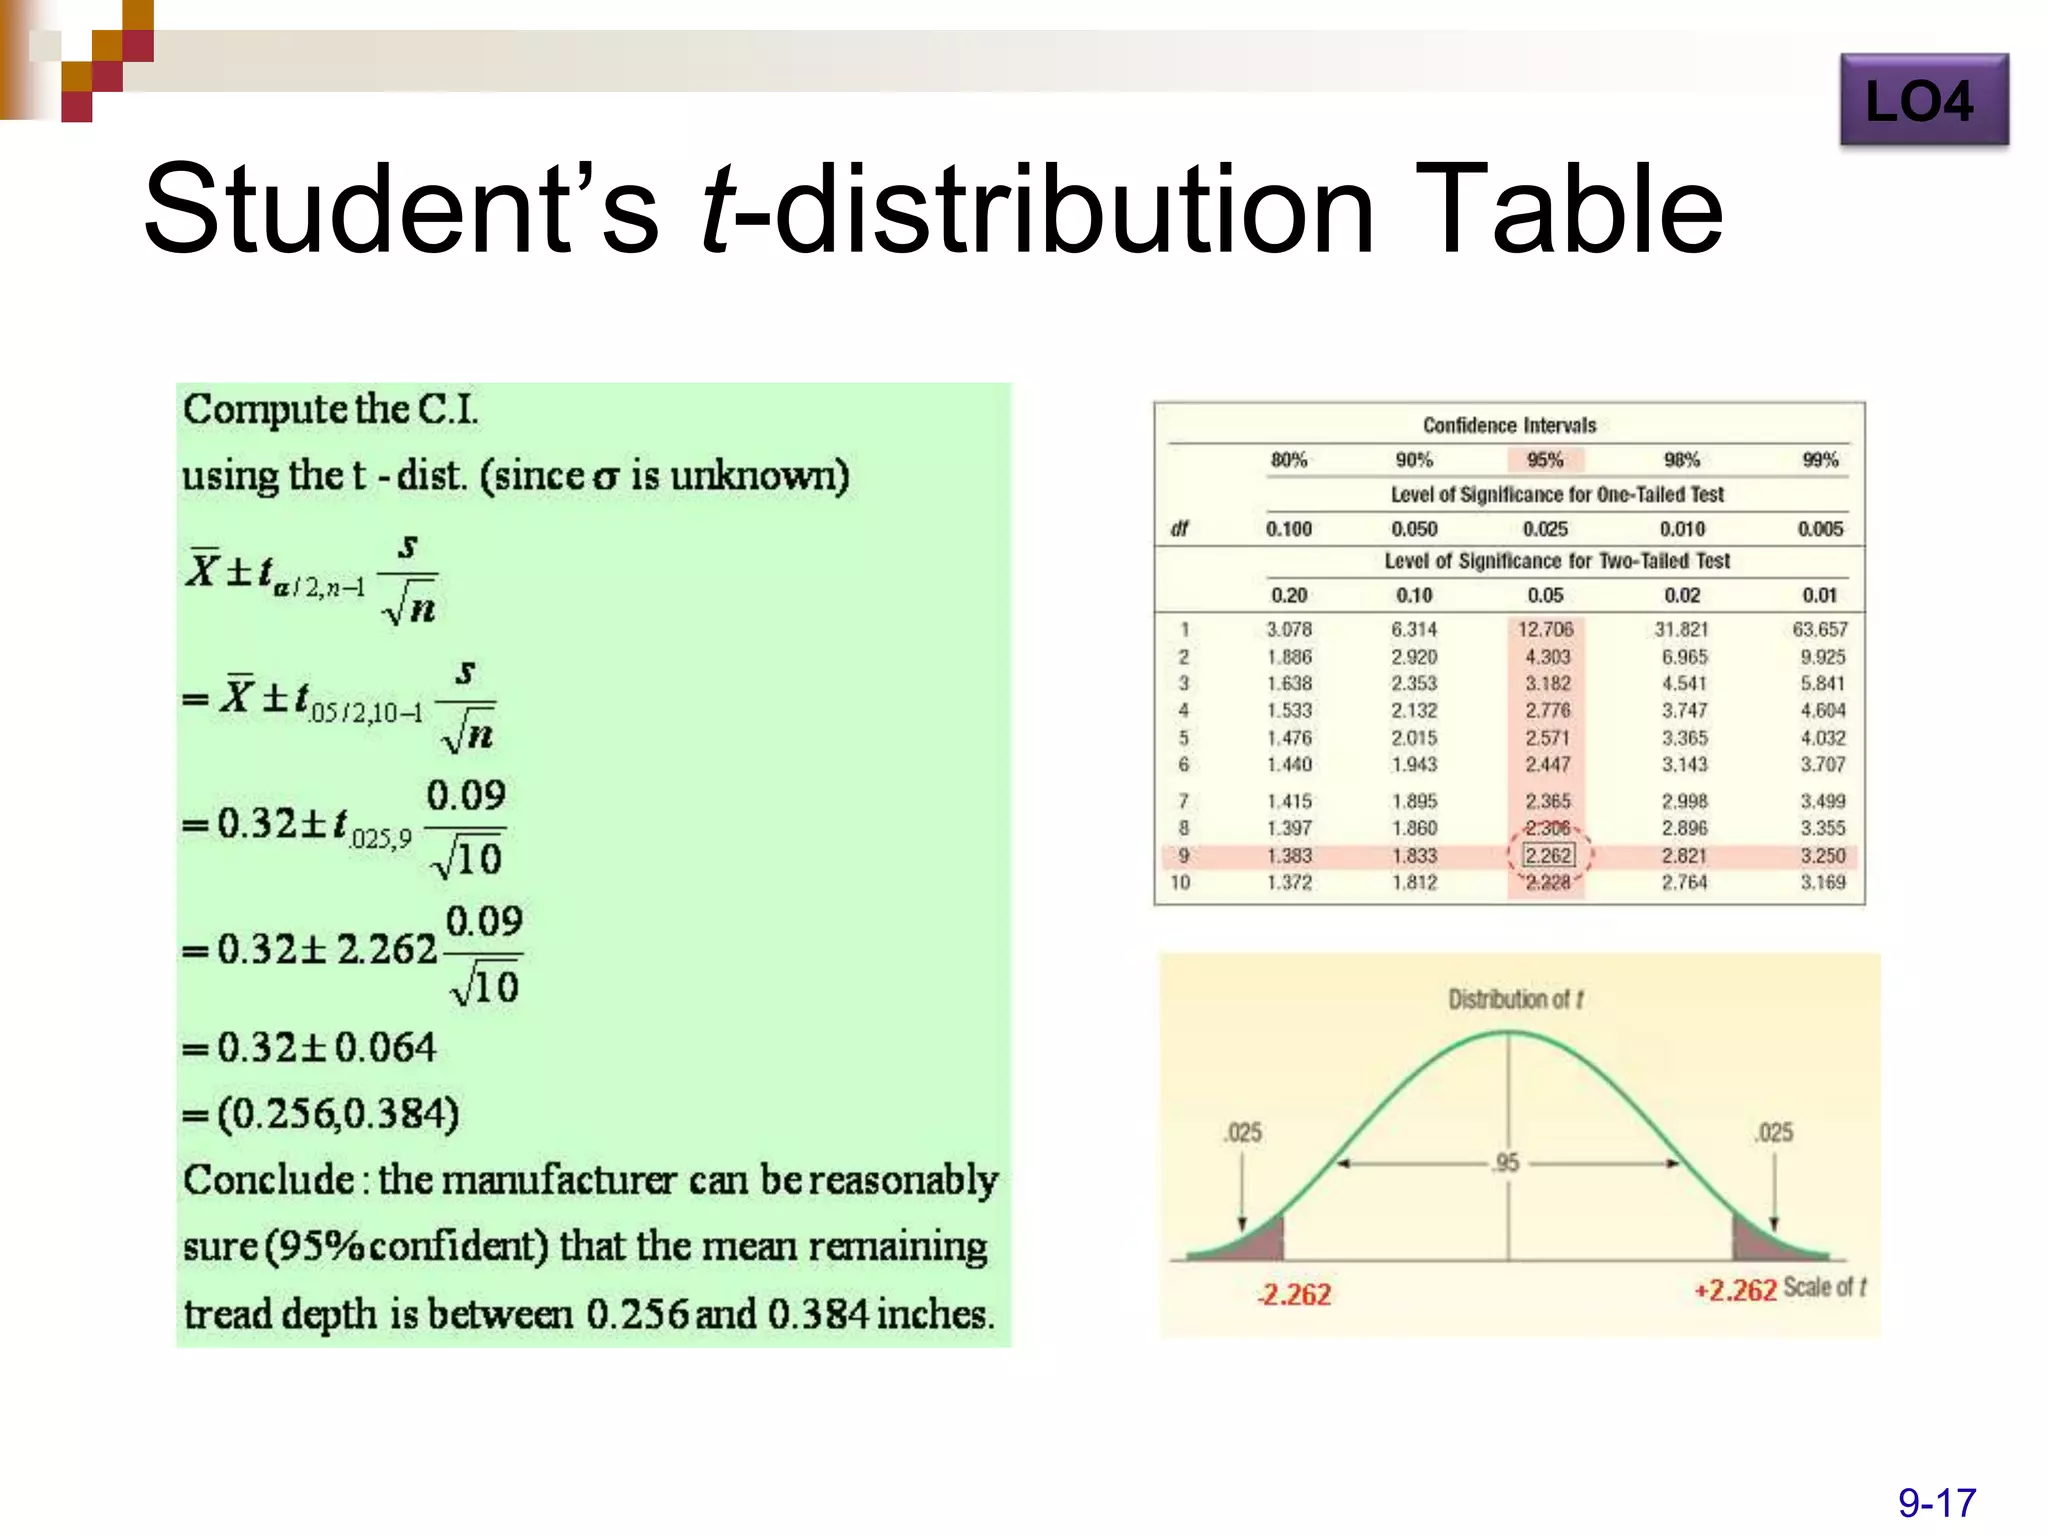
1) Given: n = 10, x = 0.32, s = 0.09
2) The degrees of freedom is n - 1 = 10 - 1 = 9
3) The t-value for a 95% CI with 9 df is t0.025,9 = 2.262 (from t-table)
4) The CI is: x ± t*s/√n = 0.32 ± 2.262*(0.09/√10) = 0.32 ± 0.029
5) The 95% CI is 0.291 to 0.349 inches
6) 0.30 inches is within the CI, so it would be


![Coded Agents – with UiPath SDK + LangGraph [Virtual Hands-on Workshop]](https://cdn.slidesharecdn.com/ss_thumbnails/codedagentsdeck-251215155422-5497c599-thumbnail.jpg?width=640&height=640&fit=bounds)


