Download as PDF, PPTX
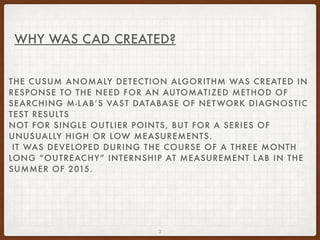


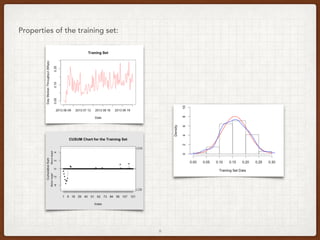
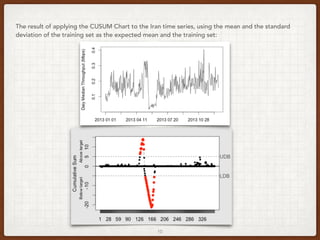


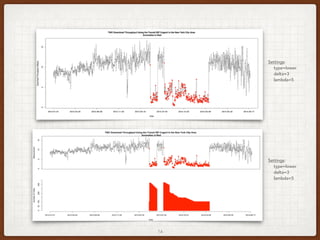

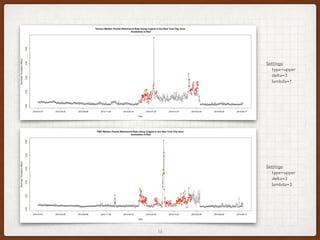


The CUSUM anomaly detection algorithm was created to automatically search a vast database of network diagnostic test results from M-Lab for series of unusually high or low measurements. It uses a CUSUM control chart with parameters like expected mean and standard deviation to detect anomalies. The CAD algorithm was implemented in R using a sliding window technique to apply CUSUM charts to subsets of time series data and detect potential anomalies, which are then output along with a graph of the annotated time series. It was tested on M-Lab data showing known anomalies with low false positive and negative rates. Future work aims to optimize parameters and make the method more scalable.


![FINAL [Autosaved]](https://cdn.slidesharecdn.com/ss_thumbnails/b9a0b6eb-416f-414c-9394-4d82d722293a-160830224353-thumbnail.jpg?width=640&height=640&fit=bounds)


![[DSC Europe 25] Ivica Milaric - The Future of Gaming and AI Tools.pptx](https://cdn.slidesharecdn.com/ss_thumbnails/tijgzsmgse2kj2y5pzzp-5-ivica-milaric-the-future-of-gaming-x-ai-tools-260114111931-87c2b3ac-thumbnail.jpg?width=640&height=640&fit=bounds)


![[DSC Europe 25] Nikola Vasiljevic - Player segmentation by combat playstyles ...](https://cdn.slidesharecdn.com/ss_thumbnails/mnvbf0yvrwaqsipzrrv3-2-nikola-vasiljevic-player-segmentation-by-playstyles-in-action-shooter-games-260114111931-b4d766cd-thumbnail.jpg?width=640&height=640&fit=bounds)


![[DSC Europe 25] Slobodan Dolinic - Smart and Intelligent Green Region.pptx](https://cdn.slidesharecdn.com/ss_thumbnails/0bribinjsp6ghwtvsvor-2-sigre-slobodan-dolinic-260115093812-c9c10e90-thumbnail.jpg?width=640&height=640&fit=bounds)