SlideShare a Scribd company logo
1 of 1
Download to read offline
MultiGaussianity Check
• Most popular simulation techniques are based on the
assumption of Multivariate Gaussianity.
• Normal Scores transform does not assure fulfilling of this
condition.
• In practice only bivariate Gaussianity is tested.
• The most common test consists of comparing the
experimental indicator direct variograms of the raw variable
with the direct indicator variograms derived from the
biGaussian distribution.
• But, what about the indicator cross variograms?, How do they
behave in relation to BiGaussianity?
Theoretical Framework
• A perfect biGaussian CDF is defined by the correlation function
of the continuous variable:
Where and are the standard normal
quantile threshold values with probabilities p and p’,
respectively.
• This is equivalent to the non-centered indicator cross-
covariance, :
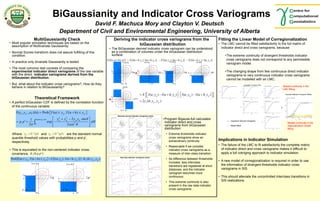
Fitting the Linear Model of Corregionalization
• The LMC cannot be fitted satisfactorily to the full matrix of
indicator direct and cross variograms, because:
•The extreme continuity of divergent thresholds indicator
cross variograms does not correspond to any permissible
variogram model.
•The changing shape from few continuous direct indicator
variograms to very continuous indicator cross variograms
cannot be modelled with an LMC.
Implications in Indicator Simulation
• The failure of the LMC to fit satisfactorily the complete matrix
of indicator direct and cross variograms makes it difficult to
apply a full cokriging approach to indicator simulation.
• A new model of corregionalization is required in order to use
the information of divergent thresholds indicator cross
variograms in SIS.
• This should alleviate the uncontrolled interclass transitions in
SIS realizations.
Deriving the indicator cross variograms from the
biGaussian distribution
• The BiGaussian derived indicator cross variogram can be understood
as a combination of volumes under the biGaussian distribution
surface:
BiGaussianity and Indicator Cross Variograms
David F. Machuca Mory and Clayton V. Deutsch
Department of Civil and Environmental Engineering, University of Alberta
 
2 2
arcsin ( )
20
F( , , ( )) Prob (u) , (u h)
2 sin1
. exp
2 2cos
Y
p p Y p p
h p p p p
y y h Y y Y y
y y y y
p p d




 
 
 
   
  
   
  

)(1
pGyp

 1
( )py G p
 
(h; , )IK p p
    ),;h();hu();u()hu(,uProb ppIpppp yyKyIyIEyYy)Y(  
),;h( ppI yyK 
{ ( ; ) ( ; )} { ( ; ) ( ; )} { ( ; ) ( ; )} { ( ; ) ( ; )}p p p p p pE I u p I u p E I u h y I u h y E I u y I u h y E I u h y I u y            
 ( ; ) ( ; ) ( ; ) ( ; )
2 ( ; , )
p p p p
I p p
E I u y I u h y I u y I u h y
h y y
 

           

• Program Bigauss-full calculates
indicator direct and cross
variograms from biGaussian
distribution:
• Extreme thresholds indicator
cross variograms show an
extraordinary continuity
• Reasonable if we consider
indicator cross variograms as a
measure of inter-class transition.
• As difference between thresholds
increase, less interclass
transitions are registered at short
distances, and the indicator
variogram becomes more
continuous.
• This extreme continuity is also
present in the raw data indicator
cross variograms),;h( ppI yyK 
Gaussian derived Indicator variograms matrix
Raw data indicator variograms matrix
Gaussian derived variogram
Model fitted
   
Missed continuity in the
LMC fitting
Missed continuity in the
regionalization model
fitting

More Related Content

Viewers also liked

Viewers also liked (7)

GRAVEDAD ESPECÍFICA Y ABSORCIÓN DE AGREGADO FINO
GRAVEDAD ESPECÍFICA Y ABSORCIÓN DE AGREGADO FINOGRAVEDAD ESPECÍFICA Y ABSORCIÓN DE AGREGADO FINO
GRAVEDAD ESPECÍFICA Y ABSORCIÓN DE AGREGADO FINO
 
APLICACIONES GEOESTADISTICA I -BARBARA PRADO
APLICACIONES GEOESTADISTICA I -BARBARA PRADOAPLICACIONES GEOESTADISTICA I -BARBARA PRADO
APLICACIONES GEOESTADISTICA I -BARBARA PRADO
 
PRIMER EXAMEN ACADEMIA BALDOR SOCIALES 2012
PRIMER EXAMEN ACADEMIA BALDOR SOCIALES 2012PRIMER EXAMEN ACADEMIA BALDOR SOCIALES 2012
PRIMER EXAMEN ACADEMIA BALDOR SOCIALES 2012
 
2 estimacion geoestadistica e jara codelco
2 estimacion geoestadistica    e jara   codelco2 estimacion geoestadistica    e jara   codelco
2 estimacion geoestadistica e jara codelco
 
DiplomaGIS_geoestadistica
DiplomaGIS_geoestadisticaDiplomaGIS_geoestadistica
DiplomaGIS_geoestadistica
 
RICE
RICERICE
RICE
 
CLASE 12 MAYO IPRYMA SIMULACRO PRUEBA
CLASE 12 MAYO IPRYMA SIMULACRO PRUEBACLASE 12 MAYO IPRYMA SIMULACRO PRUEBA
CLASE 12 MAYO IPRYMA SIMULACRO PRUEBA
 

Similar to Bi gaussianity and indicator variograms (2006)

Deriving and applying direct and cross indicator variograms in SIS (2006)
Deriving and applying direct and cross indicator variograms in SIS (2006)Deriving and applying direct and cross indicator variograms in SIS (2006)
Deriving and applying direct and cross indicator variograms in SIS (2006)David F. Machuca-Mory
 
Reporting.ppt
Reporting.pptReporting.ppt
Reporting.pptasodiatel
 
Conducting and reporting the results of a cfd simulation
Conducting and reporting the results of a cfd simulationConducting and reporting the results of a cfd simulation
Conducting and reporting the results of a cfd simulationMalik Abdul Wahab
 
Using the Componentwise Metropolis-Hastings Algorithm to Sample from the Join...
Using the Componentwise Metropolis-Hastings Algorithm to Sample from the Join...Using the Componentwise Metropolis-Hastings Algorithm to Sample from the Join...
Using the Componentwise Metropolis-Hastings Algorithm to Sample from the Join...Thomas Templin
 
(K 10619) krishna murari yadav (mel-312)[mech. measurment control theory &amp...
(K 10619) krishna murari yadav (mel-312)[mech. measurment control theory &amp...(K 10619) krishna murari yadav (mel-312)[mech. measurment control theory &amp...
(K 10619) krishna murari yadav (mel-312)[mech. measurment control theory &amp...9261672891
 
Modified hotelling’s 푻 ퟐ control charts using modified mahalanobis distance
Modified hotelling’s 푻 ퟐ  control charts using modified mahalanobis distance Modified hotelling’s 푻 ퟐ  control charts using modified mahalanobis distance
Modified hotelling’s 푻 ퟐ control charts using modified mahalanobis distance IJECEIAES
 
Forecasting Default Probabilities in Emerging Markets and Dynamical Regula...
Forecasting Default Probabilities  in Emerging Markets and   Dynamical Regula...Forecasting Default Probabilities  in Emerging Markets and   Dynamical Regula...
Forecasting Default Probabilities in Emerging Markets and Dynamical Regula...SSA KPI
 
Regression kriging
Regression krigingRegression kriging
Regression krigingFAO
 
High-Dimensional Network Estimation using ECL
High-Dimensional Network Estimation using ECLHigh-Dimensional Network Estimation using ECL
High-Dimensional Network Estimation using ECLHPCC Systems
 
Variation Graphs and Structural Variation
Variation Graphs and Structural VariationVariation Graphs and Structural Variation
Variation Graphs and Structural VariationEric Dawson
 
various methods for image segmentation
various methods for image segmentationvarious methods for image segmentation
various methods for image segmentationRaveesh Methi
 
604_multiplee.ppt
604_multiplee.ppt604_multiplee.ppt
604_multiplee.pptRufesh
 
Basic geostatistics
Basic geostatisticsBasic geostatistics
Basic geostatisticsSerdar Kaya
 
Partha Sengupta_structural analysis.pptx
Partha Sengupta_structural analysis.pptxPartha Sengupta_structural analysis.pptx
Partha Sengupta_structural analysis.pptxJimmyPhoenix2
 
Spherical Clustering of users navigating in VR content
Spherical Clustering of users navigating  in VR contentSpherical Clustering of users navigating  in VR content
Spherical Clustering of users navigating in VR contentSilvia Rossi
 
Exploring Simple Siamese Representation Learning
Exploring Simple Siamese Representation LearningExploring Simple Siamese Representation Learning
Exploring Simple Siamese Representation LearningSungchul Kim
 
Lec16: Medical Image Registration (Advanced): Deformable Registration
Lec16: Medical Image Registration (Advanced): Deformable RegistrationLec16: Medical Image Registration (Advanced): Deformable Registration
Lec16: Medical Image Registration (Advanced): Deformable RegistrationUlaş Bağcı
 

Similar to Bi gaussianity and indicator variograms (2006) (20)

Deriving and applying direct and cross indicator variograms in SIS (2006)
Deriving and applying direct and cross indicator variograms in SIS (2006)Deriving and applying direct and cross indicator variograms in SIS (2006)
Deriving and applying direct and cross indicator variograms in SIS (2006)
 
Reporting.ppt
Reporting.pptReporting.ppt
Reporting.ppt
 
Conducting and reporting the results of a cfd simulation
Conducting and reporting the results of a cfd simulationConducting and reporting the results of a cfd simulation
Conducting and reporting the results of a cfd simulation
 
Linear regression analysis
Linear regression analysisLinear regression analysis
Linear regression analysis
 
Using the Componentwise Metropolis-Hastings Algorithm to Sample from the Join...
Using the Componentwise Metropolis-Hastings Algorithm to Sample from the Join...Using the Componentwise Metropolis-Hastings Algorithm to Sample from the Join...
Using the Componentwise Metropolis-Hastings Algorithm to Sample from the Join...
 
(K 10619) krishna murari yadav (mel-312)[mech. measurment control theory &amp...
(K 10619) krishna murari yadav (mel-312)[mech. measurment control theory &amp...(K 10619) krishna murari yadav (mel-312)[mech. measurment control theory &amp...
(K 10619) krishna murari yadav (mel-312)[mech. measurment control theory &amp...
 
Modified hotelling’s 푻 ퟐ control charts using modified mahalanobis distance
Modified hotelling’s 푻 ퟐ  control charts using modified mahalanobis distance Modified hotelling’s 푻 ퟐ  control charts using modified mahalanobis distance
Modified hotelling’s 푻 ퟐ control charts using modified mahalanobis distance
 
Forecasting Default Probabilities in Emerging Markets and Dynamical Regula...
Forecasting Default Probabilities  in Emerging Markets and   Dynamical Regula...Forecasting Default Probabilities  in Emerging Markets and   Dynamical Regula...
Forecasting Default Probabilities in Emerging Markets and Dynamical Regula...
 
Regression kriging
Regression krigingRegression kriging
Regression kriging
 
High-Dimensional Network Estimation using ECL
High-Dimensional Network Estimation using ECLHigh-Dimensional Network Estimation using ECL
High-Dimensional Network Estimation using ECL
 
Variation Graphs and Structural Variation
Variation Graphs and Structural VariationVariation Graphs and Structural Variation
Variation Graphs and Structural Variation
 
Climate Extremes Workshop - Assessing models for estimation and methods for u...
Climate Extremes Workshop - Assessing models for estimation and methods for u...Climate Extremes Workshop - Assessing models for estimation and methods for u...
Climate Extremes Workshop - Assessing models for estimation and methods for u...
 
various methods for image segmentation
various methods for image segmentationvarious methods for image segmentation
various methods for image segmentation
 
MUMS: Transition & SPUQ Workshop - Gradient-Free Construction of Active Subsp...
MUMS: Transition & SPUQ Workshop - Gradient-Free Construction of Active Subsp...MUMS: Transition & SPUQ Workshop - Gradient-Free Construction of Active Subsp...
MUMS: Transition & SPUQ Workshop - Gradient-Free Construction of Active Subsp...
 
604_multiplee.ppt
604_multiplee.ppt604_multiplee.ppt
604_multiplee.ppt
 
Basic geostatistics
Basic geostatisticsBasic geostatistics
Basic geostatistics
 
Partha Sengupta_structural analysis.pptx
Partha Sengupta_structural analysis.pptxPartha Sengupta_structural analysis.pptx
Partha Sengupta_structural analysis.pptx
 
Spherical Clustering of users navigating in VR content
Spherical Clustering of users navigating  in VR contentSpherical Clustering of users navigating  in VR content
Spherical Clustering of users navigating in VR content
 
Exploring Simple Siamese Representation Learning
Exploring Simple Siamese Representation LearningExploring Simple Siamese Representation Learning
Exploring Simple Siamese Representation Learning
 
Lec16: Medical Image Registration (Advanced): Deformable Registration
Lec16: Medical Image Registration (Advanced): Deformable RegistrationLec16: Medical Image Registration (Advanced): Deformable Registration
Lec16: Medical Image Registration (Advanced): Deformable Registration
 

Recently uploaded

Artificial intelligence in the post-deep learning era
Artificial intelligence in the post-deep learning eraArtificial intelligence in the post-deep learning era
Artificial intelligence in the post-deep learning eraDeakin University
 
Azure Monitor & Application Insight to monitor Infrastructure & Application
Azure Monitor & Application Insight to monitor Infrastructure & ApplicationAzure Monitor & Application Insight to monitor Infrastructure & Application
Azure Monitor & Application Insight to monitor Infrastructure & ApplicationAndikSusilo4
 
Human Factors of XR: Using Human Factors to Design XR Systems
Human Factors of XR: Using Human Factors to Design XR SystemsHuman Factors of XR: Using Human Factors to Design XR Systems
Human Factors of XR: Using Human Factors to Design XR SystemsMark Billinghurst
 
Integration and Automation in Practice: CI/CD in Mule Integration and Automat...
Integration and Automation in Practice: CI/CD in Mule Integration and Automat...Integration and Automation in Practice: CI/CD in Mule Integration and Automat...
Integration and Automation in Practice: CI/CD in Mule Integration and Automat...Patryk Bandurski
 
08448380779 Call Girls In Civil Lines Women Seeking Men
08448380779 Call Girls In Civil Lines Women Seeking Men08448380779 Call Girls In Civil Lines Women Seeking Men
08448380779 Call Girls In Civil Lines Women Seeking MenDelhi Call girls
 
Breaking the Kubernetes Kill Chain: Host Path Mount
Breaking the Kubernetes Kill Chain: Host Path MountBreaking the Kubernetes Kill Chain: Host Path Mount
Breaking the Kubernetes Kill Chain: Host Path MountPuma Security, LLC
 
Swan(sea) Song – personal research during my six years at Swansea ... and bey...
Swan(sea) Song – personal research during my six years at Swansea ... and bey...Swan(sea) Song – personal research during my six years at Swansea ... and bey...
Swan(sea) Song – personal research during my six years at Swansea ... and bey...Alan Dix
 
Presentation on how to chat with PDF using ChatGPT code interpreter
Presentation on how to chat with PDF using ChatGPT code interpreterPresentation on how to chat with PDF using ChatGPT code interpreter
Presentation on how to chat with PDF using ChatGPT code interpreternaman860154
 
FULL ENJOY 🔝 8264348440 🔝 Call Girls in Diplomatic Enclave | Delhi
FULL ENJOY 🔝 8264348440 🔝 Call Girls in Diplomatic Enclave | DelhiFULL ENJOY 🔝 8264348440 🔝 Call Girls in Diplomatic Enclave | Delhi
FULL ENJOY 🔝 8264348440 🔝 Call Girls in Diplomatic Enclave | Delhisoniya singh
 
Key Features Of Token Development (1).pptx
Key  Features Of Token  Development (1).pptxKey  Features Of Token  Development (1).pptx
Key Features Of Token Development (1).pptxLBM Solutions
 
SIEMENS: RAPUNZEL – A Tale About Knowledge Graph
SIEMENS: RAPUNZEL – A Tale About Knowledge GraphSIEMENS: RAPUNZEL – A Tale About Knowledge Graph
SIEMENS: RAPUNZEL – A Tale About Knowledge GraphNeo4j
 
IAC 2024 - IA Fast Track to Search Focused AI Solutions
IAC 2024 - IA Fast Track to Search Focused AI SolutionsIAC 2024 - IA Fast Track to Search Focused AI Solutions
IAC 2024 - IA Fast Track to Search Focused AI SolutionsEnterprise Knowledge
 
My Hashitalk Indonesia April 2024 Presentation
My Hashitalk Indonesia April 2024 PresentationMy Hashitalk Indonesia April 2024 Presentation
My Hashitalk Indonesia April 2024 PresentationRidwan Fadjar
 
08448380779 Call Girls In Greater Kailash - I Women Seeking Men
08448380779 Call Girls In Greater Kailash - I Women Seeking Men08448380779 Call Girls In Greater Kailash - I Women Seeking Men
08448380779 Call Girls In Greater Kailash - I Women Seeking MenDelhi Call girls
 
AI as an Interface for Commercial Buildings
AI as an Interface for Commercial BuildingsAI as an Interface for Commercial Buildings
AI as an Interface for Commercial BuildingsMemoori
 
GenCyber Cyber Security Day Presentation
GenCyber Cyber Security Day PresentationGenCyber Cyber Security Day Presentation
GenCyber Cyber Security Day PresentationMichael W. Hawkins
 
#StandardsGoals for 2024: What’s new for BISAC - Tech Forum 2024
#StandardsGoals for 2024: What’s new for BISAC - Tech Forum 2024#StandardsGoals for 2024: What’s new for BISAC - Tech Forum 2024
#StandardsGoals for 2024: What’s new for BISAC - Tech Forum 2024BookNet Canada
 
CloudStudio User manual (basic edition):
CloudStudio User manual (basic edition):CloudStudio User manual (basic edition):
CloudStudio User manual (basic edition):comworks
 

Recently uploaded (20)

Artificial intelligence in the post-deep learning era
Artificial intelligence in the post-deep learning eraArtificial intelligence in the post-deep learning era
Artificial intelligence in the post-deep learning era
 
Azure Monitor & Application Insight to monitor Infrastructure & Application
Azure Monitor & Application Insight to monitor Infrastructure & ApplicationAzure Monitor & Application Insight to monitor Infrastructure & Application
Azure Monitor & Application Insight to monitor Infrastructure & Application
 
The transition to renewables in India.pdf
The transition to renewables in India.pdfThe transition to renewables in India.pdf
The transition to renewables in India.pdf
 
Human Factors of XR: Using Human Factors to Design XR Systems
Human Factors of XR: Using Human Factors to Design XR SystemsHuman Factors of XR: Using Human Factors to Design XR Systems
Human Factors of XR: Using Human Factors to Design XR Systems
 
Integration and Automation in Practice: CI/CD in Mule Integration and Automat...
Integration and Automation in Practice: CI/CD in Mule Integration and Automat...Integration and Automation in Practice: CI/CD in Mule Integration and Automat...
Integration and Automation in Practice: CI/CD in Mule Integration and Automat...
 
08448380779 Call Girls In Civil Lines Women Seeking Men
08448380779 Call Girls In Civil Lines Women Seeking Men08448380779 Call Girls In Civil Lines Women Seeking Men
08448380779 Call Girls In Civil Lines Women Seeking Men
 
Breaking the Kubernetes Kill Chain: Host Path Mount
Breaking the Kubernetes Kill Chain: Host Path MountBreaking the Kubernetes Kill Chain: Host Path Mount
Breaking the Kubernetes Kill Chain: Host Path Mount
 
Swan(sea) Song – personal research during my six years at Swansea ... and bey...
Swan(sea) Song – personal research during my six years at Swansea ... and bey...Swan(sea) Song – personal research during my six years at Swansea ... and bey...
Swan(sea) Song – personal research during my six years at Swansea ... and bey...
 
Presentation on how to chat with PDF using ChatGPT code interpreter
Presentation on how to chat with PDF using ChatGPT code interpreterPresentation on how to chat with PDF using ChatGPT code interpreter
Presentation on how to chat with PDF using ChatGPT code interpreter
 
FULL ENJOY 🔝 8264348440 🔝 Call Girls in Diplomatic Enclave | Delhi
FULL ENJOY 🔝 8264348440 🔝 Call Girls in Diplomatic Enclave | DelhiFULL ENJOY 🔝 8264348440 🔝 Call Girls in Diplomatic Enclave | Delhi
FULL ENJOY 🔝 8264348440 🔝 Call Girls in Diplomatic Enclave | Delhi
 
Key Features Of Token Development (1).pptx
Key  Features Of Token  Development (1).pptxKey  Features Of Token  Development (1).pptx
Key Features Of Token Development (1).pptx
 
SIEMENS: RAPUNZEL – A Tale About Knowledge Graph
SIEMENS: RAPUNZEL – A Tale About Knowledge GraphSIEMENS: RAPUNZEL – A Tale About Knowledge Graph
SIEMENS: RAPUNZEL – A Tale About Knowledge Graph
 
IAC 2024 - IA Fast Track to Search Focused AI Solutions
IAC 2024 - IA Fast Track to Search Focused AI SolutionsIAC 2024 - IA Fast Track to Search Focused AI Solutions
IAC 2024 - IA Fast Track to Search Focused AI Solutions
 
My Hashitalk Indonesia April 2024 Presentation
My Hashitalk Indonesia April 2024 PresentationMy Hashitalk Indonesia April 2024 Presentation
My Hashitalk Indonesia April 2024 Presentation
 
08448380779 Call Girls In Greater Kailash - I Women Seeking Men
08448380779 Call Girls In Greater Kailash - I Women Seeking Men08448380779 Call Girls In Greater Kailash - I Women Seeking Men
08448380779 Call Girls In Greater Kailash - I Women Seeking Men
 
E-Vehicle_Hacking_by_Parul Sharma_null_owasp.pptx
E-Vehicle_Hacking_by_Parul Sharma_null_owasp.pptxE-Vehicle_Hacking_by_Parul Sharma_null_owasp.pptx
E-Vehicle_Hacking_by_Parul Sharma_null_owasp.pptx
 
AI as an Interface for Commercial Buildings
AI as an Interface for Commercial BuildingsAI as an Interface for Commercial Buildings
AI as an Interface for Commercial Buildings
 
GenCyber Cyber Security Day Presentation
GenCyber Cyber Security Day PresentationGenCyber Cyber Security Day Presentation
GenCyber Cyber Security Day Presentation
 
#StandardsGoals for 2024: What’s new for BISAC - Tech Forum 2024
#StandardsGoals for 2024: What’s new for BISAC - Tech Forum 2024#StandardsGoals for 2024: What’s new for BISAC - Tech Forum 2024
#StandardsGoals for 2024: What’s new for BISAC - Tech Forum 2024
 
CloudStudio User manual (basic edition):
CloudStudio User manual (basic edition):CloudStudio User manual (basic edition):
CloudStudio User manual (basic edition):
 

Bi gaussianity and indicator variograms (2006)

  • 1. MultiGaussianity Check • Most popular simulation techniques are based on the assumption of Multivariate Gaussianity. • Normal Scores transform does not assure fulfilling of this condition. • In practice only bivariate Gaussianity is tested. • The most common test consists of comparing the experimental indicator direct variograms of the raw variable with the direct indicator variograms derived from the biGaussian distribution. • But, what about the indicator cross variograms?, How do they behave in relation to BiGaussianity? Theoretical Framework • A perfect biGaussian CDF is defined by the correlation function of the continuous variable: Where and are the standard normal quantile threshold values with probabilities p and p’, respectively. • This is equivalent to the non-centered indicator cross- covariance, : Fitting the Linear Model of Corregionalization • The LMC cannot be fitted satisfactorily to the full matrix of indicator direct and cross variograms, because: •The extreme continuity of divergent thresholds indicator cross variograms does not correspond to any permissible variogram model. •The changing shape from few continuous direct indicator variograms to very continuous indicator cross variograms cannot be modelled with an LMC. Implications in Indicator Simulation • The failure of the LMC to fit satisfactorily the complete matrix of indicator direct and cross variograms makes it difficult to apply a full cokriging approach to indicator simulation. • A new model of corregionalization is required in order to use the information of divergent thresholds indicator cross variograms in SIS. • This should alleviate the uncontrolled interclass transitions in SIS realizations. Deriving the indicator cross variograms from the biGaussian distribution • The BiGaussian derived indicator cross variogram can be understood as a combination of volumes under the biGaussian distribution surface: BiGaussianity and Indicator Cross Variograms David F. Machuca Mory and Clayton V. Deutsch Department of Civil and Environmental Engineering, University of Alberta   2 2 arcsin ( ) 20 F( , , ( )) Prob (u) , (u h) 2 sin1 . exp 2 2cos Y p p Y p p h p p p p y y h Y y Y y y y y y p p d                          )(1 pGyp   1 ( )py G p   (h; , )IK p p     ),;h();hu();u()hu(,uProb ppIpppp yyKyIyIEyYy)Y(   ),;h( ppI yyK  { ( ; ) ( ; )} { ( ; ) ( ; )} { ( ; ) ( ; )} { ( ; ) ( ; )}p p p p p pE I u p I u p E I u h y I u h y E I u y I u h y E I u h y I u y              ( ; ) ( ; ) ( ; ) ( ; ) 2 ( ; , ) p p p p I p p E I u y I u h y I u y I u h y h y y                 • Program Bigauss-full calculates indicator direct and cross variograms from biGaussian distribution: • Extreme thresholds indicator cross variograms show an extraordinary continuity • Reasonable if we consider indicator cross variograms as a measure of inter-class transition. • As difference between thresholds increase, less interclass transitions are registered at short distances, and the indicator variogram becomes more continuous. • This extreme continuity is also present in the raw data indicator cross variograms),;h( ppI yyK  Gaussian derived Indicator variograms matrix Raw data indicator variograms matrix Gaussian derived variogram Model fitted     Missed continuity in the LMC fitting Missed continuity in the regionalization model fitting