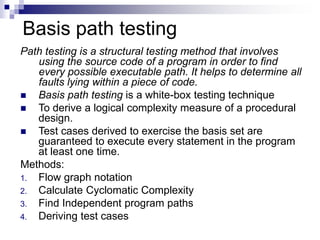
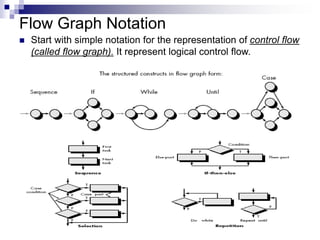
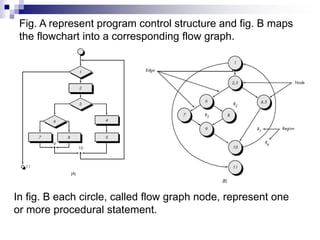
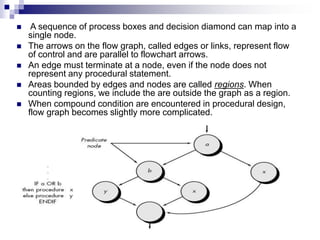
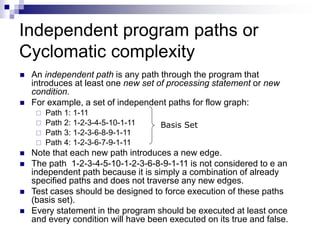
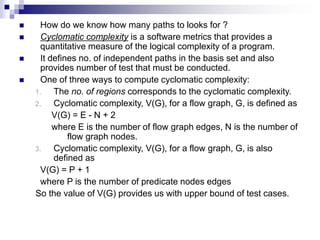
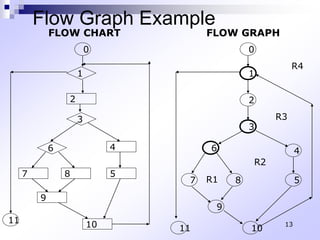
White Box Testing
White box testing
 White-box testing of software includes close examination
of procedural detail.
 Logical paths through the software are tested by
providing test cases that exercise specific sets of
conditions and/or loops.
 The "status of the program" may be examined at various
points.
 White-box testing, sometimes called glass-box testing, is
a test case design method that uses the control structure
of the procedural design to derive test cases.
White box testing
Using this method, we can derive test cases that
1. Guarantee that all independent paths within a
module have been exercised at least once
2. Exercise all logical decisions on their true and
false sides,
3. Execute all loops at their boundaries and within
their operational bounds
4. Exercise internal data structures to ensure their
validity.
Basis path testing
Path testing is a structural testing method that involves
using the source code of a program in order to find
every possible executable path. It helps to determine all
faults lying within a piece of code.
 Basis path testing is a white-box testing technique
 To derive a logical complexity measure of a procedural
design.
 Test cases derived to exercise the basis set are
guaranteed to execute every statement in the program
at least one time.
Methods:
1. Flow graph notation
2. Calculate Cyclomatic Complexity
3. Find Independent program paths
4. Deriving test cases
Flow Graph Notation
 Start with simple notation for the representation of control flow
(called flow graph). It represent logical control flow.
Fig. A represent program control structure and fig. B maps
the flowchart into a corresponding flow graph.
In fig. B each circle, called flow graph node, represent one
or more procedural statement.
 A sequence of process boxes and decision diamond can map into a
single node.
 The arrows on the flow graph, called edges or links, represent flow
of control and are parallel to flowchart arrows.
 An edge must terminate at a node, even if the node does not
represent any procedural statement.
 Areas bounded by edges and nodes are called regions. When
counting regions, we include the are outside the graph as a region.
 When compound condition are encountered in procedural design,
flow graph becomes slightly more complicated.
 When we translating procudural segment
into flow graph, separate node is created
for each condition.
 Each node that contains a condition is
called predicate node and is characterized
by two or more edges comes from it.
Independent program paths or
Cyclomatic complexity
 An independent path is any path through the program that
introduces at least one new set of processing statement or new
condition.
 For example, a set of independent paths for flow graph:
 Path 1: 1-11
 Path 2: 1-2-3-4-5-10-1-11
 Path 3: 1-2-3-6-8-9-1-11
 Path 4: 1-2-3-6-7-9-1-11
 Note that each new path introduces a new edge.
 The path 1-2-3-4-5-10-1-2-3-6-8-9-1-11 is not considered to e an
independent path because it is simply a combination of already
specified paths and does not traverse any new edges.
 Test cases should be designed to force execution of these paths
(basis set).
 Every statement in the program should be executed at least once
and every condition will have been executed on its true and false.
Basis Set
 How do we know how many paths to looks for ?
 Cyclomatic complexity is a software metrics that provides a
quantitative measure of the logical complexity of a program.
 It defines no. of independent paths in the basis set and also
provides number of test that must be conducted.
 One of three ways to compute cyclomatic complexity:
1. The no. of regions corresponds to the cyclomatic complexity.
2. Cyclomatic complexity, V(G), for a flow graph, G, is defined as
V(G) = E - N + 2
where E is the number of flow graph edges, N is the number of
flow graph nodes.
3. Cyclomatic complexity, V(G), for a flow graph, G, is also
defined as
V(G) = P + 1
where P is the number of predicate nodes edges
So the value of V(G) provides us with upper bound of test cases.
Use of Cyclomatic Complexity:
Determining the independent path executions thus proven to be very
helpful for Developers and Testers.
It can make sure that every path have been tested at least once.
Thus help to focus more on uncovered paths.
Code coverage can be improved.
Risk associated with program can be evaluated.
These metrics being used earlier in the program helps in reducing the
risks.
Advantages of Cyclomatic Complexity:.
It can be used as a quality metric, gives relative complexity of various
designs.
It is able to compute faster than the Halstead’s metrics.
It is used to measure the minimum effort and best areas of
concentration for testing.
It is able to guide the testing process.
It is easy to apply.
Disadvantages of Cyclomatic Complexity:
It is the measure of the programs’s control complexity and not the data
the data complexity.
In this, nested conditional structures are harder to understand than
non-nested structures.
In case of simple comparisons and decision strucures, it may give a
misleading figure.
13
Flow Graph Example
1
2
0
3
4
5
6
7 8
9
10
11
1
2
3
4
6
7 8 5
9
10
11
R1
R2
R3
R4
FLOW CHART FLOW GRAPH
0
Deriving Test Cases
 It is a series of steps method.
 The procedure average depicted.
 Average, an extremely simple algorithm, contains
compound conditions and loops.
To derive basis set, follow the steps.
1. Using the design or code as a foundation, draw a
corresponding flow graph.
 A flow graph is created by numbering those PDL statements that
will be mapped into corresponding flow graph nodes.
Deriving Test Cases
Flow graph for the procedure average
2. Determine the cyclomatic complexity of the resultant flow
graph.
2. V(G) can be determined without developing a flow graph by counting
all conditional statements in the PDL (for the procedure average,
compound conditions count as two) and adding 1
3. V(G) = 6 regions
4. V(G) = 17 edges - 13 nodes + 2 = 6
5. V(G) = 5 predicate nodes + 1 = 6
3. Determine a basis set of linearly independent paths
3. The value of V(G) provides the number of linearly independent paths
through the program control structure.
4. path 1: 1-2-10-11-13
5. path 2: 1-2-10-12-13
6. path 3: 1-2-3-10-11-13
7. path 4: 1-2-3-4-5-8-9-2-. . .
8. path 5: 1-2-3-4-5-6-8-9-2-. . .
9. path 6: 1-2-3-4-5-6-7-8-9-2-. . .
10. The ellipsis (. . .) following paths 4, 5, and 6 indicates that any path
through the remainder of the control structure is acceptable.
4. Prepare test cases that will force execution
of each path in the basis set.
 Data should be chosen so that conditions at the
predicate nodes are appropriately set as each path
is tested.
 Each test case is executed and compared to
expected results.
 Once all test cases have been completed, the tester
can be sure that all statements in the program have
been executed at least once.
19
Create flow graph ,generate cyclomatic complexity and
find test cases 1 int functionZ(int y)
2 {
3 int x = 0;
4 while (x <= (y * y))
5 {
6 if ((x % 11 == 0) &&
7 (x % y == 0))
8 {
9 printf(“%d”, x);
10 x++;
11 } // End if
12 else if ((x % 7 == 0) ||
13 (x % y == 1))
14 {
15 printf(“%d”, y);
16 x = x + 2;
} // End else
18 printf(“n”);
19 } // End while
20 printf("End of listn");
21 return 0;
22 } // End functionZ
20
A Sample Function to Diagram and
Analyze
1 int functionZ(int y)
2 {
3 int x = 0;
4 while (x <= (y * y))
5 {
6 if ((x % 11 == 0) &&
7 (x % y == 0))
8 {
9 printf(“%d”, x);
10 x++;
11 } // End if
12 else if ((x % 7 == 0) ||
13 (x % y == 1))
14 {
15 printf(“%d”, y);
16 x = x + 2;
} // End else
18 printf(“n”);
19 } // End while
20 printf("End of listn");
21 return 0;
22 } // End functionZ
3
4
6 7
9
10
12 13
15
16
18
20
21
 3,4 20 ,21
 3,4,6,12,15,16,18,4,20,21
 3,4,6,12,13,15,16,18,…
 3,4,6,7,12,15,16,18,…
 3,4,6,7,12,13,18,…
 3,4,6,7,9,10,18
Graph Matrices
 A graph matrix is a square matrix whose size (i.e., number of rows
and columns) is equal to the number of nodes on the flow graph.
 Each row and column corresponds to an identified node, and matrix
entries correspond to connections (an edge) between nodes.
 Each node on the flow graph is identify by numbers, while each
edge is identify by letters.
 The graph matrix is nothing more than a tabular representation of a
flow graph.
 By adding a link weight to each matrix entry, the graph matrix can
become a powerful tool for evaluating program control structure
during testing.
 The link weight provides additional information about control flow. In
its simplest form, the link weight is 1 (a connection exists) or 0 (a
connection does not exist).
Connection matrix
 Each letter has been replaced with a 1,
indicating that a connection exists (this graph
matrix is called a connection matrix).
 In fig.( connection matrix) each row with two or
more entries represents a predicate node.
 We can directly measure cyclomatic complexity
value by performing arithmetic operations
 Connections = Each row Total no. of entries – 1.
 V(G)= Sum of all connections + 1

7-White Box Testing.ppt

  • 1.
  • 2.
    White box testing White-box testing of software includes close examination of procedural detail.  Logical paths through the software are tested by providing test cases that exercise specific sets of conditions and/or loops.  The "status of the program" may be examined at various points.  White-box testing, sometimes called glass-box testing, is a test case design method that uses the control structure of the procedural design to derive test cases.
  • 3.
    White box testing Usingthis method, we can derive test cases that 1. Guarantee that all independent paths within a module have been exercised at least once 2. Exercise all logical decisions on their true and false sides, 3. Execute all loops at their boundaries and within their operational bounds 4. Exercise internal data structures to ensure their validity.
  • 4.
    Basis path testing Pathtesting is a structural testing method that involves using the source code of a program in order to find every possible executable path. It helps to determine all faults lying within a piece of code.  Basis path testing is a white-box testing technique  To derive a logical complexity measure of a procedural design.  Test cases derived to exercise the basis set are guaranteed to execute every statement in the program at least one time. Methods: 1. Flow graph notation 2. Calculate Cyclomatic Complexity 3. Find Independent program paths 4. Deriving test cases
  • 5.
    Flow Graph Notation Start with simple notation for the representation of control flow (called flow graph). It represent logical control flow.
  • 6.
    Fig. A representprogram control structure and fig. B maps the flowchart into a corresponding flow graph. In fig. B each circle, called flow graph node, represent one or more procedural statement.
  • 7.
     A sequenceof process boxes and decision diamond can map into a single node.  The arrows on the flow graph, called edges or links, represent flow of control and are parallel to flowchart arrows.  An edge must terminate at a node, even if the node does not represent any procedural statement.  Areas bounded by edges and nodes are called regions. When counting regions, we include the are outside the graph as a region.  When compound condition are encountered in procedural design, flow graph becomes slightly more complicated.
  • 8.
     When wetranslating procudural segment into flow graph, separate node is created for each condition.  Each node that contains a condition is called predicate node and is characterized by two or more edges comes from it.
  • 9.
    Independent program pathsor Cyclomatic complexity  An independent path is any path through the program that introduces at least one new set of processing statement or new condition.  For example, a set of independent paths for flow graph:  Path 1: 1-11  Path 2: 1-2-3-4-5-10-1-11  Path 3: 1-2-3-6-8-9-1-11  Path 4: 1-2-3-6-7-9-1-11  Note that each new path introduces a new edge.  The path 1-2-3-4-5-10-1-2-3-6-8-9-1-11 is not considered to e an independent path because it is simply a combination of already specified paths and does not traverse any new edges.  Test cases should be designed to force execution of these paths (basis set).  Every statement in the program should be executed at least once and every condition will have been executed on its true and false. Basis Set
  • 10.
     How dowe know how many paths to looks for ?  Cyclomatic complexity is a software metrics that provides a quantitative measure of the logical complexity of a program.  It defines no. of independent paths in the basis set and also provides number of test that must be conducted.  One of three ways to compute cyclomatic complexity: 1. The no. of regions corresponds to the cyclomatic complexity. 2. Cyclomatic complexity, V(G), for a flow graph, G, is defined as V(G) = E - N + 2 where E is the number of flow graph edges, N is the number of flow graph nodes. 3. Cyclomatic complexity, V(G), for a flow graph, G, is also defined as V(G) = P + 1 where P is the number of predicate nodes edges So the value of V(G) provides us with upper bound of test cases.
  • 11.
    Use of CyclomaticComplexity: Determining the independent path executions thus proven to be very helpful for Developers and Testers. It can make sure that every path have been tested at least once. Thus help to focus more on uncovered paths. Code coverage can be improved. Risk associated with program can be evaluated. These metrics being used earlier in the program helps in reducing the risks. Advantages of Cyclomatic Complexity:. It can be used as a quality metric, gives relative complexity of various designs. It is able to compute faster than the Halstead’s metrics. It is used to measure the minimum effort and best areas of concentration for testing. It is able to guide the testing process. It is easy to apply.
  • 12.
    Disadvantages of CyclomaticComplexity: It is the measure of the programs’s control complexity and not the data the data complexity. In this, nested conditional structures are harder to understand than non-nested structures. In case of simple comparisons and decision strucures, it may give a misleading figure.
  • 13.
    13 Flow Graph Example 1 2 0 3 4 5 6 78 9 10 11 1 2 3 4 6 7 8 5 9 10 11 R1 R2 R3 R4 FLOW CHART FLOW GRAPH 0
  • 14.
    Deriving Test Cases It is a series of steps method.  The procedure average depicted.  Average, an extremely simple algorithm, contains compound conditions and loops. To derive basis set, follow the steps. 1. Using the design or code as a foundation, draw a corresponding flow graph.  A flow graph is created by numbering those PDL statements that will be mapped into corresponding flow graph nodes.
  • 15.
  • 16.
    Flow graph forthe procedure average
  • 17.
    2. Determine thecyclomatic complexity of the resultant flow graph. 2. V(G) can be determined without developing a flow graph by counting all conditional statements in the PDL (for the procedure average, compound conditions count as two) and adding 1 3. V(G) = 6 regions 4. V(G) = 17 edges - 13 nodes + 2 = 6 5. V(G) = 5 predicate nodes + 1 = 6 3. Determine a basis set of linearly independent paths 3. The value of V(G) provides the number of linearly independent paths through the program control structure. 4. path 1: 1-2-10-11-13 5. path 2: 1-2-10-12-13 6. path 3: 1-2-3-10-11-13 7. path 4: 1-2-3-4-5-8-9-2-. . . 8. path 5: 1-2-3-4-5-6-8-9-2-. . . 9. path 6: 1-2-3-4-5-6-7-8-9-2-. . . 10. The ellipsis (. . .) following paths 4, 5, and 6 indicates that any path through the remainder of the control structure is acceptable.
  • 18.
    4. Prepare testcases that will force execution of each path in the basis set.  Data should be chosen so that conditions at the predicate nodes are appropriately set as each path is tested.  Each test case is executed and compared to expected results.  Once all test cases have been completed, the tester can be sure that all statements in the program have been executed at least once.
  • 19.
    19 Create flow graph,generate cyclomatic complexity and find test cases 1 int functionZ(int y) 2 { 3 int x = 0; 4 while (x <= (y * y)) 5 { 6 if ((x % 11 == 0) && 7 (x % y == 0)) 8 { 9 printf(“%d”, x); 10 x++; 11 } // End if 12 else if ((x % 7 == 0) || 13 (x % y == 1)) 14 { 15 printf(“%d”, y); 16 x = x + 2; } // End else 18 printf(“n”); 19 } // End while 20 printf("End of listn"); 21 return 0; 22 } // End functionZ
  • 20.
    20 A Sample Functionto Diagram and Analyze 1 int functionZ(int y) 2 { 3 int x = 0; 4 while (x <= (y * y)) 5 { 6 if ((x % 11 == 0) && 7 (x % y == 0)) 8 { 9 printf(“%d”, x); 10 x++; 11 } // End if 12 else if ((x % 7 == 0) || 13 (x % y == 1)) 14 { 15 printf(“%d”, y); 16 x = x + 2; } // End else 18 printf(“n”); 19 } // End while 20 printf("End of listn"); 21 return 0; 22 } // End functionZ 3 4 6 7 9 10 12 13 15 16 18 20 21
  • 21.
     3,4 20,21  3,4,6,12,15,16,18,4,20,21  3,4,6,12,13,15,16,18,…  3,4,6,7,12,15,16,18,…  3,4,6,7,12,13,18,…  3,4,6,7,9,10,18
  • 22.
    Graph Matrices  Agraph matrix is a square matrix whose size (i.e., number of rows and columns) is equal to the number of nodes on the flow graph.  Each row and column corresponds to an identified node, and matrix entries correspond to connections (an edge) between nodes.  Each node on the flow graph is identify by numbers, while each edge is identify by letters.  The graph matrix is nothing more than a tabular representation of a flow graph.  By adding a link weight to each matrix entry, the graph matrix can become a powerful tool for evaluating program control structure during testing.  The link weight provides additional information about control flow. In its simplest form, the link weight is 1 (a connection exists) or 0 (a connection does not exist).
  • 24.
  • 25.
     Each letterhas been replaced with a 1, indicating that a connection exists (this graph matrix is called a connection matrix).  In fig.( connection matrix) each row with two or more entries represents a predicate node.  We can directly measure cyclomatic complexity value by performing arithmetic operations  Connections = Each row Total no. of entries – 1.  V(G)= Sum of all connections + 1