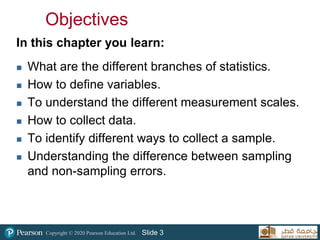
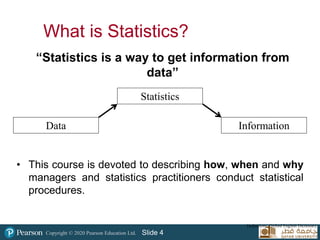
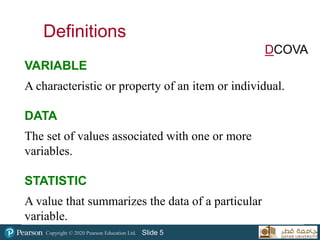
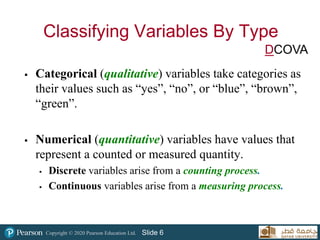
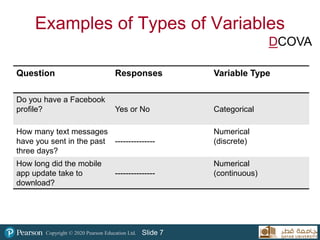
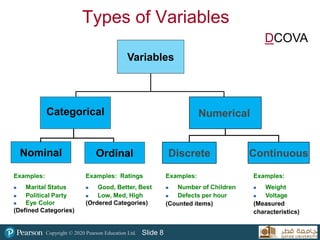
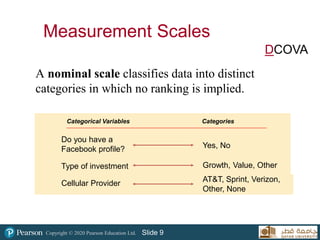
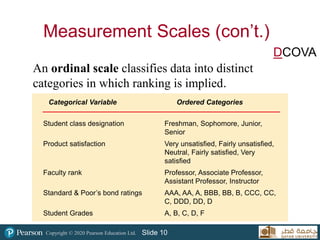
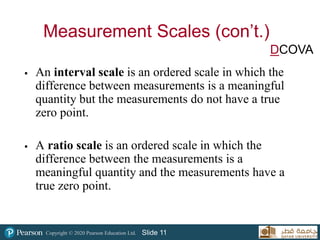
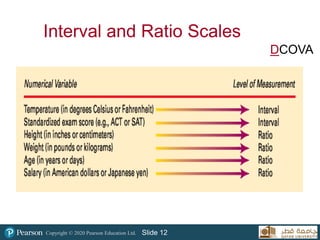
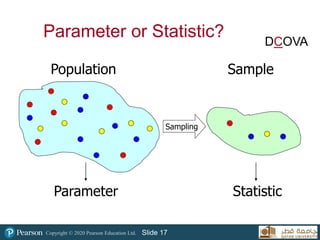
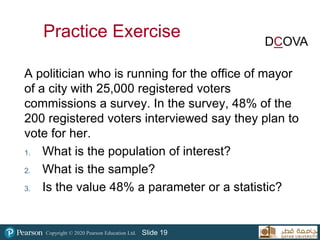
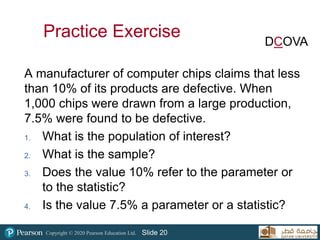
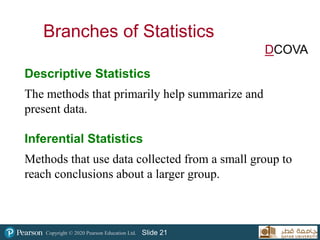
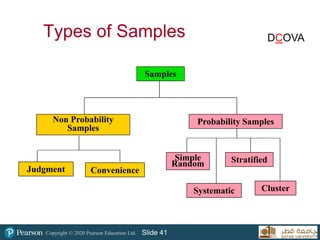
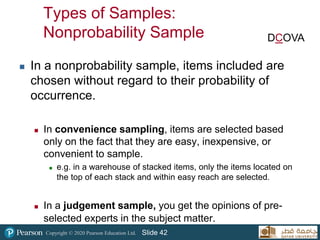
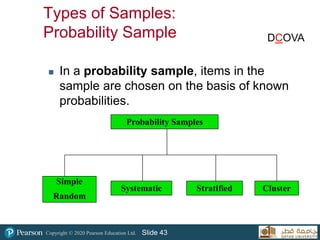
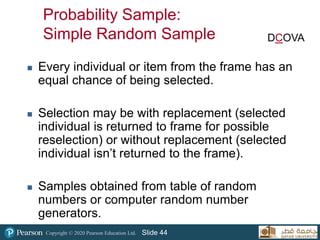
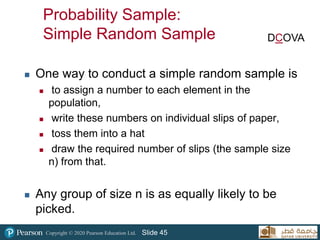
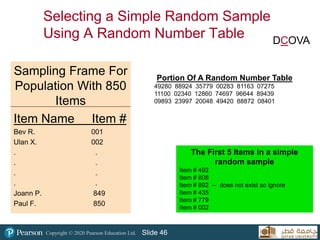
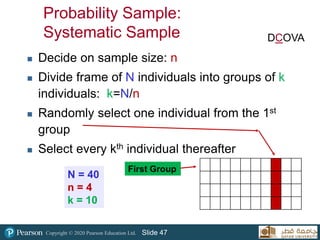
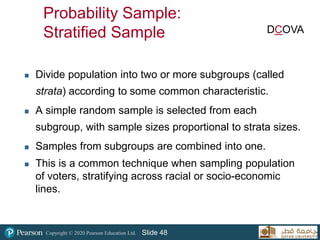
More Related Content
Similar to Business Statistics 1 chapter 1: Introduction (20)
Business Statistics 1 chapter 1: Introduction
- 1. Copyright © 2020 Pearson Education Ltd. Slide 1
Business Statistics I
Mohammed Ait Lahcen
Department of Finance and Economics
- 2. Copyright © 2020 Pearson Education Ltd. Slide 2
Defining and Collecting
Data
Chapter 1
- 3. Copyright © 2020 Pearson Education Ltd. Slide 3
Objectives
In this chapter you learn:
What are the different branches of statistics.
How to define variables.
To understand the different measurement scales.
How to collect data.
To identify different ways to collect a sample.
Understanding the difference between sampling
and non-sampling errors.
- 4. Copyright © 2020 Pearson Education Ltd. Slide 4
“Statistics is a way to get information from
data”
Data
Statistics
Information
Definitions: Oxford English Dictionary
• This course is devoted to describing how, when and why
managers and statistics practitioners conduct statistical
procedures.
What is Statistics?
- 5. Copyright © 2020 Pearson Education Ltd. Slide 5
Definitions
DCOVA
VARIABLE
A characteristic or property of an item or individual.
DATA
The set of values associated with one or more
variables.
STATISTIC
A value that summarizes the data of a particular
variable.
- 6. Copyright © 2020 Pearson Education Ltd. Slide 6
Classifying Variables By Type
Categorical (qualitative) variables take categories as
their values such as “yes”, “no”, or “blue”, “brown”,
“green”.
Numerical (quantitative) variables have values that
represent a counted or measured quantity.
Discrete variables arise from a counting process.
Continuous variables arise from a measuring process.
DCOVA
- 7. Copyright © 2020 Pearson Education Ltd. Slide 7
Examples of Types of Variables
DCOVA
Question Responses Variable Type
Do you have a Facebook
profile? Yes or No Categorical
How many text messages
have you sent in the past
three days?
---------------
Numerical
(discrete)
How long did the mobile
app update take to
download?
---------------
Numerical
(continuous)
- 8. Copyright © 2020 Pearson Education Ltd. Slide 8
Types of Variables
DCOVA
Variables
Categorical Numerical
Discrete Continuous
Examples:
Marital Status
Political Party
Eye Color
(Defined Categories)
Examples:
Number of Children
Defects per hour
(Counted items)
Examples:
Weight
Voltage
(Measured
characteristics)
Nominal Ordinal
Examples: Ratings
Good, Better, Best
Low, Med, High
(Ordered Categories)
- 9. Copyright © 2020 Pearson Education Ltd. Slide 9
Measurement Scales
A nominal scale classifies data into distinct
categories in which no ranking is implied.
Categorical Variables Categories
Do you have a
Facebook profile?
Type of investment
Cellular Provider
Yes, No
AT&T, Sprint, Verizon,
Other, None
Growth, Value, Other
DCOVA
- 10. Copyright © 2020 Pearson Education Ltd. Slide 10
Measurement Scales (con’t.)
An ordinal scale classifies data into distinct
categories in which ranking is implied.
Categorical Variable Ordered Categories
Student class designation Freshman, Sophomore, Junior,
Senior
Product satisfaction Very unsatisfied, Fairly unsatisfied,
Neutral, Fairly satisfied, Very
satisfied
Faculty rank Professor, Associate Professor,
Assistant Professor, Instructor
Standard & Poor’s bond ratings AAA, AA, A, BBB, BB, B, CCC, CC,
C, DDD, DD, D
Student Grades A, B, C, D, F
DCOVA
- 11. Copyright © 2020 Pearson Education Ltd. Slide 11
Measurement Scales (con’t.)
An interval scale is an ordered scale in which the
difference between measurements is a meaningful
quantity but the measurements do not have a true
zero point.
A ratio scale is an ordered scale in which the
difference between the measurements is a
meaningful quantity and the measurements have a
true zero point.
DCOVA
- 12. Copyright © 2020 Pearson Education Ltd. Slide 12
Interval and Ratio Scales
DCOVA
- 13. Copyright © 2020 Pearson Education Ltd. Slide 13
Practice Exercise
Identify each of the following as examples of
nominal, ordinal or numerical data:
1. The temperature in Doha on any given day
2. The make (Toyota, Honda, etc.) of automobile
3. Whether or not a student is married
4. The weight of a pencil
5. The length of time billed for a long distance telephone
call
6. The brand quality of cereal
7. The type of book (fiction, drama, etc.)
- 14. Copyright © 2020 Pearson Education Ltd. Slide 14
Data Is Collected From Either A
Population or A Sample
POPULATION
A population contains all of the items or
individuals of interest that you seek to study.
SAMPLE
A sample contains only a portion of a
population of interest.
DCOVA
- 15. Copyright © 2020 Pearson Education Ltd. Slide 15
Population vs. Sample
All the items or individuals
about which you want to draw
conclusion(s).
A portion of the population
of items or individuals.
Population Sample
DCOVA
A Population of Size 40 A Sample of Size 4
- 16. Copyright © 2020 Pearson Education Ltd. Slide 16
Parameter or Statistic?
A population parameter summarizes the value
of a specific variable for a population.
A sample statistic summarizes the value of a
specific variable for sample data.
DCOVA
- 17. Copyright © 2020 Pearson Education Ltd. Slide 17
Parameter
Population Sample
Statistic
Sampling
Parameter or Statistic? DCOVA
- 18. Copyright © 2020 Pearson Education Ltd. Slide 18
If you ask all employees in a factory what kind
of lunch they prefer and half of them say pasta,
you get a parameter – 50% of the employees
like pasta for lunch.
If you select a sample of 200 employees from
this factory and you ask them what kind of lunch
they prefer, you get a statistic – 55% of the
sample like pasta for lunch.
Examples DCOVA
- 19. Copyright © 2020 Pearson Education Ltd. Slide 19
A politician who is running for the office of mayor
of a city with 25,000 registered voters
commissions a survey. In the survey, 48% of the
200 registered voters interviewed say they plan to
vote for her.
1. What is the population of interest?
2. What is the sample?
3. Is the value 48% a parameter or a statistic?
Practice Exercise DCOVA
- 20. Copyright © 2020 Pearson Education Ltd. Slide 20
Practice Exercise
A manufacturer of computer chips claims that less
than 10% of its products are defective. When
1,000 chips were drawn from a large production,
7.5% were found to be defective.
1. What is the population of interest?
2. What is the sample?
3. Does the value 10% refer to the parameter or
to the statistic?
4. Is the value 7.5% a parameter or a statistic?
DCOVA
- 21. Copyright © 2020 Pearson Education Ltd. Slide 21
Branches of Statistics
Descriptive Statistics
The methods that primarily help summarize and
present data.
Inferential Statistics
Methods that use data collected from a small group to
reach conclusions about a larger group.
DCOVA
- 22. Copyright © 2020 Pearson Education Ltd. Slide 22
Descriptive Statistics
Descriptive statistics deals with methods of
summarizing data in a convenient and
informative way.
One form of descriptive statistics uses tabular
and graphical techniques, which allow
statistics practitioners to present data in ways
that make it easy for the reader to get useful
information.
Chapter 2 introduces several tabular and
graphical methods.
- 23. Copyright © 2020 Pearson Education Ltd. Slide 23
Descriptive Statistics
Another form of descriptive statistics uses
numerical techniques to summarize data.
The mean and median are popular numerical
techniques to describe the central location of
the data.
The range, variance, and standard deviation
measure the variability of the data.
Chapter 3 introduces several numerical
statistical measures that describe different
features of the data.
- 24. Copyright © 2020 Pearson Education Ltd. Slide 24
Inferential Statistics
Inferential statistics is the process of making an
estimate, prediction, or decision about a
population based on a sample.
Parameter
Population Sample
Statistic
Sampling
Inference
- 25. Copyright © 2020 Pearson Education Ltd. Slide 25
Qatar’s population is projected to reach 3.32
million in 2030. (Inferential statistics)
The mean salary of a random sample of 80 high
school teachers in 2020 was 17,000 QAR.
(Descriptive statistics)
Based on a survey, the mean weekly hours of
TV watched by teenagers in the US is 8.8
hours. (Inferential statistics)
Examples
DCOVA
- 26. Copyright © 2020 Pearson Education Ltd. Slide 26
Remember…
Statistics is a tool for converting data into
information:
But where then does data come from? How is it
gathered? How do we ensure it is accurate? Is
the data reliable? Is it representative of the
population from which it was drawn?
26
Data
Statistics
Information
DCOVA
- 27. Copyright © 2020 Pearson Education Ltd. Slide 27
Sources of Data
Primary Sources: The data collector is the one
using the data for analysis:
Data from a political survey.
Data collected from an experiment.
Observed data.
Secondary Sources: The person performing
data analysis is not the data collector:
Analyzing census data.
Examining data from print journals or data published
on the internet.
DCOVA
- 28. Copyright © 2020 Pearson Education Ltd. Slide 28
Sources Of Data Arise From
The Following Activities
Capturing data generated by ongoing business
activities.
Distributing data compiled by an organization or
individual.
Compiling the responses from a survey.
Conducting a designed experiment and
recording the outcomes.
Conducting an observational study and
recording the results.
DCOVA
- 29. Copyright © 2020 Pearson Education Ltd. Slide 29
Examples of Data Collected From
Ongoing Business Activities
A bank studies years of financial transactions to
help them identify patterns of fraud.
Economists utilize data on searches done via
Google to help forecast future economic
conditions.
Marketing companies use tracking data to
evaluate the effectiveness of a web site.
DCOVA
- 30. Copyright © 2020 Pearson Education Ltd. Slide 30
Examples Of Data Distributed
By An Organization or Individual
Financial data on a company provided by
investment services.
Industry or market data from market research
firms and trade associations.
Stock prices, weather conditions, and sports
statistics in daily newspapers.
DCOVA
- 31. Copyright © 2020 Pearson Education Ltd. Slide 31
Surveys
A survey solicits information from people.
The Response Rate (i.e. the proportion of all
people selected who complete the survey) is a
key survey parameter.
Surveys may be administered in a variety of
ways:
Personal interview.
Telephone interview.
Self- administered questionnaire.
Online survey.
DCOVA
- 32. Copyright © 2020 Pearson Education Ltd. Slide 32
Examples of Survey Data
A survey asking people which laundry detergent
has the best stain-removing abilities.
Political polls of registered voters during political
campaigns.
People being surveyed to determine their
satisfaction with a recent product or service
experience.
DCOVA
- 33. Copyright © 2020 Pearson Education Ltd. Slide 33
Survey questionnaire design
The questionnaire must be well designed.
Some basic points to consider:
Keep the questionnaire as short as possible. (to
encourage respondents to complete it.)
Ask short, simple, and clearly worded questions. (to
answer quickly.)
Use yes|no and multiple choice questions. (useful
because of their simplicity.)
DCOVA
- 34. Copyright © 2020 Pearson Education Ltd. Slide 34
Survey questionnaire design
The questionnaire must be well designed.
Some basic points to consider:
Avoid using leading-questions. (wouldn’t you agree
that the statistics exam was too difficult? ----- lead to
a particular answer. )
Pretest a questionnaire on a small number of people
(to uncover potential problems such as ambiguous
questions).
DCOVA
- 35. Copyright © 2020 Pearson Education Ltd. Slide 35
Examples of Data From A
Designed Experiment
Consumer testing of different versions of a
product to help determine which product should
be pursued further.
Material testing to determine which supplier’s
material should be used in a product.
Market testing on alternative product
promotions to determine which promotion to
use more broadly.
DCOVA
- 36. Copyright © 2020 Pearson Education Ltd. Slide 36
Examples of Data Collected
From Observational Studies
Market researchers utilizing focus groups to
elicit unstructured responses to open-ended
questions.
Measuring the time it takes for customers to be
served in a fast food establishment.
Measuring the volume of traffic through an
intersection to determine if some form of
advertising at the intersection is justified.
DCOVA
- 37. Copyright © 2020 Pearson Education Ltd. Slide 37
Observational Studies & Designed
Experiments Have A Common Objective
Both are attempting to quantify the effect that a
process change (called a treatment) has on a
variable of interest.
In an observational study, there is no direct
control over which items receive the treatment.
In a designed experiment, there is direct control
over which items receive the treatment.
DCOVA
- 38. Copyright © 2020 Pearson Education Ltd. Slide 38
Sampling
Sampling is a process used in statistical
analysis in which a predetermined number of
observations are taken from a larger population.
The methodology used to sample from the
population depends on the type of analysis
being performed.
38
- 39. Copyright © 2020 Pearson Education Ltd. Slide 39
Collecting Data Via Sampling Is Used
When Doing So Is
Less time consuming than selecting every item
in the population.
Less costly than selecting every item in the
population.
Less cumbersome and more practical than
analyzing the entire population.
DCOVA
- 40. Copyright © 2020 Pearson Education Ltd. Slide 40
A Sampling Process Begins With A
Sampling Frame
The sampling frame is a listing of items that
make up the population.
Frames are data sources such as population
lists, directories, or maps.
Inaccurate or biased results can result if a
frame excludes certain groups or portions of the
population.
Using different frames to generate data can
lead to dissimilar conclusions.
DCOVA
- 41. Copyright © 2020 Pearson Education Ltd. Slide 41
Types of Samples
Samples
Non Probability
Samples
Judgment
Probability Samples
Simple
Random
Systematic
Stratified
Cluster
Convenience
DCOVA
- 42. Copyright © 2020 Pearson Education Ltd. Slide 42
Types of Samples:
Nonprobability Sample
In a nonprobability sample, items included are
chosen without regard to their probability of
occurrence.
In convenience sampling, items are selected based
only on the fact that they are easy, inexpensive, or
convenient to sample.
e.g. in a warehouse of stacked items, only the items located on
the top of each stack and within easy reach are selected.
In a judgement sample, you get the opinions of pre-
selected experts in the subject matter.
DCOVA
- 43. Copyright © 2020 Pearson Education Ltd. Slide 43
Types of Samples:
Probability Sample
In a probability sample, items in the
sample are chosen on the basis of known
probabilities.
Probability Samples
Simple
Random
Systematic Stratified Cluster
DCOVA
- 44. Copyright © 2020 Pearson Education Ltd. Slide 44
Probability Sample:
Simple Random Sample
Every individual or item from the frame has an
equal chance of being selected.
Selection may be with replacement (selected
individual is returned to frame for possible
reselection) or without replacement (selected
individual isn’t returned to the frame).
Samples obtained from table of random
numbers or computer random number
generators.
DCOVA
- 45. Copyright © 2020 Pearson Education Ltd. Slide 45
One way to conduct a simple random sample is
to assign a number to each element in the
population,
write these numbers on individual slips of paper,
toss them into a hat
draw the required number of slips (the sample size
n) from that.
Any group of size n is as equally likely to be
picked.
DCOVA
Probability Sample:
Simple Random Sample
- 46. Copyright © 2020 Pearson Education Ltd. Slide 46
Selecting a Simple Random Sample
Using A Random Number Table
Sampling Frame For
Population With 850
Items
Item Name Item #
Bev R. 001
Ulan X. 002
. .
. .
. .
. .
Joann P. 849
Paul F. 850
Portion Of A Random Number Table
49280 88924 35779 00283 81163 07275
11100 02340 12860 74697 96644 89439
09893 23997 20048 49420 88872 08401
The First 5 Items in a simple
random sample
Item # 492
Item # 808
Item # 892 -- does not exist so ignore
Item # 435
Item # 779
Item # 002
DCOVA
- 47. Copyright © 2020 Pearson Education Ltd. Slide 47
Decide on sample size: n
Divide frame of N individuals into groups of k
individuals: k=N/n
Randomly select one individual from the 1st
group
Select every kth individual thereafter
Probability Sample:
Systematic Sample
N = 40
n = 4
k = 10
First Group
DCOVA
- 48. Copyright © 2020 Pearson Education Ltd. Slide 48
Probability Sample:
Stratified Sample
Divide population into two or more subgroups (called
strata) according to some common characteristic.
A simple random sample is selected from each
subgroup, with sample sizes proportional to strata sizes.
Samples from subgroups are combined into one.
This is a common technique when sampling population
of voters, stratifying across racial or socio-economic
lines.
DCOVA
- 49. Copyright © 2020 Pearson Education Ltd. Slide 49
Examples of criteria for separating a population
into strata:
Gender
Male
Female
Age
< 20
20-30
31-40
41-50
51-60
> 60
Occupation
professional
clerical
blue collar
other
DCOVA
Probability Sample:
Stratified Sample
- 50. Copyright © 2020 Pearson Education Ltd. Slide 50
We can make inferences within a stratum or
make comparisons across strata.
If we only have sufficient resources to sample 400 people total,
we would draw 100 of them from the low income group…
…if we are sampling 1000 people, we’d draw
50 of them from the high income group.
Probability Sample:
Stratified Sample
DCOVA
- 51. Copyright © 2020 Pearson Education Ltd. Slide 51
Probability Sample
Cluster Sample
Population is divided into several “clusters,” each representative of
the population.
A simple random sample of clusters is selected.
All items in the selected clusters can be used, or items can be
chosen from a cluster using another probability sampling technique.
A common application of cluster sampling involves election exit polls,
where certain election districts are selected and sampled.
Population
divided into
16 clusters. Randomly selected
clusters for sample
DCOVA
- 52. Copyright © 2020 Pearson Education Ltd. Slide 52
Example
A firm is interested in estimating the average
per capita income in a certain city. There is not
an available list of resident adults.
The city is marked off into rectangular blocks
(60 blocks).
The researchers decide that each of the city
blocks will be considered a cluster.
The clusters are numbered from 1 to 60 and
there is budget for sampling n = 20 clusters and
to interview every household within each
cluster.
52
- 53. Copyright © 2020 Pearson Education Ltd. Slide 53
Probability Sample:
Comparing Sampling Methods
Simple random sample and Systematic sample:
Simple to use.
May not be a good representation of the
population’s underlying characteristics.
Stratified sample:
Ensures representation of individuals across the
entire population.
Cluster sample:
More cost effective.
Less efficient (need larger sample to acquire the
same level of precision).
DCOVA
- 54. Copyright © 2020 Pearson Education Ltd. Slide 54
Sample Size
The larger the sample size is, the more
accurate we can expect the sample estimates
to be.
Numerical techniques for determining sample
sizes will be described in Business Stat II.
DCOVA
- 55. Copyright © 2020 Pearson Education Ltd. Slide 55
Sampling and Non-Sampling
Errors
Two major types of error can arise when a
sample of observations is taken from a
population:
Sampling error
Non-Sampling error.
Sampling error refers to differences between
the sample and the population that exist only
because of the observations that happened to
be selected for the sample.
DCOVA
- 56. Copyright © 2020 Pearson Education Ltd. Slide 56
Non-Sampling Error
Non-Sampling errors are more serious and are
due to mistakes made in the collection of data
or due to the sample observations being
selected improperly.
Three types of non-sampling errors:
Errors in data collection
Non-response errors
Selection bias
Note: increasing the sample size will not
reduce this type of error.
DCOVA
- 57. Copyright © 2020 Pearson Education Ltd. Slide 57
Errors in Data Collection
Errors arise from the recording of incorrect
responses due to:
1. Incorrect measurements being taken because
of faulty equipment,
2. Inaccurate recording of data
3. Inaccurate responses to questions
DCOVA
- 58. Copyright © 2020 Pearson Education Ltd. Slide 58
Non-Response Error
It refers to error (or bias) introduced when
responses are not obtained from some
members of the sample.
The sample observations that are collected
may not be representative of the target
population.
The Response Rate helps in the understanding in the
validity of the survey and sources of nonresponse
error.
DCOVA
- 59. Copyright © 2020 Pearson Education Ltd. Slide 59
Selection Bias
Occurs if the sampling plan is such that some
members of the target population cannot
possibly be selected for inclusion in the sample
(coverage error).
i.e. if the selection of data points isn't sufficiently
random (not representative) to draw a general
conclusion about the population.
e.g. if you survey your friends, they may not be
representative of QU students population.
DCOVA
- 60. Copyright © 2020 Pearson Education Ltd. Slide 60
Chapter Summary
In this chapter we have discussed:
Understanding issues that arise when defining
variables.
How to define variables.
Understanding the different measurement scales.
How to collect data.
Identifying different ways to collect a sample.
Understanding the difference between sampling
and non-sampling errors.