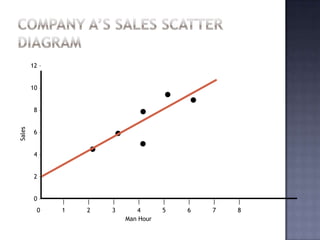
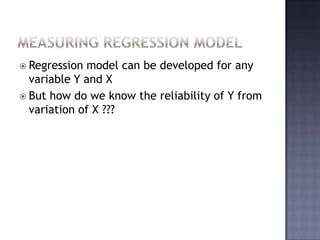
Quantitative Analysis for BusinessLecture 2July 5th, 2010Saksarun (Jay) Mativachranon
IntroPlease turn your mobile phones off or switch it to silent modeand please do not pick up your callsSlide will be available atwww.slideshow.com (soon)Email: saarkman@gmail.com
Linear regression
RegressionRegression is used for estimating the unknown effect of changing one variable over anotherThe variable to be estimated is called “dependent variable”The changing variable is called “independent variable”
Linear Regression AssumptionsThere is NO relationship between X and Y if 1 equals to 0There is ALWAYS a relationship if 1 does NOT equal to 0The independent Variable (X) is not randomThe expected value of error (e ) is 0
Linear Regression AnalysisAnalyzing the correlation and directionality of the dataEstimating the modelEvaluating the validity and usefulness of the model
Usage of RegressionCausal analysisForecasting an effect (of independent variable to that of dependent variable)Forecasting (trend of) future values
Simple Linear RegressionTrue value of slope and intercept are not known, so we estimate them by using sample datawhere		Y	= dependent variable	X	= independent variable b0 	= intercept (value of Y when X = 0) b1	= slope of the regression line^
Scatter Diagram
exampleLinear Regression
SituationCompany A wants to know the relationship between the Man Hour of their sales force and their sales numberThey have collected their sales data and the man hour put in during the collection period
Company A Data
Company A’s Sales Scatter Diagram12 –10 –8 –6 –4 –2 –0 –Sales		|	|	|	|	|	|	|	|	0	1	2	3	4	5	6	7	8Man Hour
Finding the RegressionCompany A is trying to predict its sales from the man hour spentThe line in is the one that minimizes the errorsY = SalesX = Man HourError = (Actual value) – (Predicted value)
Data manipulationFor the simple linear regression model, the values of the intercept and slope can be calculated using the formulas below
Regression Calculation________
Regression Calculation (cont.)Therefore
ResultsCompany A Sales modelPredicting salesEvery 1 Man-hour, Company A sells $3.25 worth of goods
Measuring Regression ModelRegression model can be developed for any variable Y and XBut how do we know the reliability of Y from variation of X ???
Company A’s Sales Model12 –10 –8 –6 –4 –2 –0 –Sales		|	|	|	|	|	|	|	|	0	1	2	3	4	5	6	7	8Man HourErrorError
Measuring Regression Model (cont.)How do we know the reliability of Y from variation of X ???Can we find the average of the errors?
Measurement of VariabilitySST – Total variability about the meanSSE – Variability about the regression lineSSR – Total variability that is explained by the model
Measurement of VariabilitySum of the squares totalSum of the squared errorSum of squares due to regressionAn important relationship
Company A example__^^^__^^_
Company A’s VariabilitySST = 22.5SSE = 6.875SSR = 15.625
Company A’s Sales Model12 –10 –8 –6 –4 –2 –0 –^Y = 2 + 1.25X^Y – YYSalesY – YY – Y^		|	|	|	|	|	|	|	|	0	1	2	3	4	5	6	7	8Man Hour
Coefficient of DeterminationThe proportion of variability of Y in the regression model
Coefficient of DeterminationThe coefficient of determination is r2
Company A exampleExplanationOver 69% of Y can be predicted by variation of XFor Company A
Correlation CoefficientThe strength of linear relationshipRelationship of Y and XIt will always be between +1 and –1The correlation coefficient is r
Correlation CoefficientYY****************XX(a)	Perfect PositiveCorrelation: r = +1(b)	PositiveCorrelation: 0 < r < 1YY******************XX(c)	No Correlation: r = 0(d)	Perfect Negative Correlation: r = –1
Next WeekLinear RegressionErrors in Regression modelVarianceMean Square ErrorStandard DeviationTesting the ModelMultiple Regression

Business Quantitative - Lecture 2