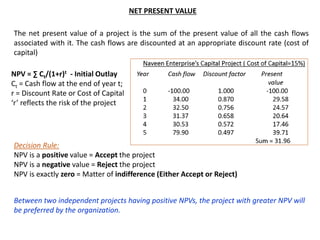
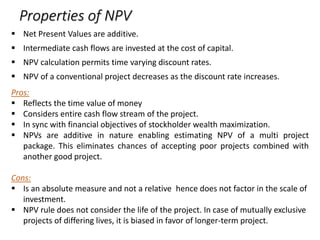
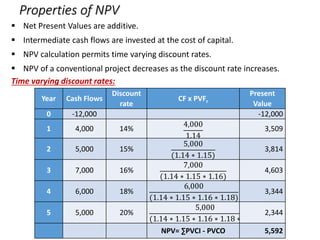
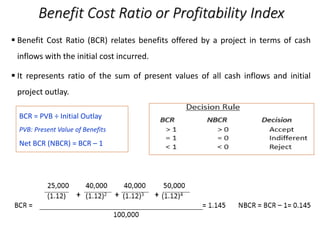
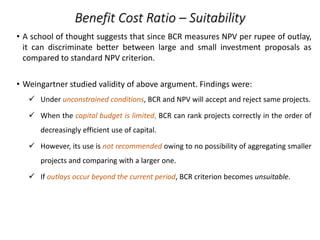
The document discusses various capital budgeting techniques used to evaluate investment projects. It covers topics like the capital budgeting process, investment criteria including payback period, accounting rate of return, net present value, internal rate of return and modified internal rate of return. It provides examples and outlines the key advantages and limitations of each technique.

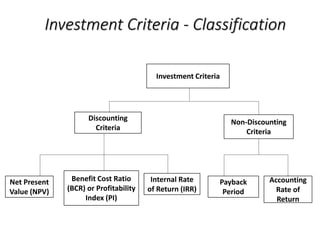
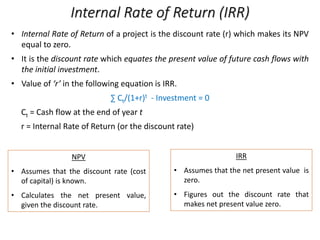
![Pay Back Period (PBP)
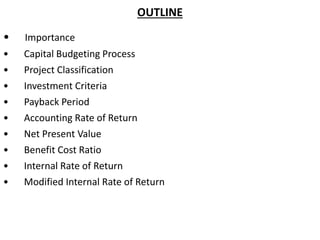
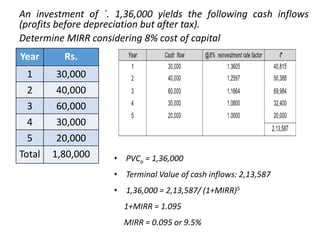
• In certain projects if the annual cash flows are unequal, the calculation of PBP
becomes slightly complex.
• PBP of above project =
Lower Year + [(Outlay – CCFLL) ÷ (CCFUL – CCFLL)]
3 + [(1,35,000 – 1,15,000) ÷ (1,62,500 – 1,15,000)] = 3.42 years
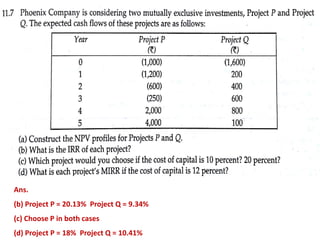
Year 0 1 2 3 4 5
Cash Flows 1,35,000 30,000 40,000 45,000 47,500 50,000
Year Cash Flows (in Rs.) Cumulative Cash Flows (CCF) (in Rs.)
0 (1,35,000) -
1 30,000 30,000
2 40,000 70,000
3 45,000 1,15,000
4 47,500 1,62,500
5 50,000 2,12,500](https://image.slidesharecdn.com/ch-11capitalbudgeting-221104160708-9871bbc8/85/Ch-11-Capital-Budgeting-pdf-8-320.jpg)
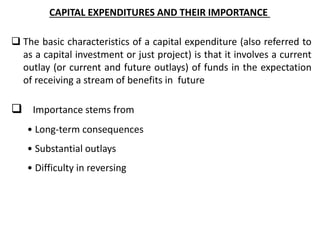
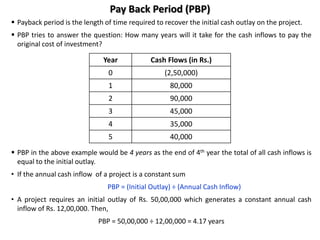
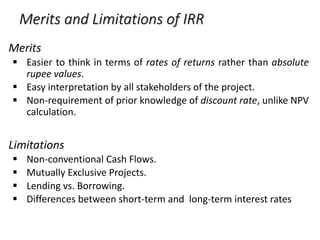
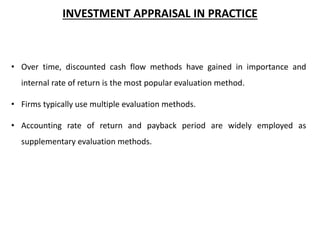
![Discounted Pay Back Period
• Overcomes an inherent shortcoming of PBP criterion by factoring in time value of
money into the analysis.
• Discounted PBP of above project =
Lower Year + [(Outlay – CCFLL) ÷ (CCFUL – CCFLL)]
3 + [(10,000 – 8,209) ÷ (10,941 – 8,209)] = 3.6 years
Year 0 1 2 3 4 5
Cash Flows -10,000 3,000 3,000 4,000 4,000 5,000
Year Cash Flows
(in Rs.)
Discount Factor
@10%
Present Value
(in Rs.)
Cumulative
Discounted Cash
Flows (in Rs.)
0 (10,000) - - -
1 3,000 0.909 2,727 2,727
2 3,000 0.826 2,478 5,205
3 4,000 0.751 3,004 8,209
4 4,000 0.683 2,732 10,941
5 5,000 0.621 3,105 14,046](https://image.slidesharecdn.com/ch-11capitalbudgeting-221104160708-9871bbc8/85/Ch-11-Capital-Budgeting-pdf-10-320.jpg)
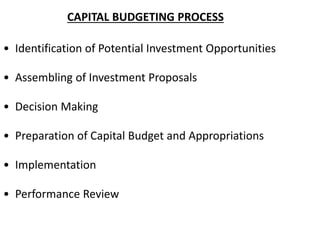
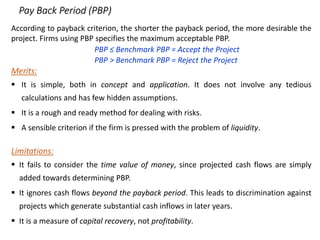
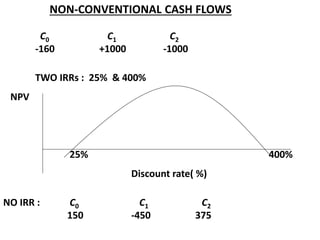
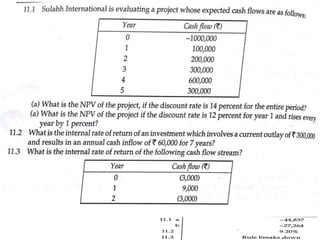
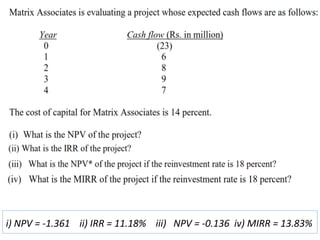
![Internal Rate of Return (IRR)
Following are the projected cash flows of a proposed project
IRR is the value of ‘r’ which satisfies the following equation:
1,00,000 = [30,000/(1+r)] + [30,000/(1+r)2] + [40,000/(1+r)3] + [45,000/(1+r)4]
or 1,00,000 = 30,000 (PVIFr,1) + 30,000 (PVIFr,2) + 40,000 (PVIFr,3) + 45,000 (PVIFr,4)
Assume ‘r’ = 15%
30,000 (PVIFr,1) + 30,000 (PVIFr,2) + 40,000 (PVIFr,3) + 45,000 (PVIFr,4) = 1,00,801 > 1,00,000
Consider ‘r’ = 16%
30,000 (PVIFr,1) + 30,000 (PVIFr,2) + 40,000 (PVIFr,3) + 45,000 (PVIFr,4) = 98,636 < 1,00,000
IRR (or r) lies between 15% and 16%
Year 0 1 2 3 4
Cash Flow (in INR) (1,00,000) 30,000 30,000 40,000 45,000
= 15%
801
801+1364
x 16% - 15 %
IRR = 15.37 %](https://image.slidesharecdn.com/ch-11capitalbudgeting-221104160708-9871bbc8/85/Ch-11-Capital-Budgeting-pdf-18-320.jpg)
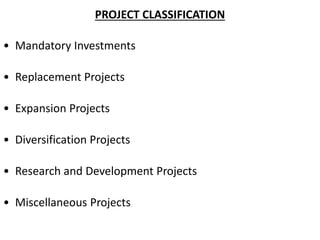
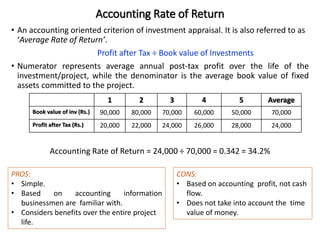
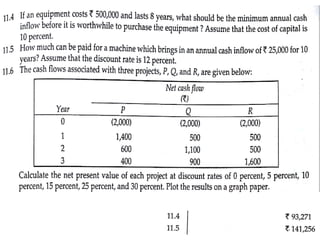
![Modified IRR (MIRR)
• IRR assumes intermediate positive cash flows from a project are reinvested at its
IRR.
• This assumption generates inflated IRR estimates which may lead to selection of
inferior projects.
• (http://www.mckinsey.com/business-functions/strategy-and-corporate-
finance/our-insights/internal-rate-of-return-a-cautionary-tale)
• MIRR offers an improvement to traditional IRR enabling a more accurate
reflection of cost and profitability of a project.
• MIRR considers reinvestment of intermediate positive cash flows at the firm’s cost
of cost of capital, while initial outlay(s) are financed at firm’s financing cost.
MIRR = (Total FV of cash inflows @ cost of capital ÷ PV of initial outlay @ financing cost)1/n – 1
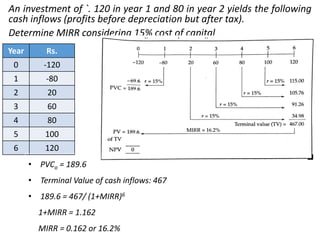
Two year project with an initial outlay of $195 and a cost of capital of 12% will return
$121 in year 1 and $131 in year 2. IRR vs MIRR ?
IRR = 18.66%, MIRR = [{121(1.12) + 131}/195]1/2 – 1 = 16.91%](https://image.slidesharecdn.com/ch-11capitalbudgeting-221104160708-9871bbc8/85/Ch-11-Capital-Budgeting-pdf-24-320.jpg)


![5) capital_budgeting_(1)_-(2)[1].ppt.pdf](https://cdn.slidesharecdn.com/ss_thumbnails/5capitalbudgeting121-250323135834-146732f6-thumbnail.jpg?width=640&height=640&fit=bounds)


