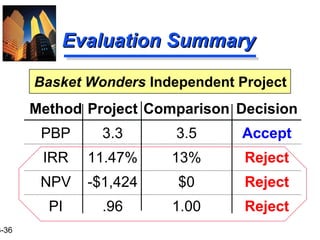
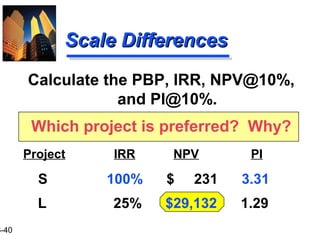
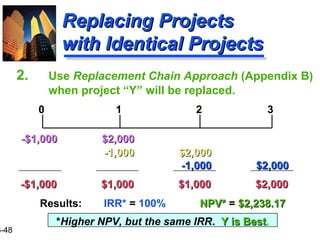
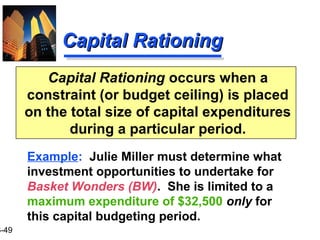
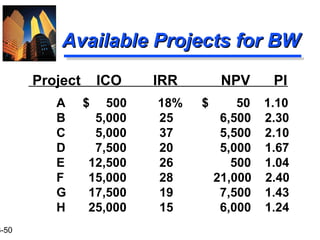
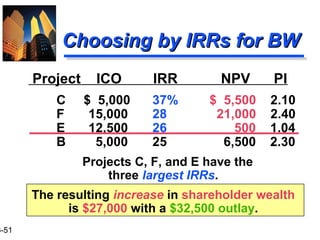
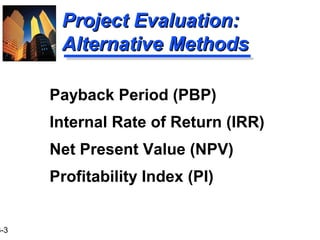
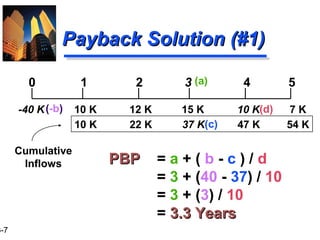
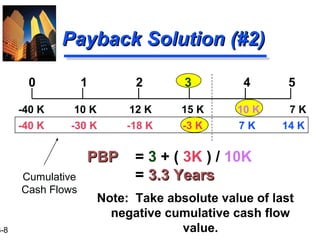
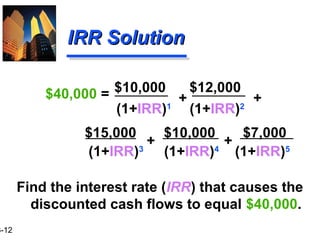
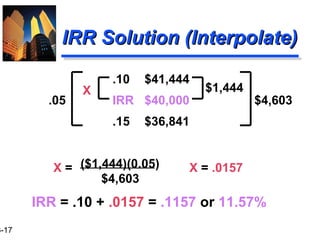
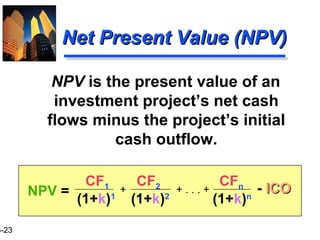
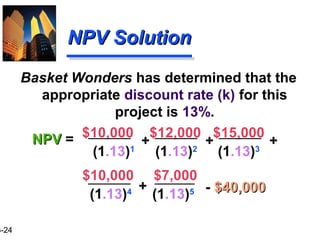
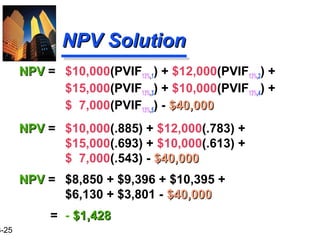
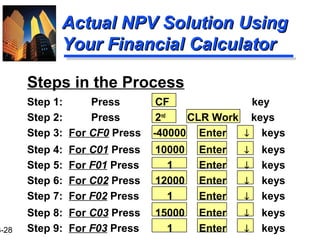
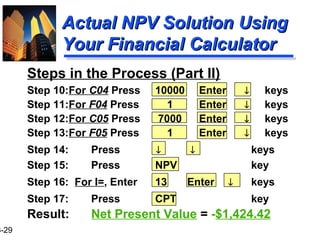
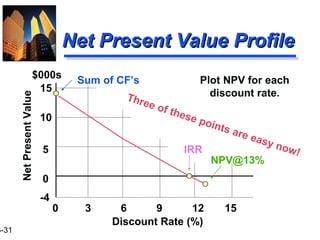
This document discusses various capital budgeting techniques used to evaluate investment projects, including payback period, internal rate of return, net present value, and profitability index. It provides an example of applying these methods to evaluate a proposed project for Basket Wonders involving an initial $40,000 investment and cash flows of $10,000, $12,000, $15,000, $10,000, and $7,000 over the next 5 years. Using the required rates of 13% and maximum payback of 3.5 years, all methods except payback period indicate the project should be rejected.


![3-9
PBP Acceptance CriterionPBP Acceptance Criterion
Yes! The firm will receive back the
initial cash outlay in less than 3.5
years. [3.3 Years < 3.5 Year Max.]
The management of Basket Wonders
has set a maximum PBP of 3.5
years for projects of this type.
Should this project be accepted?](https://image.slidesharecdn.com/ch13-180315073226/85/Financial-Management-Slides-Ch-13-9-320.jpg)
![3-13
IRR Solution (Try 10%)IRR Solution (Try 10%)
$40,000$40,000 = $10,000(PVIF10%,1) + $12,000(PVIF10%,2) +
$15,000(PVIF10%,3) + $10,000(PVIF10%,4) + $
7,000(PVIF10%,5)
$40,000$40,000 = $10,000(.909) + $12,000(.826) +
$15,000(.751) + $10,000(.683) +
$ 7,000(.621)
$40,000$40,000 = $9,090 + $9,912 + $11,265 +
$6,830 + $4,347
= $41,444$41,444 [[Rate is too low!!Rate is too low!!]]](https://image.slidesharecdn.com/ch13-180315073226/85/Financial-Management-Slides-Ch-13-13-320.jpg)
![3-14
IRR Solution (Try 15%)IRR Solution (Try 15%)
$40,000$40,000 = $10,000(PVIF15%,1) + $12,000(PVIF15%,2) +
$15,000(PVIF15%,3) + $10,000(PVIF15%,4) + $
7,000(PVIF15%,5)
$40,000$40,000 = $10,000(.870) + $12,000(.756) +
$15,000(.658) + $10,000(.572) +
$ 7,000(.497)
$40,000$40,000 = $8,700 + $9,072 + $9,870 +
$5,720 + $3,479
= $36,841$36,841 [[Rate is too high!!Rate is too high!!]]](https://image.slidesharecdn.com/ch13-180315073226/85/Financial-Management-Slides-Ch-13-14-320.jpg)
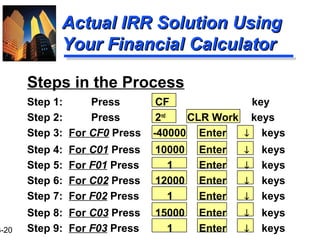
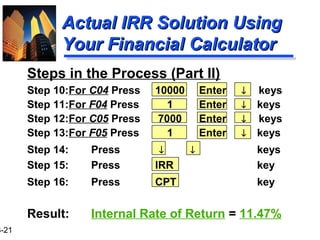
![3-18
IRR Acceptance CriterionIRR Acceptance Criterion
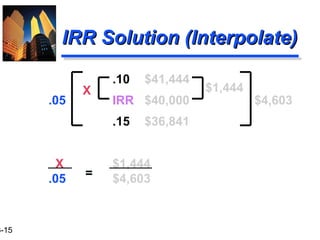
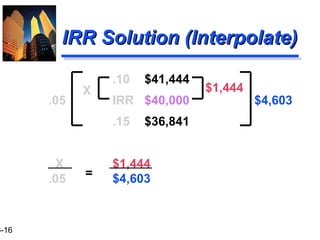
No! The firm will receive 11.57% for
each dollar invested in this project at
a cost of 13%. [ IRR < Hurdle Rate ]
The management of Basket Wonders
has determined that the hurdle rate
is 13% for projects of this type.
Should this project be accepted?](https://image.slidesharecdn.com/ch13-180315073226/85/Financial-Management-Slides-Ch-13-18-320.jpg)
![3-26
NPV Acceptance CriterionNPV Acceptance Criterion
No! The NPV is negative. This means
that the project is reducing shareholder
wealth. [RejectReject as NPVNPV < 00 ]
The management of Basket Wonders
has determined that the required
rate is 13% for projects of this type.
Should this project be accepted?](https://image.slidesharecdn.com/ch13-180315073226/85/Financial-Management-Slides-Ch-13-26-320.jpg)

![3-33
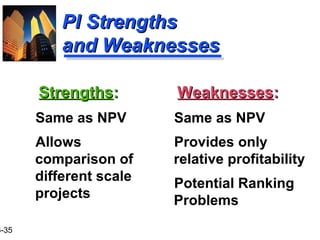
Profitability Index (PI)Profitability Index (PI)
PI is the ratio of the present value of
a project’s future net cash flows to
the project’s initial cash outflow.
CF1 CF2 CFn
(1+k)1
(1+k)2
(1+k)n
+ . . . ++ ICOICOPI =
PI = 1 + [ NPVNPV / ICOICO ]
<< OR >>](https://image.slidesharecdn.com/ch13-180315073226/85/Financial-Management-Slides-Ch-13-33-320.jpg)
![3-34
PI Acceptance CriterionPI Acceptance Criterion
No! The PIPI is less than 1.00. This
means that the project is not profitable.
[RejectReject as PIPI < 1.001.00 ]
PIPI = $38,572 / $40,000
= .9643 (Method #1, 13-33)
Should this project be accepted?](https://image.slidesharecdn.com/ch13-180315073226/85/Financial-Management-Slides-Ch-13-34-320.jpg)