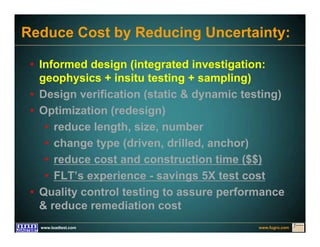
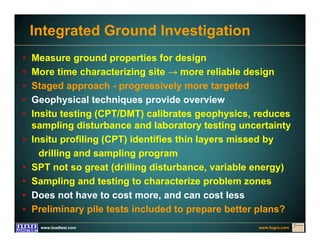
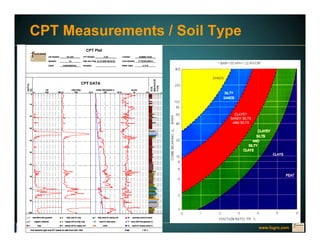
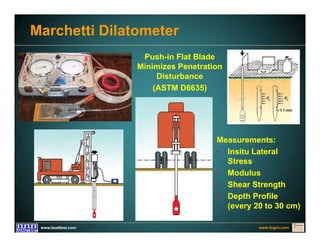
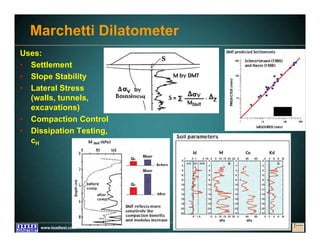
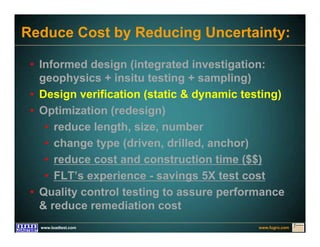
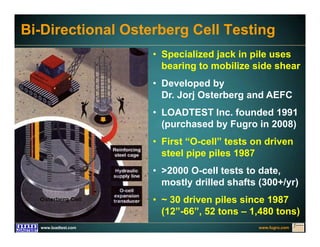
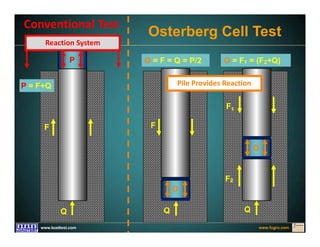
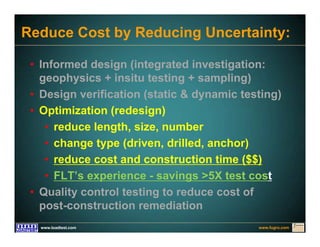
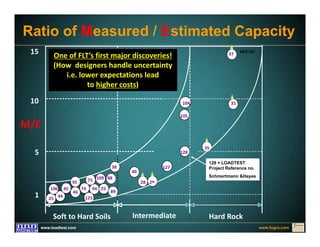
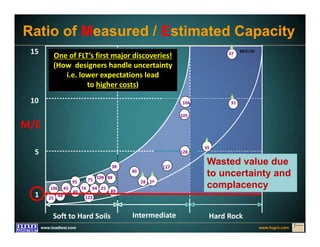
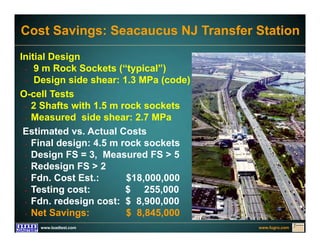
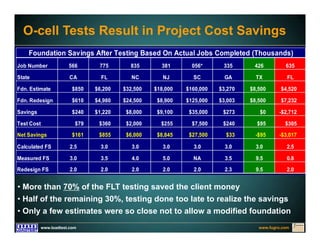
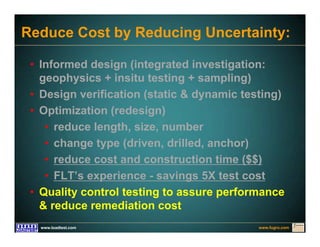
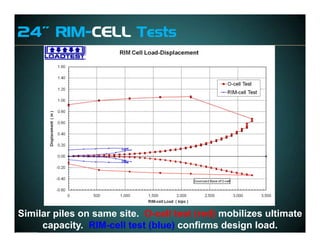
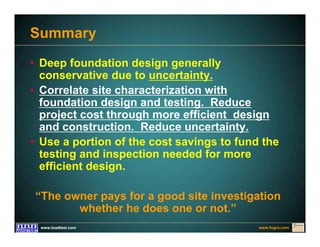
www.fugro.comwww.loadtest.com
Deep Foundation
Uncertainty and
Bi-Directional
Static Load
Testing
Paul J. Bullock, PhD
Fugro Consultants Inc.
Loadtest
www.fugro.comwww.loadtest.com
Deep
Foundations
Precast Concrete
H-pile
Cast-in-Place
Pipe
Timber
www.fugro.comwww.loadtest.com
Which Deep Foundation Type?
• Type of Load
(axial, lateral, torsion)
• Magnitude of Load
• Project Size & Complexity
• Site Conditions
• Environmental Conditions
• Local Availability & Price
• Familiarity (engineer, client) & complacency
• Foundation Cost Controlled by Uncertainty
(conservative design plus safety factor)
Engineering
Decisions
www.fugro.comwww.loadtest.com
Deep Foundation Design Uncertainty
• Site Variability
• Axial, lateral, depth to bearing stratum
• Strength, stiffness, test quality
• Typically test < 0.01% of site
• Design Method: RN = Rside + Rbase
• Calibration, empiricism, codes, resistance or
safety factors based on uncertainty
• Construction Quality
• Contractor experience
• Quality of supervision
www.fugro.comwww.loadtest.com
Reduce Cost by Reducing Uncertainty:
• Informed design (integrated investigation:
geophysics + insitu testing + sampling)
• Design verification (static & dynamic testing)
• Optimization (redesign)
• reduce length, size, number
• change type (driven, drilled, anchor)
• reduce cost and construction time ($$)
• FLT’s experience - savings 5X test cost
• Quality control testing to assure performance
& reduce remediation cost
www.fugro.comwww.loadtest.com
Integrated Ground Investigation
• Measure ground properties for design
• More time characterizing site → more reliable design
• Staged approach - progressively more targeted
• Geophysical techniques provide overview
• Insitu testing (CPT/DMT) calibrates geophysics, reduces
sampling disturbance and laboratory testing uncertainty
• Insitu profiling (CPT) identifies thin layers missed by
drilling and sampling program
• SPT not so great (drilling disturbance, variable energy)
• Sampling and testing to characterize problem zones
• Does not have to cost more, and can cost less
• Preliminary pile tests included to prepare better plans?
www.fugro.comwww.loadtest.com
Horizontal Distance, m
Depth,m
Sand
Silty Clay
Clayey
Sand
Sounding
Stopped
at 33.5 m
Silty Clay
Clayey
Sand
0 2010
CPT 03 qc, MPa
0
5
10
15
20
Sand
Clay
Silty
Clay
Sand
Clayey
Sand
Refusal
0 2010
CPT 01 qc, MPa
Depth,m
Time,ns
CPT 01
CPT 03
GPR
Example
UF
Insitu
Test
Site
www.fugro.comwww.loadtest.com
Electroresistivity
Electrical Resistivity Tomography Profile
www.fugro.comwww.loadtest.com
Electromagnetic Conductivity
Electromagnetic Conductivity Profile
www.fugro.comwww.loadtest.com
Sand
Overburden
Weathered
Bedrock
More
Competent
Bedrock
Bedrock Mapping
Seismic Refraction Tomography
www.fugro.comwww.loadtest.com
Insitu Cone Penetrometer Test (CPT)
• Robust push-in tool (ASTM D5778)
• Profiles penetration resistance
• Estimates soil type
• Undrained shear strength (clay)
• Friction angle (granular soils)
• Footing settlement, bearing pressure,
pile capacity
• Compaction quality control
• Depth to cavities or bearing stratum
• Optimize borehole program
www.fugro.comwww.loadtest.com
CPT Platforms
www.fugro.comwww.loadtest.com
CPT Measurements / Soil Type
www.fugro.comwww.loadtest.com
Marchetti Dilatometer
Push-in Flat Blade
Minimizes Penetration
Disturbance
(ASTM D6635)
Measurements:
• Insitu Lateral
Stress
• Modulus
• Shear Strength
• Depth Profile
(every 20 to 30 cm)Drill Rig
CPT Rig
www.fugro.comwww.loadtest.com
Marchetti Dilatometer
Uses:
• Settlement
• Slope Stability
• Lateral Stress
(walls, tunnels,
excavations)
• Compaction Control
• Dissipation Testing,
cH
www.fugro.comwww.loadtest.com
Reduce Cost by Reducing Uncertainty:
• Informed design (integrated investigation:
geophysics + insitu testing + sampling)
• Design verification (static & dynamic testing)
• Optimization (redesign)
• reduce length, size, number
• change type (driven, drilled, anchor)
• reduce cost and construction time ($$)
• FLT’s experience - savings 5X test cost
• Quality control testing to assure performance
& reduce remediation cost
www.fugro.comwww.loadtest.com
Top-down Static Load Test (ASTM D1143)
Design Optimization
requires load to failure
plus instrumentation
www.fugro.comwww.loadtest.com
Kentledge Collapse
Due to platform/ground failure
from FPS Load Testing Handbook 2006
www.fugro.comwww.loadtest.com
Reaction Beam Collapse
Due to tension bar failure
from FPS Load Testing Handbook 2006
www.fugro.comwww.loadtest.com
Bi-Directional Osterberg Cell Testing
• Specialized jack in pile uses
bearing to mobilize side shear
• Developed by
Dr. Jorj Osterberg and AEFC
• LOADTEST Inc. founded 1991
(purchased by Fugro in 2008)
• First “O-cell” tests on driven
steel pipe piles 1987
• >2000 O-cell tests to date,
mostly drilled shafts (300+/yr)
• ~ 30 driven piles since 1987
(12”-66”, 52 tons – 1,480 tons)
www.fugro.comwww.loadtest.com
P = F+Q
Conventional Test
F
Q
F
F1
Q
F2
Q
Osterberg Cell Test
O = F = Q = P/2 O = F1 = (F2+Q)
O
O
Pile Provides Reaction
Reaction System
P
www.fugro.comwww.loadtest.com
O-cell Features
• Robust for installation
• Aligned with pile axis
• Special seal for eccentricity
• Water used for hydraulic fluid
• Rated at 10,000 psi
• Calibrated by AEFC
(NIST Traceability)
• Linear & Repeatable
• Strain gauges
also confirm load
24” PHC Korea
www.fugro.comwww.loadtest.com
O-cell Instrumentation
• O-cell Pressure monitored
by gauge and transducer
• Pile Top Movement
• O-cell Expansion
Transducers
• O-cell Top Telltales
• Pile Bottom Telltales
• Embedded Strain Gauges
• Embedded Pile
Compression Transducers
www.fugro.comwww.loadtest.com
Pumps
Drilled Shaft O-cell Test Setup
The contractor can demobilize, saving time and money
www.fugro.comwww.loadtest.com
Typ. O-cell Test – No Reference Beams
Leica digital levels monitor targets on top of shaft directly.
Accuracy actually improved (Sinnreich, Simpson, DFI Journal, 2009).
www.fugro.comwww.loadtest.com
Driven Pile O-cell Test Setup
• ASTM D1143
Quick Test (new
standard coming)
• 20 Loads to failure
• 8 min load intervals
(identify creep limit)
• All instruments
monitored by
datalogger
• Real-time load
vs. deflection plot
• Reference beams
replaced by
electronic levels
www.fugro.comwww.loadtest.com
Load Transfer from O-cell & Strain Gauges
+465
+475
+485
+495
+505
+515
+525
+535
+545
+555
+565
+575
0 500 1,000 1,500 2,000 2,500
Elevation(ft)
O-cell Load ( kips )
Top of Shaft
Bottom of Shaft
1L-1 1L-3 1L-5 1L-7 1L-9
S. G. Level 6
S. G. Level 5
S. G. Level 2
S. G. Level 3
O-cell Load
1L-11 1L-13 1L-171L-15 1L-19
www.fugro.comwww.loadtest.com
Side Shear from Load Transfer
0.0
0.5
1.0
1.5
2.0
2.5
3.0
3.5
4.0
4.5
0.0 0.5 1.0 1.5 2.0 2.5
MobilizedNetUnitSideShear(ksf)
Upward Average Shear Zone Displacement ( in )
S.G. Level 6 to Zero Shear
S.G. Level 5 to S.G. Level 6
S.G. Level 3 to S.G. Level 5
S.G. Level 2 to S.G. Level 3
O-cell to S.G. Level 2
www.fugro.comwww.loadtest.com
O-cell Sizes
O-cell Size Rated Capacity Max. Test Load
6” 100 tons 200 tons
9” 225 tons 450 tons
13” 438 tons 875 tons
16” 700 tons 1400 tons
20” 1125 tons 2250 tons
24” 1550 tons 3100 tons
26” 1950 tons 3900 tons
34” 3000 tons 6000 tons
• Cells typically welded to load plates
• Cells can be grouped together
• 6” stroke standard, 9” stroke available
www.fugro.comwww.loadtest.com
Drilled Shaft O-cell Plate Assembly
Weld Top and Bottom Plates
to the O-cell
Weld O-cell Assembly to Rebar Cage
www.fugro.comwww.loadtest.com
Lifting the Cage and O-cell Assembly
Attach O-cell to Cage, lift carefully, place in shaft excavation
www.fugro.comwww.loadtest.com
Attaching O-cells to bottom plate
Multiple O-cell Assemblies
www.fugro.comwww.loadtest.com
Multiple O-cell Assemblies
Attaching O-cells to top plate
www.fugro.comwww.loadtest.com
Other O-cell Assemblies
O-cells placed at 2 levels to
isolate distinct shaft elements
Rebar cage not required
(save money and time)
www.fugro.comwww.loadtest.com
O-cells in CFA / ACIP Piles
www.fugro.comwww.loadtest.com
Maximum size/loads tested to date
Pile Diameter, mm 600 750 900 900
Pile Length, m 38 40 35 36
O-cell Diameter, mm 405 540 660 2x540
Mobilized Load, MN 17.5 32 32 46
O-cells in CFA / ACIP Piles
www.fugro.comwww.loadtest.com
Las Vegas
O-cells in Barrettes
www.fugro.comwww.loadtest.com
Alfaro’s Peak, Manila, Philippines
O-cells in Barrettes
www.fugro.comwww.loadtest.com
Barrettes - St. Petersburg, Russia
• 60 m deep
• 90 MN capacity
www.fugro.comwww.loadtest.com
O-cells in Driven Piles
O-cell cast into or welded
to pile before driving
O-cell grouted into pile
after driving
66” Cylinder Pile, Harrison County, MS30” PSC Pile, Morgan City, LA
www.fugro.comwww.loadtest.com
Example: 18” Steel Pipe Piles, MA
Saugus River Bridge Pines River Bridge
• Delmag
D62-22
• Refusal
10 blows
per 0.5”
• 142 tons
O-cell Load
• 0.28 tsf Side
Resistance
Failure
(0.3”)
• 80 tsf
End Bearing
(not failed)
• 284 tons
Capacity
• Delmag
D36-13
• Refusal
10 blows
per 0.5”
• 215 tons
O-cell Load
• 0.39 tsf Side
Resistance
Failure
(0.3”)
• 122 tsf
End Bearing
(not failed)
• 430 tons
Capacity
www.fugro.comwww.loadtest.com
FL Research Pile Setup
• Five 18” PSC Piles
• PDA Tests
• Long-term, staged
static tests (25)
• Osterberg Cell in tip
• Strain Gages
• Telltales
• Piezometers
• DMT Stress Cells Osterberg Cell
Cast Into Pile,
with XXS Pressure Pipe
to Top
Pile
Side
Shear
Pile End Bearing
O-cell® Top
Telltales Inside PVC
Pipe
O-cell® Bottom Telltale (through center of
pressure pipe)
Friction Collar
for Gage Support
O-cell®
Tee
(not to scale)
Dilatometer Cell (L)
& VW Piezometer (R)
on Pile Face
VW Strain Gage
(in pairs, tied to prestress
strands)
Hydraulic Pump
with Gage
& Piezometer
Wireline & Scale
www.fugro.comwww.loadtest.com
FL Research Pile Setup: O-cell
www.fugro.comwww.loadtest.com
0 50 100 150 200 250 300
0
500
1000
1500
2000
2500
Aucilla, Static Test
Aucilla, Dynamic Test
1 min
15 min
60 min
1727 days
Elapsed Time, t (days)
PileSideShearQS(kN)
Bullock et al. (1995) in FL
18” PSC, O-cell at bottom
FL Research Pile Setup – Arithmetic Plot
= 225 tons
www.fugro.comwww.loadtest.com
0.001 0.01 0.1 1 10 100 1000
0
500
1000
1500
2000
2500
Aucilla, Static Test
Aucilla, Dynamic Test
1 min
15 min
60 min
QS0 =1021 kN (at t0 = 1day )
mS = 293.4 kN
Elapsed Time, t (days)
PileSideShearQS(kN)
Bullock et al. (1995) in FL
18” PSC, O-cell at bottom
(EOID Capacity plotted at 1 min)
FL Research Pile Setup – Log-linear Plot
= 225 tons
www.fugro.comwww.loadtest.com
where: A = Dimensionless setup factor
QS = Side shear capacity at time t
QS0 = Side shear capacity at reference time t0
fS = Unit side shear capacity at time t
fS0 = Unit side shear capacity at reference time t0
t = Time elapsed since EOD, days
t0 = Reference time, recommended to use 1 day
mS = Semilog-linear slope of QS vs. log t
Note: “A” is correlated to soil type (0.1 to 0.8) and
describes the capacity increase per log cycle of time
(relative to the reference capacity)
1log1log
00000



















t
t
Q
m
t
t
A
f
f
Q
Q
S
S
S
S
S
S
Non-dimensional side shear setup:
www.fugro.comwww.loadtest.com
0.001 0.01 0.1 1 10 100 1000
0.0
0.2
0.4
0.6
0.8
1.0
1.2
1.4
1.6
1.8
2.0
2.2
Aucilla, Dynamic Test
Aucilla, Static Test
A = (mS / QS0) = 0.30
R2
= 0.99
1 min
15 min
60 min
Elapsed Time Ratio, ( t / t0 ) with t0 = 1 day
PileSideShearRatio,(Qs/Qs0)
Bullock et al. (1995) in FL
18” PSC, O-cell at bottom
+30%
+30%
+30%
Σ = +90% in 1 day
(or 9X 1 min capacity)
1-3d
+14 %
1-7d
+25%
1-28d +43% or
about half of
EOD-1d change
FL Research Pile – Non-dimensional Plot
www.fugro.comwww.loadtest.com
Example: Morgan City, LA - 30” PSC
• HPSI 2500, 300 bpf
• 30” PSC, 18” Void, 143 ft long
• Pile Setup Clay/Sand
• 950 ton O-cell
369 tons
at 1wk
416 tons
at 3 wks
464 tons
at 5 wksMax. O-cell Load 493 tons
Buoyant Pile Weight 29 tons
www.fugro.comwww.loadtest.com
Example: Busan, Korea - 24” PHC
• Prestressed Spun High Strength Conc.
• 24” OD, 16” ID, 103 ft long, 46 ft sections
• Sand / Clay / Sand
• 875 ton O-cell, 7 Strain Levels, Grouted
Buoyant Pile Weight 16 tons
Max. Side Shear 456 tons
Unit Side Shear 0.14 to 1.98 tsf
Max. O-cell Load 472 tons (944 ton test)
Max. End Bearing 155 tsf
www.fugro.comwww.loadtest.com
Example: Harrison County, MS - 66” Cylinder
• Conmaco 300, 128 bpf EOID
• 66” OD, 54” ID, 108 ft long
• Silt / Sand / Dense Sand
• 3000 ton O-cell, 4 Strain Levels
Buoyant Pile Weight 114 tons
Max. Side Shear 626 tons
Unit Side Shear 0.23 to 4.10 tsf
Max. End Bearing 45 tsf
Max. O-cell Load 740 tons (1480 ton test)
www.fugro.comwww.loadtest.com
O-cell Tests World-Wide
1-10
11-20
21-30
>30
0
Upcoming/In
progress
Key
www.fugro.comwww.loadtest.com
Carquinez Bridge, Vallejo, CA Benicia-Martinez Bridge
O-cell Application: Bridges
Sheik Zayed Bridge, UAE My Thuan Bridge, Vietnam
www.fugro.comwww.loadtest.com
Cooper River, SC Jiangsu Sutong, China
O-cell Application: Bridges
Confederation, PEI/NB Panama 2nd Bridge
www.fugro.comwww.loadtest.com
O-cell Applications: Buildings
Venetian Hotel
and Casino,
Las Vegas, NV
One Raffles
Quay,
Singapore
Four Seasons Hotel
Miami, FL
www.fugro.comwww.loadtest.com
O-cell Applications: Buildings UAE
23 Marina Tower
Al Rafi Towers
Infinity Tower
www.fugro.comwww.loadtest.com
• Test drilled shafts (wet/dry), CFA piles,
driven concrete or steel piles, barrettes
• Separates side shear & end bearing
• Very high load capability (321MN, St. Louis)
• Direct loading of rock socket
• Cost, safety, and space advantages
• No additional reaction system needed
• Doubles effective jack load
• Post-test grouting for production piles
O-cell Static Load Test Advantages
www.fugro.comwww.loadtest.com
Efficient O-cell Test Applications
• End bearing  side resistance (use ultimate!)
• Restricted site access (remote location, existing
structures, environmentally sensitive, water)
• Prove capacity distribution (end bearing vs. side
resistance, unit side resistance)
• Accelerated construction schedule
• Large test loads required
• Site safety restrictions (personnel & equipment)
• Repeated tests (setup)
• Multiple test piles (but only one test frame)
• Compare with total cost of conventional testing
www.fugro.comwww.loadtest.com
• Pile preselected for testing
• Maximum load limited by the weaker of the
end bearing or side shear (add top load?)
• Top of pile not structurally tested
• Subtract buoyant weight of pile above O-cell
to calculate side resistance
• Must construct equivalent top load
movement curve
• use the sum of measured behavior
• use the sum of modeled behavior
• use finite element or t-z approach
O-cell Test Limitations
www.fugro.comwww.loadtest.com
Typical O-cell Test Result
(1 MN = 112.4 tons)
2,700 tons
www.fugro.comwww.loadtest.com
Equivalent Top-Load Curve
www.fugro.comwww.loadtest.com
Equiv. Top-Load + Elastic Shortening
www.fugro.comwww.loadtest.com
Reduce Cost by Reducing Uncertainty:
• Informed design (integrated investigation:
geophysics + insitu testing + sampling)
• Design verification (static & dynamic testing)
• Optimization (redesign)
• reduce length, size, number
• change type (driven, drilled, anchor)
• reduce cost and construction time ($$)
• FLT’s experience - savings >5X test cost
• Quality control testing to reduce cost of
post-construction remediation
www.fugro.comwww.loadtest.com
25 44
45
46
95
74
123
94
75
25
109 88
89
40
28 29
127
128
105
104
35
37
31
M/E=25
106
38
Ratio of Measured / Estimated Capacity
128 = LOADTEST
Project Reference no.
Schmertmann &Hayes
M/E
1
5
10
15
Soft to Hard Soils Intermediate Hard Rock
One of FLT’s first major discoveries! 
(How  designers handle uncertainty  
i.e. lower expectations lead              
to higher costs)
www.fugro.comwww.loadtest.com
25
44
45
46
95
74
123
94
75
25
109 88
89
40
28 29
127
128
105
104
35
37
31
M/E=25
106
38
1
5
10
15
Wasted value due
to uncertainty and
complacency
Ratio of Measured / Estimated Capacity
M/E
Soft to Hard Soils Intermediate Hard Rock
One of FLT’s first major discoveries! 
(How  designers handle uncertainty  
i.e. lower expectations lead              
to higher costs)
www.fugro.comwww.loadtest.com
Initial Design
• 9 m Rock Sockets (“typical”)
• Design side shear: 1.3 MPa (code)
O-cell Tests
• 2 Shafts with 1.5 m rock sockets
• Measured side shear: 2.7 MPa
Estimated vs. Actual Costs
• Final design: 4.5 m rock sockets
• Design FS = 3, Measured FS > 5
• Redesign FS > 2
• Fdn. Cost Est.: $18,000,000
• Testing cost: $ 255,000
• Fdn. redesign cost: $ 8,900,000
• Net Savings: $ 8,845,000
Cost Savings: Seacaucus NJ Transfer Station
www.fugro.comwww.loadtest.com
Job Number 566 775 835 381 056* 335 426 635
State CA FL NC NJ SC GA TX FL
Fdn. Estimate $850 $6,200 $32,500 $18,000 $160,000 $3,270 $8,500 $4,520
Fdn. Redesign $610 $4,980 $24,500 $8,900 $125,000 $3,003 $8,500 $7,232
Savings $240 $1,220 $8,000 $9,100 $35,000 $273 $0 -$2,712
Test Cost $79 $360 $2,000 $255 $7,500 $240 $95 $305
Net Savings $161 $855 $6,000 $8,845 $27,500 $33 -$95 -$3,017
Calculated FS 2.5 3.0 3.0 3.0 3.0 3.0 3.0 2.5
Measured FS 3.0 3.5 4.0 5.0 NA 3.5 9.5 0.8
Redesign FS 2.0 2.0 2.0 2.0 2.0 2.3 9.5 2.0
Foundation Savings After Testing Based On Actual Jobs Completed (Thousands)
• More than 70% of the FLT testing saved the client money
• Half of the remaining 30%, testing done too late to realize the savings
• Only a few estimates were so close not to allow a modified foundation
O-cell Tests Result in Project Cost Savings
www.fugro.comwww.loadtest.com
Reduce Cost by Reducing Uncertainty:
• Informed design (integrated investigation:
geophysics + insitu testing + sampling)
• Design verification (static & dynamic testing)
• Optimization (redesign)
• reduce length, size, number
• change type (driven, drilled, anchor)
• reduce cost and construction time ($$)
• FLT’s experience - savings 5X test cost
• Quality control testing to assure performance
& reduce remediation cost
www.fugro.comwww.loadtest.com
Deep Foundation Quality Control
• Driven Piles
• Blow Count, Hammer Energy, Dynamic Tests
• Drilled Shafts
• Control Slurry Properties
• Prepare Excavation Log
• Shaft Profile - Sonic Caliper
• Clean Shaft Bottom
– MiniSID, Downhole Camera
• Concrete Quality - Pile Integrity Test,
Crosshole Sonic Logging, Thermal, Gamma
• Verify Pile Capacity using RIM-cell
www.fugro.comwww.loadtest.com
Shaft Profile - SONICALIPER
www.fugro.comwww.loadtest.com
Uses sound reflection
360°profile of shaft walls
Checks hole verticality and drift
Real-time results
6 mm Accuracy, 3-D modeling
Portable and compact
Minimal impact to schedule
Shaft Profile - SONICALIPER
www.fugro.comwww.loadtest.com
• Verticality
• Cage Encroachment
• Calculate Concrete
Volume
Shaft Profile Report - SONICALIPER
www.fugro.comwww.loadtest.com
Shaft Volume - SONICALIPER
www.fugro.comwww.loadtest.com
• RIM-cell pressurizes pile cross-section
• Full-scale static bi-directional load test
• Install a RIM-cell in any pile
• Economical testing
• QA/QC device eliminates uncertainty
• End-bearing engaged during test,
stiffens shaft response under load
RIM-CELL
60” RIM-cell
www.fugro.comwww.loadtest.com
Cross-section of a RIM-cell installed at the shaft toe.
RIM-CELL
TESTING
www.fugro.comwww.loadtest.com
The RIM-cell confines the fluid pressure, creating a hydraulic
cylinder at the shaft toe capable of applying high static loads.
RIM-CELL
TESTING
www.fugro.comwww.loadtest.com
Fluid grout is pumped through the hydraulic hoses creating a
fracture across the shaft, pressurized within the RIM-cell.
RIM-CELL
TESTING
www.fugro.comwww.loadtest.com
As the internal grout sets, more grout is pumped into
external pipes to fill the annular fracture around the RIM-cell.
RIM-CELL
TESTING
www.fugro.comwww.loadtest.com
RIM-CELL Applications
• PROOF TEST
• Install in every pile
• Load shafts to design load or
higher (2000 – 5000 psi)
• Eliminate uncertainty of site
variability
• Use higher LRFD factors
• Detect / remediate a “soft toe”
• POST-STRESSING
• Consolidate loose material at
shaft toe
• Engage end bearing without
losing side shear
• Limit settlement at service load
www.fugro.comwww.loadtest.com
RIM-CELL Assembly
RIM-cell fits inside reinforcing cage.
Hydraulic hoses and instrumentation
pipe installed on cage. Add strain
gages to isolate different soil strata.
RIM-cell welded to frame
below O-cell assembly for a
multi-level test shaft.
24” RIM-cell installed with
8 levels of strain gages
60” RIM-cell
www.fugro.comwww.loadtest.com
Excavate shaft and place cage with
RIM-cell. Large center opening
allows tremie pipe to pass. Low
cross-sectional area does not inhibit
concrete flow or trap weak material.
RIM-CELL Installation
60” RIM-cell installed into
78” rock socket
24” RIM-cell at toe of
an O-cell test shaft
20” RIM-cell installed
at the toe of 30” shaft
www.fugro.comwww.loadtest.com
Perform test after concrete obtains strength. Cement grout
is mixed and pumped through the hydraulic hoses into the
RIM-cell. Measured pressure is converted to load using
calibration factor of the RIM-cell. Load is increased to 1.2
to 1.5 times design load. Shaft movement is measured and
recorded. Grout will set up to restore integrity to the shaft.
24” RIM-cell Test Curve 36” RIM-cell Test Curve
RIM-CELL Testing
www.fugro.comwww.loadtest.com
Similar to O-cell with real-time
Load-Displacement plot during
test. Preliminary results
available same day as test.
RIM-CELL Reporting
60” RIM-cell
Schematic
section of
RIM-cell
shaft
Equivalent Top Load Plot
www.fugro.comwww.loadtest.com
RIM-CELL Limitations
• Internal friction unknown (but small)
• Preselect shaft
(install in every shaft, test as required)
• Reduced pressure vs. O-cell
(but large area)
• Typically will not test to failure
• Grouting required to restore shaft integrity
• Maximum load limited by the weaker of the
end bearing or side shear (add top load?)
• Top of pile not structurally tested
www.fugro.comwww.loadtest.com
Missouri Research
Project
• 24” bi-directional test piles
on two different sites
• Two piles on each site were
tested using RIM-cells
• 24” RIM-cells in 36” piles
• 20-30 feet deep shafts in
unweathered and weathered
shale
• Side by side comparison to
O-cell tests
24” (600mm) RIM-CELL Tests
www.fugro.comwww.loadtest.com
24” RIM-CELL Tests
Similar piles on same site. O-cell test (red) mobilizes ultimate
capacity. RIM-cell test (blue) confirms design load.
www.fugro.comwww.loadtest.com
RIM-CELL Tests to Date
RIM‐cell 
Size
Shaft Diameter
Max 
Pressure
Max Cell 
Load
Test Result 
14" 24" 2500 psi 350 kips Side Shear Failure
14" 24" 1780 psi 250 kips End Bearing Failure
20" 30" 1530 psi 450 kips Side Shear Failure
20" 30" 1360 psi 400 kips Side Shear Failure
24" 36" 2560 psi 1100 kips RIM‐cell Capacity Maxed Out
24" 36" 1980 psi 850 kips RIM‐cell Capacity Maxed Out
24" 36" 640 psi 275 kips  End Bearing Failure
24" 36" 1170 psi 500 kips End Bearing Failure
24" 30" 940 psi 400 kips Test stopped at 1" Expansion
36" 54" 475 psi 450 kips Side Shear Failure
60"
96" 
(76"rock socket) 4950 psi 13,000 kips Test stopped at 1/2" Expansion
www.fugro.comwww.loadtest.com
Summary
• O-cell test proven for shafts and driven piles
• Compare overall cost and quality of test
results for conventional top-down testing
with O-cell testing
• RIM-CELL tests to verify production pile
capacity (QA/QC)
• Coming Attractions:
• New ASTM Standard
• Bigger piles, higher loads
• Mid-pile O-cell placement for spliced
concrete piles
• Mid-pile placement for steel pipe piles
www.fugro.comwww.loadtest.com
Summary
• Deep foundation design generally
conservative due to uncertainty.
• Correlate site characterization with
foundation design and testing. Reduce
project cost through more efficient design
and construction. Reduce uncertainty.
• Use a portion of the cost savings to fund the
testing and inspection needed for more
efficient design.
“The owner pays for a good site investigation
whether he does one or not.”
www.fugro.comwww.loadtest.com
Thank You
www.loadtest.com
www.fugro.com

Bullock bidirectional testing