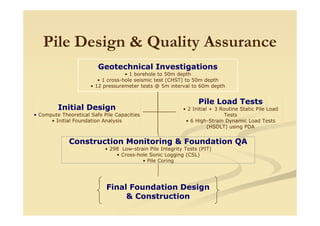
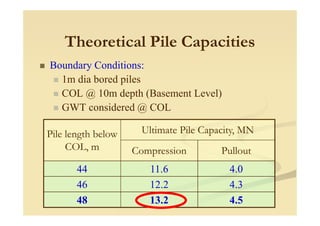
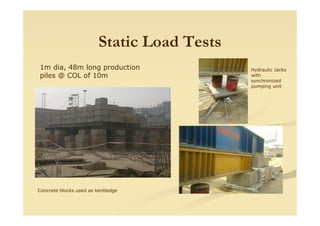
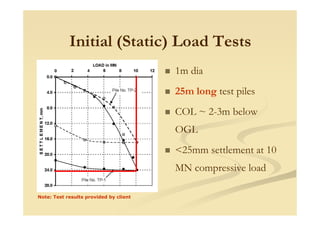
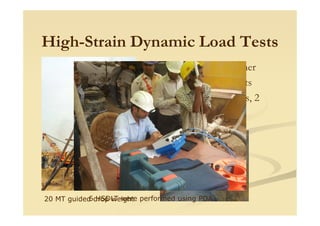
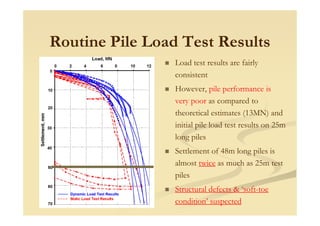
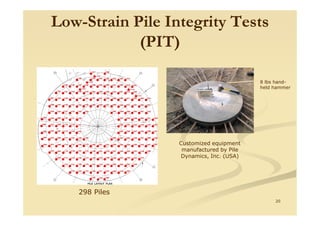
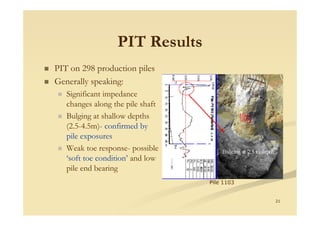
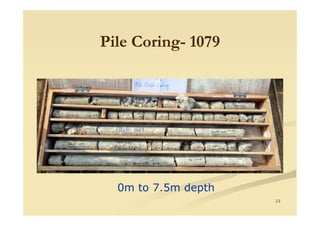
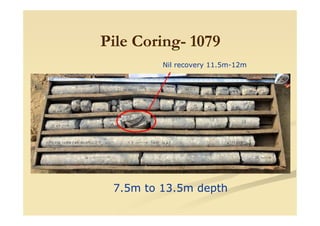
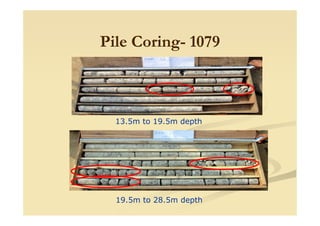
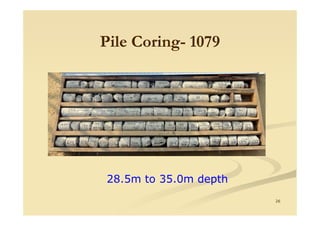
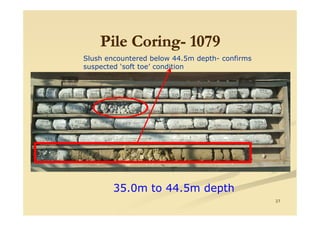
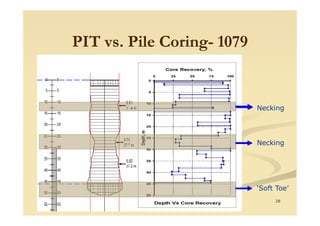
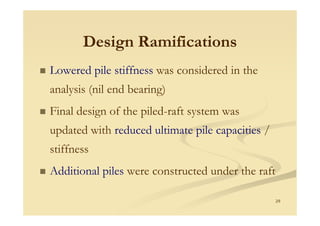
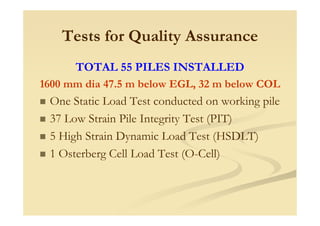
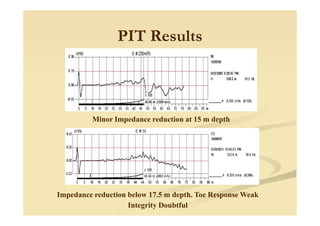
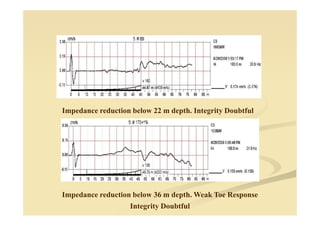
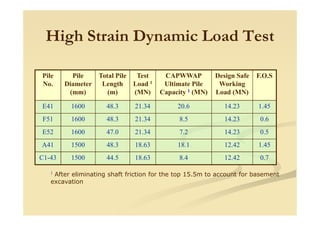
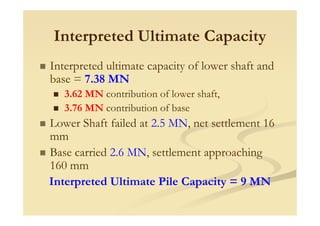
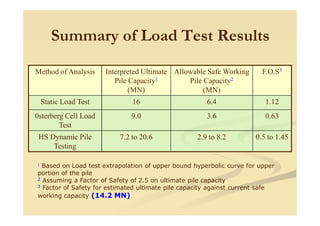
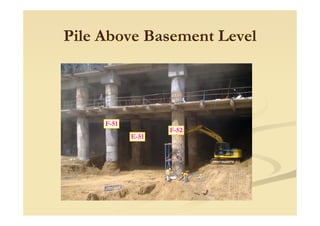
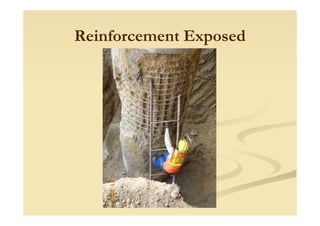
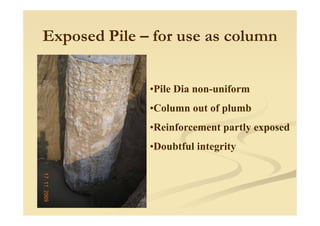
Identifying Defects in Large
Diameter Bored Piles
- Case Studies
Ravi Sundaram & Sorabh Gupta
CENGRS GEOTECHNICA PVT. LTD.
DFI India 2014
Identifying Defects
Identifying possible presence of defects is the first
step in ensuring good quality piles and safety of
structure
Load tests on a small percentage of the piles installedp g p
– randomly selected - could be misleading
Construction quality (not just load carrying capacity)
is important for ensuring long term behaviour
Necessary remedial measures can be taken up before
the superstructure construction – ENSURE NO
FAILURES
Quality Assurance-Pile Construction
Static Load Tests
Low Strain Integrity Tests
High Strain Dynamic Pile Load Test
Osterberg Cell Load Test
Cross-Hole Test
Coring through Pile
Two case studies are presented to
demonstrate use of quality assurance
tests to identify defects in piles
Project Location – Noida, U.P.
7 km
2 km
7 km
2 km
7 km7 km
2 km
7 km
2 km
7 km
2 km
7 km
2 km
Project Details
66-story residential tower-
240 m high
Double Basement (9m below
grade)
3,400 m2 circular footprintp
Foundation System
Piled-raft;
2.5m thick Raft @ 9m depth
298 bored piles of 1m dia and
48m length
Construction is presently
underway!
Pile Design & Quality Assurance
Geotechnical Investigations
• 1 borehole to 50m depth
• 1 cross-hole seismic test (CHST) to 50m depth
• 12 pressuremeter tests @ 5m interval to 60m depth
Pile Load Tests
• 2 Initial + 3 Routine Static Pile LoadInitial Design
C Th i l S f Pil C i i
Construction Monitoring & Foundation QA
• 298 Low-strain Pile Integrity Tests (PIT)
• Cross-hole Sonic Logging (CSL)
• Pile Coring
Tests
• 6 High-Strain Dynamic Load Tests
(HSDLT) using PDA
Final Foundation Design
& Construction
• Compute Theoretical Safe Pile Capacities
• Initial Foundation Analysis
Plan of Field InvestigationPlan of Field Investigation
Borehole Data
Medium dense to
dense alluvial sand to
37m depth
Hard clay to 41-50m
d thdepth
Very dense sands /
silt (N>100) to 60 m
depth
GW at 11m depth
below OGL
Pressuremeter Test DataPressuremeter Test Data
CrossCross--hole Seismic Testhole Seismic Test
Olson® Freedom Data PC with
PSV Source and down-hole
triaxial geophones Test Setup
Time Domain Data FromCh: 5 , x= 16200 ,y =-1
0 20000 40000 60000 80000 100000
-10
-5
0
5
10
Time Domain Data fromCh: 6 x= 4980.
0
2
SV-Shear Wave
Arrival
P- Compressional
Wave Arrival
12
0 20000 40000 60000 80000 100000
-2
Time Domain Data FromCh: 8 , x =2340 , y =0
0 20000 40000 60000 80000 100000
-0.05
0
0.05
Wave Arrival
P-SV Source
Trigger Pulse
CrossCross--hole Seismic Test Resultshole Seismic Test Results
Design ProfileDesign Profile
Theoretical Pile Capacities
Boundary Conditions:
1m dia bored piles
COL @ 10m depth (Basement Level)
GWT considered @ COL@
Pile length belowPile length below
COL, mCOL, m
Ultimate Pile Capacity, MNUltimate Pile Capacity, MN
CompressionCompression PulloutPullout
44 11.6 4.0
46 12.2 4.3
48 13.2 4.5
Static Load Tests
1m dia, 48m long production
piles @ COL of 10m
Hydraulic Jacks
with
synchronized
pumping unit
Concrete blocks used as kentledge
Initial (Static) Load Tests
1m dia
25m long test piles
COL ~ 2-3m belowCOL 2 3m below
OGL
<25mm settlement at 10
MN compressive load
Note: Test results provided by client
High-Strain Dynamic Load Tests
20 MT drop hammer
0.5-3m drop heights
4-strain transducers, 2
accelerometersaccelerometers
20 MT guided drop weight6 HSDLT were performed using PDA
Routine Pile Load Test ResultsRoutine Pile Load Test Results
Load test results are fairly
consistent
However, pile performance is
very poor as compared to
theoretical estimates (13MN) andtheoretical estimates (13MN) and
initial pile load test results on 25m
long piles
Settlement of 48m long piles is
almost twice as much as 25m test
piles
Structural defects & ‘soft-toe
condition’ suspected
LowLow--Strain Pile Integrity TestsStrain Pile Integrity Tests
(PIT)(PIT)
8 lbs hand-
held hammer
20
Customized equipment
manufactured by Pile
Dynamics, Inc. (USA)
298 Piles
PIT ResultsPIT Results
PIT on 298 production piles
Generally speaking:
Significant impedance
changes along the pile shaft
21
Bulging at shallow depths
(2.5-4.5m)- confirmed by
pile exposures
Weak toe response- possible
‘soft toe condition’ and low
pile end bearing
Pile 1103
PIT: Profile AnalysisPIT: Profile Analysis-- Pile 1079Pile 1079
22Pile No. 1079
Pile CoringPile Coring-- 10791079
23
0m to 7.5m depth
Pile CoringPile Coring-- 10791079
Nil recovery 11.5m-12m
7.5m to 13.5m depth
Pile CoringPile Coring-- 10791079
13.5m to 19.5m depth
19.5m to 28.5m depth
Pile CoringPile Coring-- 10791079
26
28.5m to 35.0m depth
Pile CoringPile Coring-- 10791079Pile CoringPile Coring-- 10791079Pile CoringPile Coring-- 10791079
Slush encountered below 44.5m depth- confirms
suspected ‘soft toe’ condition
27
35.0m to 44.5m depth
PIT vs. Pile CoringPIT vs. Pile Coring-- 10791079
Necking
28
NeckingNecking
‘Soft Toe’
Design RamificationsDesign Ramifications
Lowered pile stiffness was considered in the
analysis (nil end bearing)
Final design of the piled-raft system was
29
Final design of the piled raft system was
updated with reduced ultimate pile capacities /
stiffness
Additional piles were constructed under the raft
Layout Plan
Commercial Complex / Hotel atCommercial Complex / Hotel at
Dwarka, New DelhiDwarka, New Delhi
5 star hotel-cum-
commercial complex
Three basements –
basement floor at 15.5 m
depth
Planned as TOP-
DOWN construction to
speed up construction
Stratigraphy
Indo-Gangetic Alluvium
Deposits consist primarily of
sandy silt (Delhi Silt) of low
plasticity with minor silty
sand layers
SPT values:SPT values:
0-7 m depth: 14-36
7-13 m depth: 30-47
13-20 m depth: 39-66
20-60 m depth: > 100
Groundwater Level: 21.2 m
depth (Feb 2009)
Design Profile
Depth Stratum c
kN/m2
φ◦ γ kN/m3
0.0 15.5 Sandy Silt/Clayey
Silt
Above Cut-off Level
15 0 25 0 Very dense Sandy 300 0 1915.0 25.0 Very dense Sandy
Silt/Clayey Silt
300 0 19
25.0 40.0 Very dense Sandy
Silt/Clayey Silt
0 31 19.5
40.0 60.0 Very dense Sandy
Silt
0 33 20
Design Water Table level considered at 15 m depth
Computed Static Pile Capacities
Pile Dia.
(mm)
Pile Length Below
Cut-Off Level1
(m)
Computed safe axial
compressive pile capacity2 (MN)
1600 25 (40.5) 11.79
27 (42.5) 12.49
30 (45.5) 13.54
32 (47.5) 14.23
1 Pile cut-off level is considered at 15.5 m below Ground Level. Pile
lengths from ground level are presented in brackets
2 Design safe working loads include a Factor of Safety of 2.5
Construction Sequence
Install 1600 mm diameter deep bored cast in-situ
piles from ground level
After piles are installed, excavation for basement
shall be taken upshall be taken up
Portion of pile above basement level shall act as
column, that below basement shall contribute to
pile capacity
Construction of superstructure shall be taken up
simultaneously
Tests for Quality Assurance
TOTAL 55 PILES INSTALLED
1600 mm dia 47.5 m below EGL, 32 m below COL
One Static Load Test conducted on working pile
37 Low Strain Pile Integrity Test (PIT)
5 High Strain Dynamic Load Test (HSDLT)
1 Osterberg Cell Load Test (O-Cell)
PIT Results
Minor Impedance reduction at 15 m depth
Impedance reduction below 17.5 m depth. Toe Response Weak
Integrity Doubtful
Impedance reduction below 22 m depth. Integrity Doubtful
Impedance reduction below 36 m depth. Weak Toe Response
Integrity Doubtful
Impedance reduction below 22 m depth. Integrity Doubtful
High Strain Dynamic Load Test
Pile
No.
Pile
Diameter
(mm)
Total Pile
Length
(m)
Test
Load 1
(MN)
CAPWWAP
Ultimate Pile
Capacity 1 (MN)
Design Safe
Working
Load (MN)
F.O.S
E41 1600 48.3 21.34 20.6 14.23 1.45
F51 1600 48.3 21.34 8.5 14.23 0.6
E52 1600 47.0 21.34 7.2 14.23 0.5
A41 1500 48.3 18.63 18.1 12.42 1.45
C1-43 1500 44.5 18.63 8.4 12.42 0.7
1 After eliminating shaft friction for the top 15.5m to account for basement
excavation
CAPWAP Analysis: Pile E-52
Interpreted Ultimate Capacity: 7.2 MN
CAPWAP Analysis: Pile C1-43
Interpreted Ultimate Capacity: 9.6 MN
Osterberg Cell Bi-Directional Load Test
Test pile – boring done to
48.8 m depth, concreting
done to 8.3 m depth below
GL
Pile length 39.6 m,
effectively 33.3 m below
COL
O-Cells installed at 40.5 m
depth below GL i.e. 8.3 m
above pile toe
O-Cell Test Results
O-Cell loaded in 8 increments to maximum bi-
directional load of 5.1 MN, each load increment
held for 10 min
At 5.1 MN, lower portion of pile reached ultimate
capacity maximum O-Cell expansion of 150 mmcapacity, maximum O Cell expansion of 150 mm
was exceeded
Average downward movement of O-Cells base
148.8 mm
Adjusting for buoyancy, net upward load applied on
the upper portion of the pile is 4.1 MN and the net
O-Cell extension was 1.1 mm
Interpreted Ultimate Capacity
Interpreted ultimate capacity of lower shaft and
base = 7.38 MN
3.62 MN contribution of lower shaft,
3.76 MN contribution of base
Lower Shaft failed at 2.5 MN, net settlement 16
mm
Base carried 2.6 MN, settlement approaching
160 mm
Interpreted Ultimate Pile Capacity = 9 MN
Summary of Load Test Results
Method of Analysis Interpreted Ultimate
Pile Capacity1
(MN)
Allowable Safe Working
Pile Capacity2
(MN)
F.O.S3
Static Load Test 16 6.4 1.12
0sterberg Cell Load
Test
9.0 3.6 0.63
HS Dynamic Pile
Testing
7.2 to 20.6 2.9 to 8.2 0.5 to 1.45
1 Based on Load test extrapolation of upper bound hyperbolic curve for upper
portion of the pile
2 Assuming a Factor of Safety of 2.5 on ultimate pile capacity
3 Factor of Safety for estimated ultimate pile capacity against current safe
working capacity (14.2 MN)
Pile Above Basement LevelPile Above Basement Level
FF--5151
FF--5252
EE--5151
Quality of Piles Exposed above
Basement Level
Pile diameter not uniform, substantial bulging
observed in some piles
Reinforcement exposed, bent
C f il / l b fl l lCentre of pile / column at basement floor level
was off by over 500 mm in some cases
Some piles were visually out of plumb, so using
as column was aesthetically unpleasant
Reinforcement Exposed
Exposed Pile – for use as column
•Pile Dia non-uniform
•Column out of plumbp
•Reinforcement partly exposed
•Doubtful integrity
Repair Work in Progress
Safe Pile Capacities DeSafe Pile Capacities De--RatedRated
Additional piles installed below basement levelAdditional piles installed below basement level
PiledPiled--Raft analysis done to assess the overallRaft analysis done to assess the overall
settlement and safety of the foundation systemsettlement and safety of the foundation system
Of course it led to contractual issuesOf course it led to contractual issuesOf course it led to contractual issuesOf course it led to contractual issues
Blame all involvedBlame all involved –– soil consultant, structuralsoil consultant, structural
consultant, building contractor, piling agencyconsultant, building contractor, piling agency –– allall
were under scrutinywere under scrutiny
Client suffered!!Client suffered!! –– Project delayed, resulted inProject delayed, resulted in
indirect lossesindirect losses
Conclusions
“There is many a slip twixt the cup and the lip”
A well-planned, comprehensive Foundation QA program is essential to
deliver foundation performance and avert disaster
Avoid the BLAME GAME and resolve the problem to ensure safety
Keep the geotechnical and structural engineers involved throughout the
foundation construction process
53
foundation construction process
Just doing the tests is not enough!
Proper interpretation of the test results by an independent agency of
repute
Correlate all information and test results- geotechnical data, pour card
information, test results, etc.
Improve the design as well as the construction methodology in parallel to
get maximum benefit
Let us Strive to Achieve..
Quality in Pile Construction
THANK YOU…THANK YOU…
54
THANK YOU…THANK YOU…
54
Cengrs Geotechnica Pvt. LtdCENGRS GEOTECHNICA PVT. LTD.

DFI india 2014 defects in piles

  • 1.
    Identifying Defects inLarge Diameter Bored Piles - Case Studies Ravi Sundaram & Sorabh Gupta CENGRS GEOTECHNICA PVT. LTD. DFI India 2014
  • 2.
    Identifying Defects Identifying possiblepresence of defects is the first step in ensuring good quality piles and safety of structure Load tests on a small percentage of the piles installedp g p – randomly selected - could be misleading Construction quality (not just load carrying capacity) is important for ensuring long term behaviour Necessary remedial measures can be taken up before the superstructure construction – ENSURE NO FAILURES
  • 3.
    Quality Assurance-Pile Construction StaticLoad Tests Low Strain Integrity Tests High Strain Dynamic Pile Load Test Osterberg Cell Load Test Cross-Hole Test Coring through Pile Two case studies are presented to demonstrate use of quality assurance tests to identify defects in piles
  • 5.
    Project Location –Noida, U.P. 7 km 2 km 7 km 2 km 7 km7 km 2 km 7 km 2 km 7 km 2 km 7 km 2 km
  • 6.
    Project Details 66-story residentialtower- 240 m high Double Basement (9m below grade) 3,400 m2 circular footprintp Foundation System Piled-raft; 2.5m thick Raft @ 9m depth 298 bored piles of 1m dia and 48m length Construction is presently underway!
  • 7.
    Pile Design &Quality Assurance Geotechnical Investigations • 1 borehole to 50m depth • 1 cross-hole seismic test (CHST) to 50m depth • 12 pressuremeter tests @ 5m interval to 60m depth Pile Load Tests • 2 Initial + 3 Routine Static Pile LoadInitial Design C Th i l S f Pil C i i Construction Monitoring & Foundation QA • 298 Low-strain Pile Integrity Tests (PIT) • Cross-hole Sonic Logging (CSL) • Pile Coring Tests • 6 High-Strain Dynamic Load Tests (HSDLT) using PDA Final Foundation Design & Construction • Compute Theoretical Safe Pile Capacities • Initial Foundation Analysis
  • 8.
    Plan of FieldInvestigationPlan of Field Investigation
  • 9.
    Borehole Data Medium denseto dense alluvial sand to 37m depth Hard clay to 41-50m d thdepth Very dense sands / silt (N>100) to 60 m depth GW at 11m depth below OGL
  • 10.
  • 11.
    CrossCross--hole Seismic TestholeSeismic Test Olson® Freedom Data PC with PSV Source and down-hole triaxial geophones Test Setup
  • 12.
    Time Domain DataFromCh: 5 , x= 16200 ,y =-1 0 20000 40000 60000 80000 100000 -10 -5 0 5 10 Time Domain Data fromCh: 6 x= 4980. 0 2 SV-Shear Wave Arrival P- Compressional Wave Arrival 12 0 20000 40000 60000 80000 100000 -2 Time Domain Data FromCh: 8 , x =2340 , y =0 0 20000 40000 60000 80000 100000 -0.05 0 0.05 Wave Arrival P-SV Source Trigger Pulse
  • 13.
    CrossCross--hole Seismic TestResultshole Seismic Test Results
  • 14.
  • 15.
    Theoretical Pile Capacities BoundaryConditions: 1m dia bored piles COL @ 10m depth (Basement Level) GWT considered @ COL@ Pile length belowPile length below COL, mCOL, m Ultimate Pile Capacity, MNUltimate Pile Capacity, MN CompressionCompression PulloutPullout 44 11.6 4.0 46 12.2 4.3 48 13.2 4.5
  • 16.
    Static Load Tests 1mdia, 48m long production piles @ COL of 10m Hydraulic Jacks with synchronized pumping unit Concrete blocks used as kentledge
  • 17.
    Initial (Static) LoadTests 1m dia 25m long test piles COL ~ 2-3m belowCOL 2 3m below OGL <25mm settlement at 10 MN compressive load Note: Test results provided by client
  • 18.
    High-Strain Dynamic LoadTests 20 MT drop hammer 0.5-3m drop heights 4-strain transducers, 2 accelerometersaccelerometers 20 MT guided drop weight6 HSDLT were performed using PDA
  • 19.
    Routine Pile LoadTest ResultsRoutine Pile Load Test Results Load test results are fairly consistent However, pile performance is very poor as compared to theoretical estimates (13MN) andtheoretical estimates (13MN) and initial pile load test results on 25m long piles Settlement of 48m long piles is almost twice as much as 25m test piles Structural defects & ‘soft-toe condition’ suspected
  • 20.
    LowLow--Strain Pile IntegrityTestsStrain Pile Integrity Tests (PIT)(PIT) 8 lbs hand- held hammer 20 Customized equipment manufactured by Pile Dynamics, Inc. (USA) 298 Piles
  • 21.
    PIT ResultsPIT Results PITon 298 production piles Generally speaking: Significant impedance changes along the pile shaft 21 Bulging at shallow depths (2.5-4.5m)- confirmed by pile exposures Weak toe response- possible ‘soft toe condition’ and low pile end bearing Pile 1103
  • 22.
    PIT: Profile AnalysisPIT:Profile Analysis-- Pile 1079Pile 1079 22Pile No. 1079
  • 23.
    Pile CoringPile Coring--10791079 23 0m to 7.5m depth
  • 24.
    Pile CoringPile Coring--10791079 Nil recovery 11.5m-12m 7.5m to 13.5m depth
  • 25.
    Pile CoringPile Coring--10791079 13.5m to 19.5m depth 19.5m to 28.5m depth
  • 26.
    Pile CoringPile Coring--10791079 26 28.5m to 35.0m depth
  • 27.
    Pile CoringPile Coring--10791079Pile CoringPile Coring-- 10791079Pile CoringPile Coring-- 10791079 Slush encountered below 44.5m depth- confirms suspected ‘soft toe’ condition 27 35.0m to 44.5m depth
  • 28.
    PIT vs. PileCoringPIT vs. Pile Coring-- 10791079 Necking 28 NeckingNecking ‘Soft Toe’
  • 29.
    Design RamificationsDesign Ramifications Loweredpile stiffness was considered in the analysis (nil end bearing) Final design of the piled-raft system was 29 Final design of the piled raft system was updated with reduced ultimate pile capacities / stiffness Additional piles were constructed under the raft
  • 31.
  • 32.
    Commercial Complex /Hotel atCommercial Complex / Hotel at Dwarka, New DelhiDwarka, New Delhi 5 star hotel-cum- commercial complex Three basements – basement floor at 15.5 m depth Planned as TOP- DOWN construction to speed up construction
  • 33.
    Stratigraphy Indo-Gangetic Alluvium Deposits consistprimarily of sandy silt (Delhi Silt) of low plasticity with minor silty sand layers SPT values:SPT values: 0-7 m depth: 14-36 7-13 m depth: 30-47 13-20 m depth: 39-66 20-60 m depth: > 100 Groundwater Level: 21.2 m depth (Feb 2009)
  • 34.
    Design Profile Depth Stratumc kN/m2 φ◦ γ kN/m3 0.0 15.5 Sandy Silt/Clayey Silt Above Cut-off Level 15 0 25 0 Very dense Sandy 300 0 1915.0 25.0 Very dense Sandy Silt/Clayey Silt 300 0 19 25.0 40.0 Very dense Sandy Silt/Clayey Silt 0 31 19.5 40.0 60.0 Very dense Sandy Silt 0 33 20 Design Water Table level considered at 15 m depth
  • 35.
    Computed Static PileCapacities Pile Dia. (mm) Pile Length Below Cut-Off Level1 (m) Computed safe axial compressive pile capacity2 (MN) 1600 25 (40.5) 11.79 27 (42.5) 12.49 30 (45.5) 13.54 32 (47.5) 14.23 1 Pile cut-off level is considered at 15.5 m below Ground Level. Pile lengths from ground level are presented in brackets 2 Design safe working loads include a Factor of Safety of 2.5
  • 36.
    Construction Sequence Install 1600mm diameter deep bored cast in-situ piles from ground level After piles are installed, excavation for basement shall be taken upshall be taken up Portion of pile above basement level shall act as column, that below basement shall contribute to pile capacity Construction of superstructure shall be taken up simultaneously
  • 37.
    Tests for QualityAssurance TOTAL 55 PILES INSTALLED 1600 mm dia 47.5 m below EGL, 32 m below COL One Static Load Test conducted on working pile 37 Low Strain Pile Integrity Test (PIT) 5 High Strain Dynamic Load Test (HSDLT) 1 Osterberg Cell Load Test (O-Cell)
  • 38.
    PIT Results Minor Impedancereduction at 15 m depth Impedance reduction below 17.5 m depth. Toe Response Weak Integrity Doubtful
  • 39.
    Impedance reduction below22 m depth. Integrity Doubtful Impedance reduction below 36 m depth. Weak Toe Response Integrity Doubtful Impedance reduction below 22 m depth. Integrity Doubtful
  • 40.
    High Strain DynamicLoad Test Pile No. Pile Diameter (mm) Total Pile Length (m) Test Load 1 (MN) CAPWWAP Ultimate Pile Capacity 1 (MN) Design Safe Working Load (MN) F.O.S E41 1600 48.3 21.34 20.6 14.23 1.45 F51 1600 48.3 21.34 8.5 14.23 0.6 E52 1600 47.0 21.34 7.2 14.23 0.5 A41 1500 48.3 18.63 18.1 12.42 1.45 C1-43 1500 44.5 18.63 8.4 12.42 0.7 1 After eliminating shaft friction for the top 15.5m to account for basement excavation
  • 41.
    CAPWAP Analysis: PileE-52 Interpreted Ultimate Capacity: 7.2 MN
  • 42.
    CAPWAP Analysis: PileC1-43 Interpreted Ultimate Capacity: 9.6 MN
  • 43.
    Osterberg Cell Bi-DirectionalLoad Test Test pile – boring done to 48.8 m depth, concreting done to 8.3 m depth below GL Pile length 39.6 m, effectively 33.3 m below COL O-Cells installed at 40.5 m depth below GL i.e. 8.3 m above pile toe
  • 44.
    O-Cell Test Results O-Cellloaded in 8 increments to maximum bi- directional load of 5.1 MN, each load increment held for 10 min At 5.1 MN, lower portion of pile reached ultimate capacity maximum O-Cell expansion of 150 mmcapacity, maximum O Cell expansion of 150 mm was exceeded Average downward movement of O-Cells base 148.8 mm Adjusting for buoyancy, net upward load applied on the upper portion of the pile is 4.1 MN and the net O-Cell extension was 1.1 mm
  • 45.
    Interpreted Ultimate Capacity Interpretedultimate capacity of lower shaft and base = 7.38 MN 3.62 MN contribution of lower shaft, 3.76 MN contribution of base Lower Shaft failed at 2.5 MN, net settlement 16 mm Base carried 2.6 MN, settlement approaching 160 mm Interpreted Ultimate Pile Capacity = 9 MN
  • 46.
    Summary of LoadTest Results Method of Analysis Interpreted Ultimate Pile Capacity1 (MN) Allowable Safe Working Pile Capacity2 (MN) F.O.S3 Static Load Test 16 6.4 1.12 0sterberg Cell Load Test 9.0 3.6 0.63 HS Dynamic Pile Testing 7.2 to 20.6 2.9 to 8.2 0.5 to 1.45 1 Based on Load test extrapolation of upper bound hyperbolic curve for upper portion of the pile 2 Assuming a Factor of Safety of 2.5 on ultimate pile capacity 3 Factor of Safety for estimated ultimate pile capacity against current safe working capacity (14.2 MN)
  • 47.
    Pile Above BasementLevelPile Above Basement Level FF--5151 FF--5252 EE--5151
  • 48.
    Quality of PilesExposed above Basement Level Pile diameter not uniform, substantial bulging observed in some piles Reinforcement exposed, bent C f il / l b fl l lCentre of pile / column at basement floor level was off by over 500 mm in some cases Some piles were visually out of plumb, so using as column was aesthetically unpleasant
  • 49.
  • 50.
    Exposed Pile –for use as column •Pile Dia non-uniform •Column out of plumbp •Reinforcement partly exposed •Doubtful integrity
  • 51.
  • 52.
    Safe Pile CapacitiesDeSafe Pile Capacities De--RatedRated Additional piles installed below basement levelAdditional piles installed below basement level PiledPiled--Raft analysis done to assess the overallRaft analysis done to assess the overall settlement and safety of the foundation systemsettlement and safety of the foundation system Of course it led to contractual issuesOf course it led to contractual issuesOf course it led to contractual issuesOf course it led to contractual issues Blame all involvedBlame all involved –– soil consultant, structuralsoil consultant, structural consultant, building contractor, piling agencyconsultant, building contractor, piling agency –– allall were under scrutinywere under scrutiny Client suffered!!Client suffered!! –– Project delayed, resulted inProject delayed, resulted in indirect lossesindirect losses
  • 53.
    Conclusions “There is manya slip twixt the cup and the lip” A well-planned, comprehensive Foundation QA program is essential to deliver foundation performance and avert disaster Avoid the BLAME GAME and resolve the problem to ensure safety Keep the geotechnical and structural engineers involved throughout the foundation construction process 53 foundation construction process Just doing the tests is not enough! Proper interpretation of the test results by an independent agency of repute Correlate all information and test results- geotechnical data, pour card information, test results, etc. Improve the design as well as the construction methodology in parallel to get maximum benefit
  • 54.
    Let us Striveto Achieve.. Quality in Pile Construction THANK YOU…THANK YOU… 54 THANK YOU…THANK YOU… 54 Cengrs Geotechnica Pvt. LtdCENGRS GEOTECHNICA PVT. LTD.