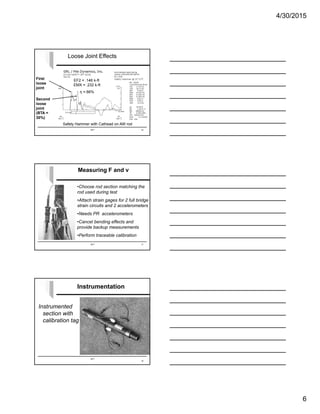
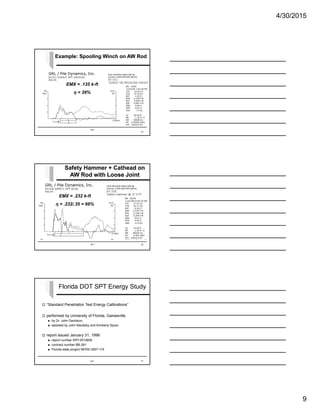
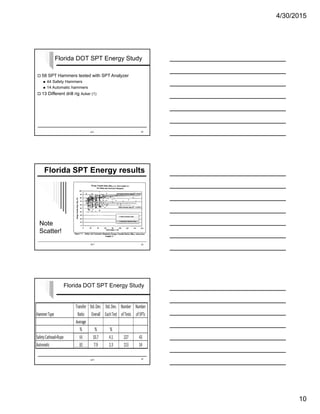
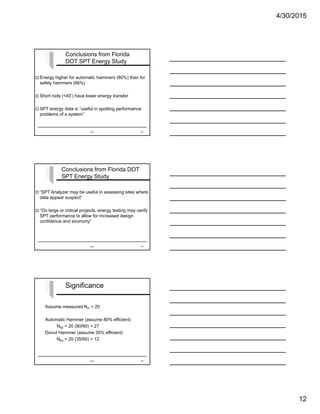
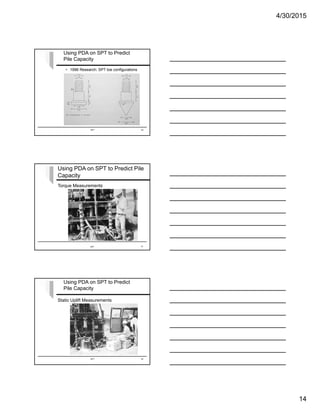
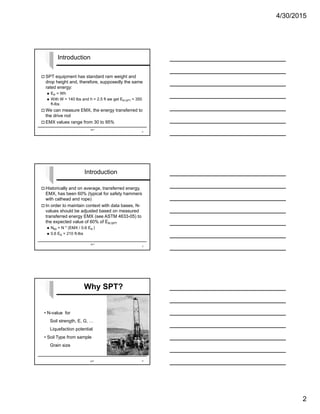
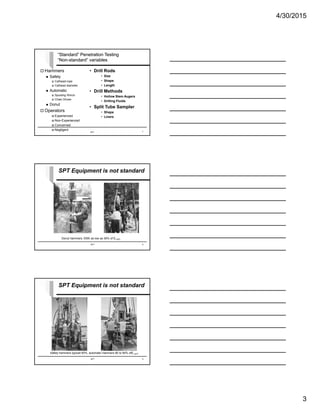
4/30/2015
1
SPT
SPT Energy Measurements
... or how to calibrate
SPT equipment to
obtain normalized
SPT N-values
1
SPT
SPT Energy Measurements
Outline
 Introduction
 Instrumentation
 Processing Equipment
 Examples
 Summary
2
SPT
Introduction
• 1902 Charles Gow of Gow Construction (Boston) used 1 inch dia. drive
samplers driven by 110-lb hammer
• mid 1920’s split spoon sampler introduced by Sprague & Henwood of
Scranton PA (2.0 to 3.5 inch diameters)
• 1927 Gow used 2 inch split spoon sampler, recording blows to drive 12
inches for 140 lb hammer and 30 inch drop
• 1947 Terzaghi christened the Raymond Sampler as the “Standard
Penetration Test” at 7th Conf. on Soil Mechanics and Foundation Eng.
• 1948 Terzaghi and Peck publish first SPT correlations
• 1958 ASTM adopted ASTM D1586
Ref: “Subsurface Exploration Using the Standard Penetration Test and the Cone Penetration
Test” by David Rogers; Environmental & Engineering Geoscience, Vol XII No.2, May 2006.
3
4/30/2015
2
SPT
Introduction
 SPT equipment has standard ram weight and
drop height and, therefore, supposedly the same
rated energy:
 ER = Wh
 With W = 140 lbs and h = 2.5 ft we get ER-SPT = 350
ft-lbs
 We can measure EMX, the energy transferred to
the drive rod
 EMX values range from 30 to 95%
4
SPT
Introduction
 Historically and on average, transferred energy,
EMX, has been 60% (typical for safety hammers
with cathead and rope)
 In order to maintain context with data bases, N-
values should be adjusted based on measured
transferred energy EMX (see ASTM 4633-05) to
the expected value of 60% of ER-SPT
 N60 = N * (EMX / 0.6 ER )
 0.6 ER = 210 ft-lbs
5
• N-value for
Soil strength, E, G, …
Liquefaction potential
• Soil Type from sample
Grain size
Why SPT?
SPT 6
4/30/2015
3
“Standard” Penetration Testing
“Non-standard” variables
“Standard” Penetration Testing
“Non-standard” variables
 Hammers
 Safety
 Cathead-rope
 Cathead diameter
 Automatic
 Spooling Winch
 Chain Driven
 Donut
 Operators
 Experienced
 Non-Experienced
 Concerned
 Negligent
• Drill Rods
• Size
• Shape
• Length
• Drill Methods
• Hollow Stem Augers
• Drilling Fluids
• Split Tube Sampler
• Shape
• Liners
SPT 7
SPT
SPT Equipment is not standard
8
Donut hammers: EMX as low as 30% of Er-SPT
SPT
SPT Equipment is not standard
9
Safety hammers typicall 60%, automatic hammers 80 to 90% ofEr-SPT
4/30/2015
4
Standardization of SPT N-Value
 “Non-standard” SPT systems deliver highly variable energy
values to drive rod. Energy transfer affects N - value
 Soil strength estimated from N-value based on experience,
i.e. on average N-value
 Obtain normalized, N60, value for more reliable static soil
analysis
 Also: Liquefaction potential estimated from N60 (ASTM D
6066)
SPT 10
Normalized N-Value: N60
N60 = Nm
EMX
Wh (60%)
Nm, measured N-value
EMX, measured transferred energy
SPT 11
What Energy?
 Potential, Wrh
 Measure weight, Wr (0.140 kips or 0.623 kN)
 Estimate stroke, h (2.5 ft or 0.762 m)
 Potential Energy, Wrh (0.350 ft-kips or 0.474 kJ)
 Kinetic, ½(Wr/g) vi
2
 Measure vi with HPA
 vi = √(2 g h) (8.96 ft/s or 2.73 m/s)
SPT 12
WP
mR
hWR
vi
4/30/2015
5
SPT
Transferred EnergyTransferred Energy
Energy = Sum of Force times Displacement
ER(t) = ∫ F du; but v = du/dt
EFV(t) = ∫ Fv dt; transferred energy
EMX = max[EFV(t)]
ηT = EMX / ER-SPT ; transfer ratio
Energy = Sum of Force times Displacement
ER(t) = ∫ F du; but v = du/dt
EFV(t) = ∫ Fv dt; transferred energy
EMX = max[EFV(t)]
ηT = EMX / ER-SPT ; transfer ratio
13
F,
v
WR
vi
SPT
ASTM D4633 – earlier versionsASTM D4633 – earlier versions
Since
EFV = ∫ F v dt and
F = Z v (in a downward traveling wave)
Z = EA/c ... Pile impedance; E ... Young’s modulus,
A ... Cross sectional area; c ... Stress wave speed
Then
EF2 = Z ∫ F 2 dt (only requires force measurement)
But ONLY if there are no forces due to wave reflections; thus, this method is
inherently incorrect and obsolete!
14
EF2 = 209 N-m
η = 44%
EFV = 0.281 N-m
η = 59%
Safety Hammer, Cathead, PE = 0.475 kN-m
EF2 Short L corrections
EF2corr = EF2(1.17)(1.45)(1/1.36)
= 260 N-m (η = 55% )
1.17 due to energy in rod
above sensors
1.45 due to short rod length
1.36 due to c ratio
SPT 15
ASTM D4633 – earlier versionsASTM D4633 – earlier versions
4/30/2015
6
Loose Joint Effects
EMX = .232 k-ft
η = 66%
EF2 = .146 k-ft
Safety Hammer with Cathead on AW rod
SPT 16
Second
loose
joint
(BTA =
30%)
First
loose
joint
SPT
•Choose rod section matching the
rod used during test
•Attach strain gages for 2 full bridge
strain circuits and 2 accelerometers
•Needs PR accelerometers
•Cancel bending effects and
provide backup measurements
•Perform traceable calibration
Measuring F and v
17
SPT
Instrumentation
Instrumented
section with
calibration tag
18
4/30/2015
7
Calibration of Force Sensors
SPT 19
Force Measurement
Strain Measurement
SPT
Pile Driving Analyzer® - Model PAK
Processing Equipment
20
SPT
Pile Driving Analyzer - Model PAX
Processing Equipment
21
4/30/2015
8
SPT
SPT Analyzer
Processing Equipment
22
SPT
Pile Driving Analyzer - Model PAX
Processing Equipment
23
SPT
SPT hammers are uncushioned which requires special
accelerometers and some higher frequency data
processing.
ASTM 4633 requires digitizing frequency
• ≥ 20,000 sps for analog integration
• ≥ 50,000 sps for digital integration
EC7 requires digitizing frequency
• ≥ 100,000 sps for digital integration
May require special software in PDA or an SPT Analyzer
Processing Equipment
24
4/30/2015
9
SPT
Example: Spooling Winch on AW RodExample: Spooling Winch on AW Rod
EMX = .135 k-ft
η = 39%
25
SPT
Safety Hammer + Cathead on
AW Rod with Loose Joint
Safety Hammer + Cathead on
AW Rod with Loose Joint
EMX = .232 k-ft
η = .232/.35 = 66%
26
Florida DOT SPT Energy Study
 “Standard Penetration Test Energy Calibrations”
 performed by University of Florida, Gainesville
 by Dr. John Davidson,
 assisted by John Maultsby and Kimberly Spoor
 report issued January 31, 1999
 report number WPI 0510859
 contract number BB-261
 Florida state project 99700-3557-119
SPT 27
4/30/2015
10
 58 SPT Hammers tested with SPT Analyzer
 44 Safety Hammers
 14 Automatic hammers
 13 Different drill rig Acker (1)
Florida DOT SPT Energy Study
SPT 28
SPT
Florida SPT Energy results
29
Note
Scatter!
Florida DOT SPT Energy Study
SPT 30
4/30/2015
11
SPT
Utah State University StudyUtah State University Study
GRL data compiled by Utah State University
31
Comparison of Studies
SPT 32
 Energy similar with 1.25 to 2.25 rope turns on
cathead
 Extra 10% energy loss for 2.75 rope turns; should
be avoided (per ASTM D1586)
 Rod type no major effect in energy transfer (AW or
NW)
Conclusions from Florida
DOT SPT Energy Study
SPT 33
4/30/2015
12
 Energy higher for automatic hammers (80%) than for
safety hammers (66%)
 Short rods (<40’) have lower energy transfer
 SPT energy data is “useful in spotting performance
problems of a system”
Conclusions from Florida
DOT SPT Energy Study
SPT 34
 “SPT Analyzer may be useful in assessing sites where
data appear suspect”
 “On large or critical projects, energy testing may verify
SPT performance to allow for increased design
confidence and economy”
Conclusions from Florida DOT
SPT Energy Study
SPT 35
Significance
Assume measured Nm = 20
Automatic Hammer (assume 80% efficient)
N60 = 20 (80/60) = 27
Donut Hammer (assume 35% efficient)
N60 = 20 (35/60) = 12
SPT 36
4/30/2015
13
SPT
SUMMARY
 SPT rigs and rods are not truly standardized and
transferred energy values vary greatly
 Energy is important quantity when assessing
strength of soil and/or liquefaction potential from
N-value
 Force and velocity measurements can be
evaluated for transferred energy in real time by
PDA or SPT Analyzer according to ASTM 4633-
05
 N-value is then corrected as per energy ratio
37
SPT
SPT Energy Considerations
Questions?
38
• Measure F, v with PDA
• Calculate soil resistance
against sampler or special
toe plate or cone
• Measure Torque
• Measure static uplift
Rausche, et al., 1990. Determination of Pile  
Driveability and Capacity from Penetration 
Tests, FHWA Research Report
SPT 39
Using PDA on SPT to Predict
Pile Capacity
4/30/2015
14
• 1996 Research: SPT toe configurations
SPT 40
Using PDA on SPT to Predict
Pile Capacity
Using PDA on SPT to Predict Pile
Capacity
Torque Measurements
SPT 41
SPT 42
Using PDA on SPT to Predict
Pile Capacity
Static Uplift Measurements
4/30/2015
15
Pile top F and v
measured and from
GRLWEAP
SPT 43
Using PDA on SPT to Predict
Pile Capacity
Pile top F and v
Measured and from
GRLWEAP
Pile bottom F and v
calculated from
Measurement and
GRLWEAP
SPT 44
Using PDA on SPT to Predict
Pile Capacity
SPT 45
• Integrate v to
bottom
displacement
• Plot Force vs
displacement at
bottom
• Compare with
Uplift test
Using PDA on SPT to Predict
Pile Capacity
4/30/2015
16
SPT 46
Using PDA on SPT to Predict
Pile Capacity
• Integrate v to
bottom
displacement
• Plot Force vs
displacement at
bottom
• Compare with
Compression
test
SPT 47
Using PDA on SPT to Predict
Pile Capacity
Based on SPT
measurements,
compare
calculated
capacities from:
• Wave equation
• CAPWAP
With static test
Conclusions from additional
SPT measurements
 Potential to determine soil properties with a
CAPWAP type analysis
 For static design implications
 For dynamic driveability predictions
 More testing and research are needed!
SPT 48
4/30/2015
17
The End
SPT 49

3.6 spt energy calibration -gray

  • 1.
    4/30/2015 1 SPT SPT Energy Measurements ...or how to calibrate SPT equipment to obtain normalized SPT N-values 1 SPT SPT Energy Measurements Outline  Introduction  Instrumentation  Processing Equipment  Examples  Summary 2 SPT Introduction • 1902 Charles Gow of Gow Construction (Boston) used 1 inch dia. drive samplers driven by 110-lb hammer • mid 1920’s split spoon sampler introduced by Sprague & Henwood of Scranton PA (2.0 to 3.5 inch diameters) • 1927 Gow used 2 inch split spoon sampler, recording blows to drive 12 inches for 140 lb hammer and 30 inch drop • 1947 Terzaghi christened the Raymond Sampler as the “Standard Penetration Test” at 7th Conf. on Soil Mechanics and Foundation Eng. • 1948 Terzaghi and Peck publish first SPT correlations • 1958 ASTM adopted ASTM D1586 Ref: “Subsurface Exploration Using the Standard Penetration Test and the Cone Penetration Test” by David Rogers; Environmental & Engineering Geoscience, Vol XII No.2, May 2006. 3
  • 2.
    4/30/2015 2 SPT Introduction  SPT equipmenthas standard ram weight and drop height and, therefore, supposedly the same rated energy:  ER = Wh  With W = 140 lbs and h = 2.5 ft we get ER-SPT = 350 ft-lbs  We can measure EMX, the energy transferred to the drive rod  EMX values range from 30 to 95% 4 SPT Introduction  Historically and on average, transferred energy, EMX, has been 60% (typical for safety hammers with cathead and rope)  In order to maintain context with data bases, N- values should be adjusted based on measured transferred energy EMX (see ASTM 4633-05) to the expected value of 60% of ER-SPT  N60 = N * (EMX / 0.6 ER )  0.6 ER = 210 ft-lbs 5 • N-value for Soil strength, E, G, … Liquefaction potential • Soil Type from sample Grain size Why SPT? SPT 6
  • 3.
    4/30/2015 3 “Standard” Penetration Testing “Non-standard”variables “Standard” Penetration Testing “Non-standard” variables  Hammers  Safety  Cathead-rope  Cathead diameter  Automatic  Spooling Winch  Chain Driven  Donut  Operators  Experienced  Non-Experienced  Concerned  Negligent • Drill Rods • Size • Shape • Length • Drill Methods • Hollow Stem Augers • Drilling Fluids • Split Tube Sampler • Shape • Liners SPT 7 SPT SPT Equipment is not standard 8 Donut hammers: EMX as low as 30% of Er-SPT SPT SPT Equipment is not standard 9 Safety hammers typicall 60%, automatic hammers 80 to 90% ofEr-SPT
  • 4.
    4/30/2015 4 Standardization of SPTN-Value  “Non-standard” SPT systems deliver highly variable energy values to drive rod. Energy transfer affects N - value  Soil strength estimated from N-value based on experience, i.e. on average N-value  Obtain normalized, N60, value for more reliable static soil analysis  Also: Liquefaction potential estimated from N60 (ASTM D 6066) SPT 10 Normalized N-Value: N60 N60 = Nm EMX Wh (60%) Nm, measured N-value EMX, measured transferred energy SPT 11 What Energy?  Potential, Wrh  Measure weight, Wr (0.140 kips or 0.623 kN)  Estimate stroke, h (2.5 ft or 0.762 m)  Potential Energy, Wrh (0.350 ft-kips or 0.474 kJ)  Kinetic, ½(Wr/g) vi 2  Measure vi with HPA  vi = √(2 g h) (8.96 ft/s or 2.73 m/s) SPT 12 WP mR hWR vi
  • 5.
    4/30/2015 5 SPT Transferred EnergyTransferred Energy Energy= Sum of Force times Displacement ER(t) = ∫ F du; but v = du/dt EFV(t) = ∫ Fv dt; transferred energy EMX = max[EFV(t)] ηT = EMX / ER-SPT ; transfer ratio Energy = Sum of Force times Displacement ER(t) = ∫ F du; but v = du/dt EFV(t) = ∫ Fv dt; transferred energy EMX = max[EFV(t)] ηT = EMX / ER-SPT ; transfer ratio 13 F, v WR vi SPT ASTM D4633 – earlier versionsASTM D4633 – earlier versions Since EFV = ∫ F v dt and F = Z v (in a downward traveling wave) Z = EA/c ... Pile impedance; E ... Young’s modulus, A ... Cross sectional area; c ... Stress wave speed Then EF2 = Z ∫ F 2 dt (only requires force measurement) But ONLY if there are no forces due to wave reflections; thus, this method is inherently incorrect and obsolete! Since EFV = ∫ F v dt and F = Z v (in a downward traveling wave) Z = EA/c ... Pile impedance; E ... Young’s modulus, A ... Cross sectional area; c ... Stress wave speed Then EF2 = Z ∫ F 2 dt (only requires force measurement) But ONLY if there are no forces due to wave reflections; thus, this method is inherently incorrect and obsolete! 14 EF2 = 209 N-m η = 44% EFV = 0.281 N-m η = 59% Safety Hammer, Cathead, PE = 0.475 kN-m EF2 Short L corrections EF2corr = EF2(1.17)(1.45)(1/1.36) = 260 N-m (η = 55% ) 1.17 due to energy in rod above sensors 1.45 due to short rod length 1.36 due to c ratio SPT 15 ASTM D4633 – earlier versionsASTM D4633 – earlier versions
  • 6.
    4/30/2015 6 Loose Joint Effects EMX= .232 k-ft η = 66% EF2 = .146 k-ft Safety Hammer with Cathead on AW rod SPT 16 Second loose joint (BTA = 30%) First loose joint SPT •Choose rod section matching the rod used during test •Attach strain gages for 2 full bridge strain circuits and 2 accelerometers •Needs PR accelerometers •Cancel bending effects and provide backup measurements •Perform traceable calibration Measuring F and v 17 SPT Instrumentation Instrumented section with calibration tag 18
  • 7.
    4/30/2015 7 Calibration of ForceSensors SPT 19 Force Measurement Strain Measurement SPT Pile Driving Analyzer® - Model PAK Processing Equipment 20 SPT Pile Driving Analyzer - Model PAX Processing Equipment 21
  • 8.
    4/30/2015 8 SPT SPT Analyzer Processing Equipment 22 SPT PileDriving Analyzer - Model PAX Processing Equipment 23 SPT SPT hammers are uncushioned which requires special accelerometers and some higher frequency data processing. ASTM 4633 requires digitizing frequency • ≥ 20,000 sps for analog integration • ≥ 50,000 sps for digital integration EC7 requires digitizing frequency • ≥ 100,000 sps for digital integration May require special software in PDA or an SPT Analyzer Processing Equipment 24
  • 9.
    4/30/2015 9 SPT Example: Spooling Winchon AW RodExample: Spooling Winch on AW Rod EMX = .135 k-ft η = 39% 25 SPT Safety Hammer + Cathead on AW Rod with Loose Joint Safety Hammer + Cathead on AW Rod with Loose Joint EMX = .232 k-ft η = .232/.35 = 66% 26 Florida DOT SPT Energy Study  “Standard Penetration Test Energy Calibrations”  performed by University of Florida, Gainesville  by Dr. John Davidson,  assisted by John Maultsby and Kimberly Spoor  report issued January 31, 1999  report number WPI 0510859  contract number BB-261  Florida state project 99700-3557-119 SPT 27
  • 10.
    4/30/2015 10  58 SPTHammers tested with SPT Analyzer  44 Safety Hammers  14 Automatic hammers  13 Different drill rig Acker (1) Florida DOT SPT Energy Study SPT 28 SPT Florida SPT Energy results 29 Note Scatter! Florida DOT SPT Energy Study SPT 30
  • 11.
    4/30/2015 11 SPT Utah State UniversityStudyUtah State University Study GRL data compiled by Utah State University 31 Comparison of Studies SPT 32  Energy similar with 1.25 to 2.25 rope turns on cathead  Extra 10% energy loss for 2.75 rope turns; should be avoided (per ASTM D1586)  Rod type no major effect in energy transfer (AW or NW) Conclusions from Florida DOT SPT Energy Study SPT 33
  • 12.
    4/30/2015 12  Energy higherfor automatic hammers (80%) than for safety hammers (66%)  Short rods (<40’) have lower energy transfer  SPT energy data is “useful in spotting performance problems of a system” Conclusions from Florida DOT SPT Energy Study SPT 34  “SPT Analyzer may be useful in assessing sites where data appear suspect”  “On large or critical projects, energy testing may verify SPT performance to allow for increased design confidence and economy” Conclusions from Florida DOT SPT Energy Study SPT 35 Significance Assume measured Nm = 20 Automatic Hammer (assume 80% efficient) N60 = 20 (80/60) = 27 Donut Hammer (assume 35% efficient) N60 = 20 (35/60) = 12 SPT 36
  • 13.
    4/30/2015 13 SPT SUMMARY  SPT rigsand rods are not truly standardized and transferred energy values vary greatly  Energy is important quantity when assessing strength of soil and/or liquefaction potential from N-value  Force and velocity measurements can be evaluated for transferred energy in real time by PDA or SPT Analyzer according to ASTM 4633- 05  N-value is then corrected as per energy ratio 37 SPT SPT Energy Considerations Questions? 38 • Measure F, v with PDA • Calculate soil resistance against sampler or special toe plate or cone • Measure Torque • Measure static uplift Rausche, et al., 1990. Determination of Pile   Driveability and Capacity from Penetration  Tests, FHWA Research Report SPT 39 Using PDA on SPT to Predict Pile Capacity
  • 14.
    4/30/2015 14 • 1996 Research:SPT toe configurations SPT 40 Using PDA on SPT to Predict Pile Capacity Using PDA on SPT to Predict Pile Capacity Torque Measurements SPT 41 SPT 42 Using PDA on SPT to Predict Pile Capacity Static Uplift Measurements
  • 15.
    4/30/2015 15 Pile top Fand v measured and from GRLWEAP SPT 43 Using PDA on SPT to Predict Pile Capacity Pile top F and v Measured and from GRLWEAP Pile bottom F and v calculated from Measurement and GRLWEAP SPT 44 Using PDA on SPT to Predict Pile Capacity SPT 45 • Integrate v to bottom displacement • Plot Force vs displacement at bottom • Compare with Uplift test Using PDA on SPT to Predict Pile Capacity
  • 16.
    4/30/2015 16 SPT 46 Using PDAon SPT to Predict Pile Capacity • Integrate v to bottom displacement • Plot Force vs displacement at bottom • Compare with Compression test SPT 47 Using PDA on SPT to Predict Pile Capacity Based on SPT measurements, compare calculated capacities from: • Wave equation • CAPWAP With static test Conclusions from additional SPT measurements  Potential to determine soil properties with a CAPWAP type analysis  For static design implications  For dynamic driveability predictions  More testing and research are needed! SPT 48
  • 17.