The document discusses the application of the wave equation to model pile driving and calculate deep foundation capacities. It summarizes Frank Rausche's presentation on using GRLWEAP software to model pile driving through a numerical solution of the one-dimensional wave equation. Key aspects covered include modeling the pile as a series of mass-spring segments, representing soil resistance through forces on the pile, and calculating displacements, stresses, velocities over time to evaluate driving stresses and pile capacity. The document provides examples of modeling granular and cohesive soil resistance through static methods in GRLWEAP and summarizes the benefits of the wave equation approach over traditional driving formulas.
tunnel lining may be permanent or temporary based upon their use and requirement. design of lining is done in two parts one is temporary or initial lining design and other is permanent design of the lining. empirical and theoretical methods are major design methods.
tunnel lining may be permanent or temporary based upon their use and requirement. design of lining is done in two parts one is temporary or initial lining design and other is permanent design of the lining. empirical and theoretical methods are major design methods.
Class notes of Geotechnical Engineering course I used to teach at UET Lahore. Feel free to download the slide show.
Anyone looking to modify these files and use them for their own teaching purposes can contact me directly to get hold of editable version.
Class notes of Geotechnical Engineering course I used to teach at UET Lahore. Feel free to download the slide show.
Anyone looking to modify these files and use them for their own teaching purposes can contact me directly to get hold of editable version.
Determination of consolidation properties (like CV, CC, CS, t90, mv, av) of the given soil specimen (Dhanauri Clay) by conducting one-dimensional consolidation test using fixed ring type setup.
Learning Outcomes:-
1. From consolidation test, the following information can be determined:
a) Amount of settlement experienced by a soil-structure after load application
b) Rate of consolidation of soil under a normal load
c) Degree of consolidation at any time
d) Pressure void ratio relationship
e) Coefficient of consolidation at various successively increasing pressure
f) Permeability of soil at various stages of loading
g) Compression index of soil
2. The general procedure for laboratory evaluation of consolidation characteristics of soils involves a one-dimensional consolidation.
This is necessary because of:
• Difficulty of instrumentation for recording volume change and natural strains.
• Complexities in mathematical analysis of three-dimensional consolidation.
3. The underlying assumptions in the derivation of the mathematical equations are as follows:
• The clay layer is homogeneous.
• The clay layer is saturated, the compression of the soil layer is due to the change in volume only, which in turn, is due to the squeezing out of water from the void spaces.
• Darcy’s law is valid.
• Deformation of soil occurs only in the direction of the load application.
4. Effects of ring friction
• During loading reduce stress acted on the specimen, specimen compresses less.
• During rebound reduce the swelling tendency specimen swell less.
• Flatten the swelling curve at low stress level.
5. Resultant Cv decreases with increasing stress, implying its NC clay.
6. Sample was preserved in polybag to check loss of moisture content.
Behaviour and Analysis of Large Diameter Laterally Loaded PilesHenry Pik Yap Sia
75% of UK offshore wind turbines are supported on monopile foundations (Doherty and Gavin, 2012). The piles are subjected to large lateral loading from wind and tide surges as well as seabed movement. British Standards (BS EN 61400-3:2009) suggested p-y curve to predict the behaviour of laterally loaded offshore piles. P-y curve has certain assumptions including negligible rotational resistance along the pile length.
This report presents our investigation on the effect of rotational resistance on a typical large diameter pile. It also describes how the finite difference (FD) program has been written from first principles, the Winkler’s Method and Euler-Bernoulli Beam theory. To calculate the rotational resistance, the slice method proposed by McVay and Niraula (2004) is implemented in our model. Our linear-elastic FD model calculates the displacement, bending moment, shear force and soil pressure for laterally loaded piles for two cases: (a) when rotational resistance is considered and (b) when rotational resistance is neglected. The later represents the values used in the industry.
Sensitivity study, through our model produced good results within its scope. The results suggested that the change in the soil and pile properties was found to be dependent on the length-to-depth (L/D) ratio of the pile and the stiffness of the soil next to the pile. In other words, when reached critical ratio, the rotational resistance becomes very significant, specifically for short, rigid piles. Therefore, we computed curves to recommend the range of L/D values where rotational resistance can be safely neglected.
Recommendations and suggestions are made to improve the model and research to fully encapsulate the behaviour of offshore monopiles, such as cyclic loading, elastic continuum, plasticity and non-linearity.
Lastly, we have sufficient confidence from this research to conclude that rotational resistance of a laterally loaded large diameter pile are important and that current design standards for offshore monopiles are conservative.
Geotechnical Engineering-II [Lec #3: Direct Shear Test)Muhammad Irfan
Class notes of Geotechnical Engineering course I used to teach at UET Lahore. Feel free to download the slide show.
Anyone looking to modify these files and use them for their own teaching purposes can contact me directly to get hold of editable version.
Bridges with hinged spans after a centenary experienceDCEE2017
Pier Giorgio Malerba.
Several steel and R.C. continuous bridges of the last century were made statically determinate by
placing hinge connections in suitable points of their spans (articulated bridges). The main
advantages of this choice are a clear and simple static scheme and the avoidance of spurious effect
due to settlements of the foundations.
On the other hand, the systematic use of bearing supports and joints along the spans causes slope
discontinuities of the road platform: under the permanent loads, such kinks are progressively
increased by shrinkage, creep and steel relaxation effects; under the traffic loads these local
discontinuities foster the dynamic effects in the neighbourhood of the hinges and causes severe
damages both at these devices and at their interfaces with the body of the main structure. Moreover,
these effects are an inconvenience as far as the appearance of the structure and ride comfort.
This contribution would present an overview of the performance of these bridges after a century of
experiences and to highlight their most diffused drawbacks. Particular attention is paid to the hinge
connections made of a couple of opposite R.C. corbels, which is one of the most critical zones. In
fact, their shape made difficult the detailing of the bars, frequently quite congested, attracts and
retains the damaging agents (salted water from the platform) and, as a consequence, gives rise to
fast corrosion states. Some criteria for their structural assessment are given and the examples of
rehabilitation are presented.
Method for determination of shear strength of soil (Badarpur Sand) with a maximum particle size of 4.75 mm in drained conditions using Direct Shear Test apparatus.
It is a Floating Box type test in which upper half box is floating due to application of vertical loading resulting in lateral confinement thus generating sufficient friction which holds the upper half of shear box.
In the shear box test, the specimen is not failing along its weakest plane but along a predetermined or induced failure plane i.e. horizontal plane separating the two halves of the shear box. This is the main drawback of this test.
Moreover, during loading, the state of stress cannot be evaluated. It can be evaluated only at failure condition. Also, failure is progressive.
Class notes of Geotechnical Engineering course I used to teach at UET Lahore. Feel free to download the slide show.
Anyone looking to modify these files and use them for their own teaching purposes can contact me directly to get hold of editable version.
Class notes of Geotechnical Engineering course I used to teach at UET Lahore. Feel free to download the slide show.
Anyone looking to modify these files and use them for their own teaching purposes can contact me directly to get hold of editable version.
Determination of consolidation properties (like CV, CC, CS, t90, mv, av) of the given soil specimen (Dhanauri Clay) by conducting one-dimensional consolidation test using fixed ring type setup.
Learning Outcomes:-
1. From consolidation test, the following information can be determined:
a) Amount of settlement experienced by a soil-structure after load application
b) Rate of consolidation of soil under a normal load
c) Degree of consolidation at any time
d) Pressure void ratio relationship
e) Coefficient of consolidation at various successively increasing pressure
f) Permeability of soil at various stages of loading
g) Compression index of soil
2. The general procedure for laboratory evaluation of consolidation characteristics of soils involves a one-dimensional consolidation.
This is necessary because of:
• Difficulty of instrumentation for recording volume change and natural strains.
• Complexities in mathematical analysis of three-dimensional consolidation.
3. The underlying assumptions in the derivation of the mathematical equations are as follows:
• The clay layer is homogeneous.
• The clay layer is saturated, the compression of the soil layer is due to the change in volume only, which in turn, is due to the squeezing out of water from the void spaces.
• Darcy’s law is valid.
• Deformation of soil occurs only in the direction of the load application.
4. Effects of ring friction
• During loading reduce stress acted on the specimen, specimen compresses less.
• During rebound reduce the swelling tendency specimen swell less.
• Flatten the swelling curve at low stress level.
5. Resultant Cv decreases with increasing stress, implying its NC clay.
6. Sample was preserved in polybag to check loss of moisture content.
Behaviour and Analysis of Large Diameter Laterally Loaded PilesHenry Pik Yap Sia
75% of UK offshore wind turbines are supported on monopile foundations (Doherty and Gavin, 2012). The piles are subjected to large lateral loading from wind and tide surges as well as seabed movement. British Standards (BS EN 61400-3:2009) suggested p-y curve to predict the behaviour of laterally loaded offshore piles. P-y curve has certain assumptions including negligible rotational resistance along the pile length.
This report presents our investigation on the effect of rotational resistance on a typical large diameter pile. It also describes how the finite difference (FD) program has been written from first principles, the Winkler’s Method and Euler-Bernoulli Beam theory. To calculate the rotational resistance, the slice method proposed by McVay and Niraula (2004) is implemented in our model. Our linear-elastic FD model calculates the displacement, bending moment, shear force and soil pressure for laterally loaded piles for two cases: (a) when rotational resistance is considered and (b) when rotational resistance is neglected. The later represents the values used in the industry.
Sensitivity study, through our model produced good results within its scope. The results suggested that the change in the soil and pile properties was found to be dependent on the length-to-depth (L/D) ratio of the pile and the stiffness of the soil next to the pile. In other words, when reached critical ratio, the rotational resistance becomes very significant, specifically for short, rigid piles. Therefore, we computed curves to recommend the range of L/D values where rotational resistance can be safely neglected.
Recommendations and suggestions are made to improve the model and research to fully encapsulate the behaviour of offshore monopiles, such as cyclic loading, elastic continuum, plasticity and non-linearity.
Lastly, we have sufficient confidence from this research to conclude that rotational resistance of a laterally loaded large diameter pile are important and that current design standards for offshore monopiles are conservative.
Geotechnical Engineering-II [Lec #3: Direct Shear Test)Muhammad Irfan
Class notes of Geotechnical Engineering course I used to teach at UET Lahore. Feel free to download the slide show.
Anyone looking to modify these files and use them for their own teaching purposes can contact me directly to get hold of editable version.
Bridges with hinged spans after a centenary experienceDCEE2017
Pier Giorgio Malerba.
Several steel and R.C. continuous bridges of the last century were made statically determinate by
placing hinge connections in suitable points of their spans (articulated bridges). The main
advantages of this choice are a clear and simple static scheme and the avoidance of spurious effect
due to settlements of the foundations.
On the other hand, the systematic use of bearing supports and joints along the spans causes slope
discontinuities of the road platform: under the permanent loads, such kinks are progressively
increased by shrinkage, creep and steel relaxation effects; under the traffic loads these local
discontinuities foster the dynamic effects in the neighbourhood of the hinges and causes severe
damages both at these devices and at their interfaces with the body of the main structure. Moreover,
these effects are an inconvenience as far as the appearance of the structure and ride comfort.
This contribution would present an overview of the performance of these bridges after a century of
experiences and to highlight their most diffused drawbacks. Particular attention is paid to the hinge
connections made of a couple of opposite R.C. corbels, which is one of the most critical zones. In
fact, their shape made difficult the detailing of the bars, frequently quite congested, attracts and
retains the damaging agents (salted water from the platform) and, as a consequence, gives rise to
fast corrosion states. Some criteria for their structural assessment are given and the examples of
rehabilitation are presented.
Method for determination of shear strength of soil (Badarpur Sand) with a maximum particle size of 4.75 mm in drained conditions using Direct Shear Test apparatus.
It is a Floating Box type test in which upper half box is floating due to application of vertical loading resulting in lateral confinement thus generating sufficient friction which holds the upper half of shear box.
In the shear box test, the specimen is not failing along its weakest plane but along a predetermined or induced failure plane i.e. horizontal plane separating the two halves of the shear box. This is the main drawback of this test.
Moreover, during loading, the state of stress cannot be evaluated. It can be evaluated only at failure condition. Also, failure is progressive.
"Reduction of uncertainties associated to the dynamic response of a ship unlo...TRUSS ITN
Here, the TRUSS (Training in Reducing Uncertainty in Structural Safety) ITN (Innovative Training Network) Horizon 2020 project (http://trussitn.eu, 2015-19) demonstrates how the accuracy of residual life assessment predictions can be improved by achieving a good agreement between measured and predicted dynamic responses of a crane structure. Existing records of measured strain data are often missing information such as the weight of the payload, the hoisting speed and acceleration that are relevant for structural assessment purposes. This paper aims to reduce uncertainties associated with the recorded data in an aged grab ship unloader by comparing measured and non-linear transient finite element analyses results for a loading/unloading cycle. The speed pattern is determined from a best match to the measured record. The moving load consisting of ‘trolley + grab + payload’ is modelled with parameters that are derived from minimizing differences between measured and simulated responses. The determination of these loading parameters is central to accurately assess the remaining life of ship unloaders.
My presentation on fluid dynamics on how to make 100 times faster Navier-Stokes equation into single phase process. This paper also discusses the solver's algorithm.
Immunizing Image Classifiers Against Localized Adversary Attacksgerogepatton
This paper addresses the vulnerability of deep learning models, particularly convolutional neural networks
(CNN)s, to adversarial attacks and presents a proactive training technique designed to counter them. We
introduce a novel volumization algorithm, which transforms 2D images into 3D volumetric representations.
When combined with 3D convolution and deep curriculum learning optimization (CLO), itsignificantly improves
the immunity of models against localized universal attacks by up to 40%. We evaluate our proposed approach
using contemporary CNN architectures and the modified Canadian Institute for Advanced Research (CIFAR-10
and CIFAR-100) and ImageNet Large Scale Visual Recognition Challenge (ILSVRC12) datasets, showcasing
accuracy improvements over previous techniques. The results indicate that the combination of the volumetric
input and curriculum learning holds significant promise for mitigating adversarial attacks without necessitating
adversary training.
Welcome to WIPAC Monthly the magazine brought to you by the LinkedIn Group Water Industry Process Automation & Control.
In this month's edition, along with this month's industry news to celebrate the 13 years since the group was created we have articles including
A case study of the used of Advanced Process Control at the Wastewater Treatment works at Lleida in Spain
A look back on an article on smart wastewater networks in order to see how the industry has measured up in the interim around the adoption of Digital Transformation in the Water Industry.
COLLEGE BUS MANAGEMENT SYSTEM PROJECT REPORT.pdfKamal Acharya
The College Bus Management system is completely developed by Visual Basic .NET Version. The application is connect with most secured database language MS SQL Server. The application is develop by using best combination of front-end and back-end languages. The application is totally design like flat user interface. This flat user interface is more attractive user interface in 2017. The application is gives more important to the system functionality. The application is to manage the student’s details, driver’s details, bus details, bus route details, bus fees details and more. The application has only one unit for admin. The admin can manage the entire application. The admin can login into the application by using username and password of the admin. The application is develop for big and small colleges. It is more user friendly for non-computer person. Even they can easily learn how to manage the application within hours. The application is more secure by the admin. The system will give an effective output for the VB.Net and SQL Server given as input to the system. The compiled java program given as input to the system, after scanning the program will generate different reports. The application generates the report for users. The admin can view and download the report of the data. The application deliver the excel format reports. Because, excel formatted reports is very easy to understand the income and expense of the college bus. This application is mainly develop for windows operating system users. In 2017, 73% of people enterprises are using windows operating system. So the application will easily install for all the windows operating system users. The application-developed size is very low. The application consumes very low space in disk. Therefore, the user can allocate very minimum local disk space for this application.
Cosmetic shop management system project report.pdfKamal Acharya
Buying new cosmetic products is difficult. It can even be scary for those who have sensitive skin and are prone to skin trouble. The information needed to alleviate this problem is on the back of each product, but it's thought to interpret those ingredient lists unless you have a background in chemistry.
Instead of buying and hoping for the best, we can use data science to help us predict which products may be good fits for us. It includes various function programs to do the above mentioned tasks.
Data file handling has been effectively used in the program.
The automated cosmetic shop management system should deal with the automation of general workflow and administration process of the shop. The main processes of the system focus on customer's request where the system is able to search the most appropriate products and deliver it to the customers. It should help the employees to quickly identify the list of cosmetic product that have reached the minimum quantity and also keep a track of expired date for each cosmetic product. It should help the employees to find the rack number in which the product is placed.It is also Faster and more efficient way.
Overview of the fundamental roles in Hydropower generation and the components involved in wider Electrical Engineering.
This paper presents the design and construction of hydroelectric dams from the hydrologist’s survey of the valley before construction, all aspects and involved disciplines, fluid dynamics, structural engineering, generation and mains frequency regulation to the very transmission of power through the network in the United Kingdom.
Author: Robbie Edward Sayers
Collaborators and co editors: Charlie Sims and Connor Healey.
(C) 2024 Robbie E. Sayers
Explore the innovative world of trenchless pipe repair with our comprehensive guide, "The Benefits and Techniques of Trenchless Pipe Repair." This document delves into the modern methods of repairing underground pipes without the need for extensive excavation, highlighting the numerous advantages and the latest techniques used in the industry.
Learn about the cost savings, reduced environmental impact, and minimal disruption associated with trenchless technology. Discover detailed explanations of popular techniques such as pipe bursting, cured-in-place pipe (CIPP) lining, and directional drilling. Understand how these methods can be applied to various types of infrastructure, from residential plumbing to large-scale municipal systems.
Ideal for homeowners, contractors, engineers, and anyone interested in modern plumbing solutions, this guide provides valuable insights into why trenchless pipe repair is becoming the preferred choice for pipe rehabilitation. Stay informed about the latest advancements and best practices in the field.
TECHNICAL TRAINING MANUAL GENERAL FAMILIARIZATION COURSEDuvanRamosGarzon1
AIRCRAFT GENERAL
The Single Aisle is the most advanced family aircraft in service today, with fly-by-wire flight controls.
The A318, A319, A320 and A321 are twin-engine subsonic medium range aircraft.
The family offers a choice of engines
1. GRLWEAP - Santa Cruz, 20151
Congreso Internacional de Fundaciones Profundas de Bolivia
Santa Cruz, Bolivia, 12 al 15 de Mayo de 2015
Day 1: Software Demonstrations
Frank Rausche, Ph.D., P.E., D.GE - Pile Dynamics, Inc.
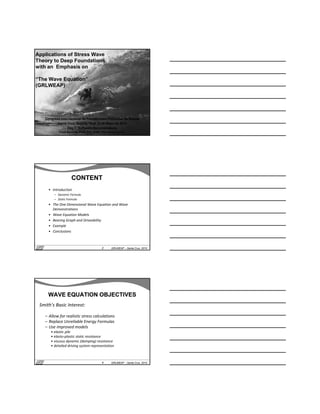
Applications of Stress Wave
Theory to Deep Foundations
with an Emphasis on
“The Wave Equation”
(GRLWEAP)
GRLWEAP - Santa Cruz, 20152
CONTENTCONTENT
• Introduction
– Dynamic Formula
– Static Formula
• The One‐Dimensional Wave Equation and Wave
Demonstrations
• Wave Equation Models
• Bearing Graph and Driveability
• Example
• Conclusions
GRLWEAP - Santa Cruz, 20154
WAVE EQUATION OBJECTIVESWAVE EQUATION OBJECTIVES
Smith’s Basic Interest:
– Allow for realistic stress calculations
– Replace Unreliable Energy Formulas
– Use improved models
• elastic pile
• elasto‐plastic static resistance
• viscous dynamic (damping) resistance
• detailed driving system representation
2. GRLWEAP - Santa Cruz, 20155
Wave Demonstrations
– Slinky
– Pendulum
– Buddies
– Shear Waves
– Compressive Waves
GRLWEAP - Santa Cruz, 20156
Animation courtesy of Dr. Dan Russell, Kettering Univ.
http://paws.kettering.edu/~drussell/demos.html
WAVES
Example of a Baseball Wave
GRLWEAP - Santa Cruz, 20157
Animation courtesy of Dr. Dan Russell, Kettering Univ.
Example of a Shear Wave
3. GRLWEAP - Santa Cruz, 20158
Animation courtesy of Dr. Dan Russell, Kettering Univ.
Example of a Compressive Wave
GRLWEAP - Santa Cruz, 20159
The 1-D Wave Equation
ρ(δ2u/ δt2) = E (δ2u/ δx2)
E … elastic modulus
ρ … mass density
with c2 = E/ ρ ... Wave Speed
Solution: u = f(x‐ct) + g(x+ct)
x … length coordinate
t ... time
u … displacement
f
g
x
GRLWEAP - Santa Cruz, 201510
x
Time
t
The compression
wave,induced by the
hammer at the pile top,
moves downward a
distance c t during the
time interval t.
Waves in a PileWaves in a Pile
4. GRLWEAP - Santa Cruz, 201511
x
Time
t t + t
C t
The compression wave,
induced by the hammer
at the pile top, moves
downward a distance c
t during the time
interval t.
Waves in a PileWaves in a Pile
GRLWEAP - Santa Cruz, 201512
The compression wave,
arrives at the pile toe where it
is reflected
(on a free pile in tension).
t Time t + t Waves in a Pile
GRLWEAP - Santa Cruz, 201513
2012 13 Wave Mechanics for Pile Testers
x
u
ρ(δ2u/ δt2) = E (δ2u/ δx2)
E … elastic modulus
ρ … mass density
with c2 = E/ ρ … Wave Speed
x … length coordinate t ... time
u … displacement
THE Wave Equation
Solution: u = f(x-ct) + g(x+ct)
5. GRLWEAP - Santa Cruz, 201514
2012 14 Wave Mechanics for Pile Testers
f
g
x
f
g
x
C t
C t
Time
t + t
Time
t
The Solution to the Wave Equation
u = f(x-ct) + g(x+ct)
GRLWEAP - Santa Cruz, 201515
Force, F – Time to + t
Point A
Point A, like all other
points along the pile, is
at rest at time to (when
contact between ram and
pile top occurs)
Compressed
distance, L
Time to
u
The first instant after impact
GRLWEAP - Santa Cruz, 201516
∆u is the displacement of a point of pile during time ∆t
F
∆L
Wave travels distance ∆L = c ∆t during time ∆t
Particle Velocity, v = ∆u/ ∆t
but ∆u = ε ∆L and therefore v = ε ∆L / ∆t
and with wave speed c = ∆L / ∆t:
∆u
Force Velocity ProportionalityForce Velocity Proportionality
v = ε c
6. GRLWEAP - Santa Cruz, 201517
This is the strain, stress, force-velocity
proportionality
Z = EA/c is the pile impedance (kN/m/s)
This is the strain, stress, force-velocity
proportionality
Z = EA/c is the pile impedance (kN/m/s)
Fd = vd (EA/c)Fd = vd (EA/c)
d = vd(E/c)d = vd(E/c)εd = vd / cεd = vd / c
Strain-Stress-Force Proportionality
Wave travels in one direction only
Strain-Stress-Force Proportionality
Wave travels in one direction only
GRLWEAP - Santa Cruz, 201518
Express Your ImpedanceExpress Your Impedance
Z = EA/c kN/(m/s)
with c = (E/ρ)1/2 Z = A (E ρ)1/2
with E = c2 ρ Z = A c ρ
with Mp= L A ρ Z = Mp c/ L (Mp ... pile mass)
The Pile Impedance is a force which changes the pile
velocity suddenly by 1 m/s.
Reversely, if the velocity changes by 1 m/s then pile
will develop a force equal to Z.
GRLWEAP - Santa Cruz, 201519
A Quick Look at Energy FormulasA Quick Look at Energy Formulas
Energy Dissipated in Soil =
Energy Provided by Hammer
Ru (s + sl) = ηWr h
sl … “lost” set (empirical or measured),
η … efficiency of hammer/driving system
Engineering News: Rallow = Wr h / 6(s + 0.1)
7. GRLWEAP - Santa Cruz, 201520
The Gates FormulaThe Gates Formula
Ru = 7 (Wrh)½ log(10Blows/25 mm) ‐ 550
Ru … Nominal Resistance (kN)
Wr… ram weight (kN)
h … actual stroke (m)
log … logarithm to base 10
GRLWEAP - Santa Cruz, 201521
The Hiley Formula
using Set-Rebound Measurements
The Hiley Formula
using Set-Rebound Measurements
Ru = ηWr h (Wr+ e2 WP)
(s + c/2) (Wr + WP)
Rebound: c
Set = s
Considers combined pile‐soil elasticity effect
Usually with F.S. = 3; η = hammer efficiency.
GRLWEAP - Santa Cruz, 201522
Bearing Graphs from 2 Energy Formulas
Hammer D 19-42; Er = 59 kJ
Bearing Graphs from 2 Energy Formulas
Hammer D 19-42; Er = 59 kJ
Ru = ηEr /(s + sl)
η = 1/3; sl = 2.5mm
Ru = 1.6 Ep ½ log(10Blows/25mm) – 120 kN
4000
[900]
Ru - kN
[kips]
2000
[450]
0
0 5 10 15 20
Blows/25mm
8. GRLWEAP - Santa Cruz, 201523
Shortcomings of FormulasShortcomings of Formulas
• Rigid pile model
• Poor hammer representation
• Inherently inaccurate for both capacity and blow
count predictions
• No stress results
• Unknown hammer energy
• Relies on EOD Blow Counts
GRLWEAP - Santa Cruz, 201524
Static FormulasStatic Formulas
• Based on Soil Properties
• Always done for any deep foundation type
• Backed up by Static or Dynamic Testing
GRLWEAP - Santa Cruz, 201525
Static Analysis to Calculate LTSR
Basically for All Soil Types:
Ru = Ru,shaft + Ru,toe
Ru = fsAs + qt At
fs, Ru,shaft, As … Shaft Resistance/Area
qt, Ru,toe, At … End Bearing/Area
9. GRLWEAP - Santa Cruz, 201526
The β-Method for Cohesionless Soils
• Ru,shaft = fs As
– fs = ko tan(δ) po
po is the effective overburden pressure
ko is some earth pressure coefficient
– β = ko tan(δ)
• Ru,toe = Nt po At
Nt is a bearing capacity factor
All with Certain Limits
GRLWEAP - Santa Cruz, 201527
The α-Method for Cohesive Soils
• Ru,shaft = fs As
– fs = α c
c is the undrained shear strength
α is a function of po
• Ru,toe = 9 c At
..... with certain limits
GRLWEAP provides 4 different static analysis methods
ST – based on Soil Type; SA‐ based on SPT‐N; CPT; API
GRLWEAP - Santa Cruz, 201528
GRLWEAP: ST Method
Non-Cohesive Soils (after Bowles)
Soil Parameters in ST Analysis for Granular Soil Types
Soil Type SPT N
Friction
Angle
Unit Weight, γ β Nt Limit (kPa)
degrees kN/m3 Qs Qt
Very loose 2 25 - 30 13.5 0.203 12.1 24 2400
Loose 7 27 - 32 16 0.242 18.1 48 4800
Medium 20 30 - 35 18.5 0.313 33.2 72 7200
Dense 40 35 - 40 19.5 0.483 86.0 96 9600
Very Dense 50+ 38 - 43 22 0.627 147.0 192 19000
10. GRLWEAP - Santa Cruz, 201529
ST - INPUTST - INPUT
GRLWEAP - Santa Cruz, 201530
GRLWEAP: ST Method
Cohesive Soils (after Bowles)
Soil Parameters in ST Analysis for Cohesive Soil Types
Soil Type SPT N
Unconfined Compr.
Strength
Unit Weight γ Qs Qt
kPa kN/m3 kPa kPa
Very soft 1 12 17.5 3.5 54
Soft 3 36 17.5 10.5 162
Medium 6 72 18.5 19 324
Stiff 12 144 20.5 38.5 648
Very stiff 24 288 20.5 63.5 1296
hard 32+ 384+ 19 – 22 77 1728
GRLWEAP - Santa Cruz, 201531
ST - INPUTST - INPUT
11. GRLWEAP - Santa Cruz, 201532
The Wave Equation ModelThe Wave Equation Model
• The Wave Equation Analysis calculates
– The displacement of any point along a slender, elastic
rod at any time durting and after impact
– From the displacements forces, stresses, velocities
• The calculation is based on rod properties:
– Length
– Cross Sectional Area
– Elastic Modulus
– Mass density
GRLWEAP - Santa Cruz, 201533
The Wave Equation ModelThe Wave Equation Model
• The Wave Equation Analysis calculates
– The displacement of any point along a slender, elastic
rod at any time durting and after impact
– From the displacements forces, stresses, velocities
• The calculation is based on rod properties:
– Length
– Cross Sectional Area
– Elastic Modulus
– Mass density
GRLWEAP - Santa Cruz, 201534
GRLWEAP FundamentalsGRLWEAP Fundamentals
• For a pile driving analysis, the “slender,
elastic rod” consists of Hammer+Driving
System+Pile
• The soil is represented by resistance forces
acting on the pile and representing the
forces in the pile‐soil interface
Hammer
D.S.
Pile
12. GRLWEAP - Santa Cruz, 201535
Smith’s Numerical Solution of the Wave EquationSmith’s Numerical Solution of the Wave Equation
∆L
ρ(δ2u/ δt2) = E (δ2u/ δx2)
E … elastic modulus ‐ ρ … mass densitywith c2 = E/ ρ ... Wave Speed
Closed Form Solutions to the wave equation are
not practical; we therefore solve the
equation numerically:
(mi/ki)(ui,j+1 ‐2ui,j + ui,j‐1)/Δt2
= (ui+1,j – 2ui,j + ui‐1,j)
This is equivalent to considering mass points
and springs!
i
i+1
i-1
GRLWEAP - Santa Cruz, 201536
The GRLWEAP Pile ModelThe GRLWEAP Pile Model
Each segment has a mass and spring stiffness
– of length ∆L ≤ 1 m (3.3 ft)
– with mass m = ρ A ∆L
– and stiffness k = E A / ∆L
there are N = L / ∆L pile segments which allow
us to solve the wave equation numerically.
∆L
GRLWEAP - Santa Cruz, 201537
The Pile ModelThe Pile Model
Relationship between the uniform pile and the
lumped mass model properties:
m k = (ρ A ∆L)(EA/∆L) = A2Eρ = Z2 [kN s/m]2
m/k = (ρ A ∆L)/(EA/∆L) = (ρ/E)∆L2 = (∆L/c)2 [s]2
Or
Z = (mk)1/2 (pile impedance) and
∆t = (m/k)1/2 (wave travel time)
Note: the smaller ∆L, the smaller ∆L and that
means the higher the frequencies that can be
represented.
∆L
13. GRLWEAP - Santa Cruz, 201540
We can model 3 hammer-pile systemsWe can model 3 hammer-pile systems
GRLWEAP - Santa Cruz, 201541
Ram: A, L for stiffness, mass
Cylinder and upper frame =
assembly top mass
Drop height
External Combustion Hammer Modeling
Ram guides for assembly stiffness
Hammer base =
assembly bottom mass
GRLWEAP - Santa Cruz, 201542
External Combustion Hammer ModelExternal Combustion Hammer Model
• Ram modeled like rod
• Stroke is an input (Energy/Ram Weight)
• Impact Velocity Calculated from Stroke with Hammer
Efficiency Reduction: vi = (2 g h η) ½
• Assembly also modeled because it may impact during
pile rebound
• Note approximation in data file:
Assembly mass = Total hammer mass – Ram mass
14. GRLWEAP - Santa Cruz, 201543
External Combustion Hammers
Ram Model
Ram segments
~1m long
Combined Ram‐
H.Cushion
Helmet mass
GRLWEAP - Santa Cruz, 201544
External Combustion Hammers
Assembly model
External Combustion Hammers
Assembly model
Assembly segments,
typically 2
Helmet mass
GRLWEAP - Santa Cruz, 201545
External Combustion Hammers
Combined Ram Assembly Model
External Combustion Hammers
Combined Ram Assembly Model
Combined Ram-
H.Cushion
Helmet mass
Ram segments
Assembly segments
15. GRLWEAP - Santa Cruz, 201546
External Combustion Hammer
Analysis Procedure
• Static equilibrium analysis
• Dynamic analysis starts when ram is within 1 ms of
impact.
• All ram segments then have velocity
VRAM = (2 g h η)1/2 – 0.001 g
g is the gravitational acceleration
h is the equivalent hammer stroke and η is the hammer efficiency
h = Hammer potential energy/ Ram weight
GRLWEAP - Santa Cruz, 201547
• Dynamic analysis ends when
– Pile toe has rebounded to 80% of max dtoe
– Pile has penetrated more than 4 inches
– Pile toe has rebounded to 98% of max dtoe and energy
in pile is essentially dissipated
External Combustion Hammer
Analysis Procedure
GRLWEAP - Santa Cruz, 201548
Diesel HammersDiesel Hammers
• Very popular in the US
• Have their own fuel tank
and combustion “engine”
• Model therefore includes a
thermodynamic analysis
• Stroke is computed
16. GRLWEAP - Santa Cruz, 201558
GRLWEAP hammer efficiencies
ηh = Ek/EP
GRLWEAP hammer efficiencies
ηh = Ek/EP
•The hammer efficiency reduces the impact velocity of
the ram; it is based on experience
•Hammer efficiencies cover all losses which cannot be
calculated
•Diesel hammer energy loss due to pre‐compression or
cushioning can be calculated and, therefore, is not
covered by hammer efficiency
GRLWEAP - Santa Cruz, 201560
WR
h
ER = WR h
Manufacturer’s Rating
WR
Max ET = ∫F(t) v(t) dt
(EMX, ENTHRU)
ηT = ENTHRU/ ER
(transfer ratio or efficiency) Measure:
Force, F(t)
Velocity, v(t)
Measured Transferred
Energy
Measured Transferred
Energy
GRLWEAP - Santa Cruz, 201562
Measured Transfer Ratios for Diesels
Steel Piles Concrete Piles
17. GRLWEAP - Santa Cruz, 201563
For all impact hammers GRLWEAP
needs impact velocity
WP
mR
h
Er = Wr he = mr g he
he = Er / Wr he – equivalent stroke
he = h for single acting hammers
Epr = η Er Wr he (η = Hammer efficiency )
WR
vi
Ek = Epr = ηh (½ mr vi
2) (kinetic energy)
vi = 2g heηh
GRLWEAP - Santa Cruz, 201564
GRLWEAP
Diesel hammer efficiencies , ηh
GRLWEAP
Diesel hammer efficiencies , ηh
Open end diesel hammers: 0.80
uncertainty of fall height, friction, alignment
Closed end diesel hammers: 0.80
uncertainty of fall height, friction, power assist, alignment
GRLWEAP - Santa Cruz, 201565
Modern Hydraulic Hammer
Efficiencies, ηh
Modern Hydraulic Hammer
Efficiencies, ηh
Hammers with internal monitor: 0.95
uncertainty of hammer alignment
Hydraulic drop hammers: 0.80
uncertainty of fall height, alignment, friction
Power assisted hydraulic hammers: 0.80
uncertainty of fall height, alignment, friction, power assist
18. GRLWEAP - Santa Cruz, 201568
Vibratory
Hammers
Vibratory
Hammers
GRLWEAP - Santa Cruz, 201569
Vibratory Force:
FV = me [ω2resin ω t ‐ a2(t)]
FL
FV
m1
m2
• Line Force
• Bias Mass and
• Oscillator mass, m2
• Eccentric masses, me,
radii, re
• Clamp
Vibratory Hammer ModelVibratory Hammer Model
GRLWEAP - Santa Cruz, 201571
The Driving Systems
Consists of
1. Helmet including inserts to
align hammer and pile
2. Optionally: Hammer Cushion
to protect hammer
3. For Concrete Piles: Softwood
Cushion
Driving System ModelsDriving System Models
19. GRLWEAP - Santa Cruz, 201572
Helmet + Inserts
Driving System Model
Example of a diesel hammer
on a concrete piles
Driving System Model
Example of a diesel hammer
on a concrete piles
Hammer Cushion: Spring plus
Dashpot
Pile Top: Spring + Dashpot
Pile Cushion
GRLWEAP - Santa Cruz, 201575
Interface Soil: Elasto‐
Plastic Springs and
Viscous Dashpots
Soil outside of
interface: Rigid
The
Soil Model After Smith
GRLWEAP - Santa Cruz, 201576
Soil ResistanceSoil Resistance
• Soil resistance slows pile movement and causes pile
rebound
• A very slowly moving pile only encounters static
resistance
• A rapidly moving pile also encounters dynamic
resistance
• The static resistance to driving (SRD) differs from the
soil resistance under static loads
20. GRLWEAP - Santa Cruz, 201577
Segment
i
Segment
i‐1
Segment
i+1
Pile‐Soil Interface
Soil Model ParametersSoil Model Parameters
ki,Rui
Ji
RIGID SOIL
ki+1,Rui+1
Ji+1
ki-1,Rui-1
Ji-1
GRLWEAP - Santa Cruz, 201578
Fixed
Soil
Smith’s Soil ModelSmith’s Soil Model
Total Soil Resistance
Rtotal = Rsi +Rdi
Total Soil Resistance
Rtotal = Rsi +Rdi
Displacement ui
Velocity vi
Pile
Segment i
GRLWEAP - Santa Cruz, 201579
The Static Soil ModelThe Static Soil Model
Displacement ui
Velocity vi
Pile
Segment i
Pile Displacement
Rui
Static Resistance
Rui … ult. resistance
qi … quake
ksi = Rui /qi
21. GRLWEAP - Santa Cruz, 201582
Recommended Toe Quakes, qtoeRecommended Toe Quakes, qtoe
0.1” or 2.5 mm for
all soil types
0.04” or 1 mm for
hard rock
qtoe
Static Toe Res.
qtoe Ru,toe
Toe Displacement
D/120 for very dense or
hard soils
D/60 for soils which are
not very dense or v. hard
Displacement pilesNon‐displacement piles
D
GRLWEAP - Santa Cruz, 201583
Toe Quake Effect on Blow CountToe Quake Effect on Blow Count
S200
100m
610x12
95m
Approximatelyy 50% Shaft Resistance
Total No. of Blows: ∞ (qt =D/60); 27,490 (qt=D/120)
0
10
20
30
40
50
60
70
80
90
100
0 200 400 600 800
DepthofPileToePenetration-m
Blow Count - Blows/m
qt = D/60
qt = D/120
GRLWEAP - Santa Cruz, 201584
The Dynamic Soil ModelThe Dynamic Soil Model
Displacement ui
Velocity vi
Pile
Segment i
Rd = RuJsv v
Smith‐viscous
damping factor,
Jsv [s/m or s/ft]
For RSA and
Vibratory Analysis
Smith damping
factor,
Js [s/m or s/ft]
Rd = RsJs v
Standard
22. GRLWEAP - Santa Cruz, 201585
Recommended Smith damping factors
(Js or Jsv)
Recommended Smith damping factors
(Js or Jsv)
Shaft
Clay: 0.65 s/m or 0.20 s/ft
Sand: 0.16 s/m or 0.05 s/ft
Silts: use an intermediate value
Layered soils: use a weighted average
for bearing graph
Toe
All soils: 0.50 s/m or 0.15 s/ft
GRLWEAP - Santa Cruz, 201586
Shaft Damping on Blow CountShaft Damping on Blow Count
S200
100m
610x12
95m
Approximatelyy 50% Shaft Resistance
Total No. of Blows: ∞ (Js=0.65 s/m); 27,490 (Js=0.16 s/m)
0
10
20
30
40
50
60
70
80
90
100
0 200 400 600 800
DepthofPileToePenetration-m
Blow Count - Blows/m
Js = 0.65 s/m
Js = 0.16 s/m
GRLWEAP - Santa Cruz, 201588
GRLWEAP’s Static Analysis MethodsGRLWEAP’s Static Analysis Methods
Rs
Rt
Q
Icon Input Basic Analysis
ST Soil Type Effective Stress, Total Stress
SA SPT N-value Effective Stress
CPT R at cone tip and sleeve Schmertmann
API φ, Su Effective Stress, Total Stress
• GRLWEAP’s static analysis methods may be used
for dynamic analysis preparation (resistance
distribution, estimate of capacity for driveability).
• For design, be sure to use a method based on
local experience.
23. GRLWEAP - Santa Cruz, 201589
Use of Static Analysis MethodsUse of Static Analysis Methods
• Should always be done for finding reasonable pile type
and length
• For driven piles static analysis is only a starting point,
since pile length is determined in the field (exceptions are
piles driven to depth, for example, because of high soil
setup)
• For LRFD when finding pile length by static analysis
method use resistance factor for selected capacity
verification method
GRLWEAP - Santa Cruz, 201592
Resistance DistributionResistance Distribution
3. More Involved:
I. ST Input: Soil Type
II. SA Input: SPT Blow Count, Friction
Angle or Unconfined Compressive
Strength
III. API (offshore wave version)
Input: Friction Angle or Undrained
Shear Strength
IV. CPT Input: Cone Record including Tip
Resistance and Sleeve Friction vs
Depth.
Penetration
All are good for a Bearing Graph
II, III and IV OK for Driveability Analysis
Local experience may provide better values
GRLWEAP - Santa Cruz, 201594
Mass i
Mass i-1
Mass i+1
Numerical TreatmentNumerical Treatment
• Predict displacements:
uni = uoi + voi ∆t
Fi, ci
uni-1
uni
uni+1
Ri-1
Ri
Ri+1
• Calculate spring compression:
ci = uni - uni-1
• Calculate spring forces:
Fi = ki ci
• Calculate resistance forces:
Ri = Rsi + Rdi
24. GRLWEAP - Santa Cruz, 201595
Force balance at a segmentForce balance at a segment
Acceleration: ai = (Fi + Wi – Ri – Fi+1) / mi
Velocity, vi, and Displacement, ui, from Integration
Mass i
Force from upper spring, Fi
Force from lower spring, Fi+1
Resistance force, Ri Weight, Wi
GRLWEAP - Santa Cruz, 201597
Set or Blow Count Calculation
(a) Simplified: extrapolated toe displacement
Set or Blow Count Calculation
(a) Simplified: extrapolated toe displacement
Static soil Resistance
Pile
Displacement
Final Set
Max. Displacement
Quake
Ru
Extrapolated
Calculated
GRLWEAP - Santa Cruz, 2015100
Blow Count Calculation
(b) Residual Stress Analysis (RSA)
Blow Count Calculation
(b) Residual Stress Analysis (RSA)
Set for 2 Blows
Convergence:
Consecutive Blows
have same
pile compression/sets
25. GRLWEAP - Santa Cruz, 2015101
RSA Effect on Blow CountRSA Effect on Blow Count
S500
100m
1220x25
0
10
20
30
40
50
60
70
80
90
100
0 200 400 600 800
DepthofPileToePenetration-m
Blow Count - Blows/m
Standard
RSA
95m
Total No. of Blows: 8907 (Standard); 6235 (RSA)
GRLWEAP - Santa Cruz, 2015103
Static Equilibrium
Ram velocity
Dynamic analysis
Program Flow – Bearing GraphProgram Flow – Bearing Graph
Model hammer,
driving system
and pile
• Pile stresses
• Energy transfer
• Pile velocitiesChoose first Ru
Calculate Blow
Count
Distribute Ru
Set Soil Constants
Output
Increase
Ru?
Increase Ru
Input
N
Y
GRLWEAP - Santa Cruz, 2015104
Bearing Graph: Variable Capacity, One depth
SI-Units; Clay and Sand Example; D19-42; HP 12x53;
Bearing Graph: Variable Capacity, One depth
SI-Units; Clay and Sand Example; D19-42; HP 12x53;
26. GRLWEAP - Santa Cruz, 2015107
Driveability AnalysisDriveability Analysis
• Analyze a series of Bearing Graphs for different
depths for SRD and/or LTSR
• Put the results in sequence so that we get predicted
blow count and stresses vs pile toe penetration
• Note that, in many or most cases, shaft resistance is
lower during driving (soil setup) and end bearing is
about the same as long term
• In the few cases of relaxation, the toe resistance is
actually higher during driving than long term
GRLWEAP - Santa Cruz, 2015108
Analysis
Program Flow – DriveabilityProgram Flow – Driveability
Model Hammer &
Driving System
Choose first
Depth to analyze
Next G/L
Pile Length and
Model
Calculate Ru
for first gain/loss
OutputIncrease
Depth?
Increase Depth
Input
Increase
G/L?
N
N
Y
Y
GRLWEAP - Santa Cruz, 2015109
Driveability Result
During a driving interruption soil setup occurs
27. GRLWEAP - Santa Cruz, 2015110
When Should we do the Analysis?When Should we do the Analysis?
• Before pile driving begins
– Equipment selection for safe and efficient installation
– Preliminary driving criterion
• After initial pile tests have been done
– Refined Wave Equation analysis for improved driving
criterion
– For different driving systems
• In preparation of dynamic testing
GRLWEAP - Santa Cruz, 2015111
SummarySummary
• The wave equation analysis simulates what happens in
the pile when it is struck by a heavy hammer input.
• It calculates a relationship between capacity and blow
count, or blow count vs. depth.
• The analysis model represents hammer (3 types), driving
system (cushions, helmet), pile (concrete, steel, timber)
and soil (at the pile‐soil interface)
• GRLWEAP provides a variety of input help features
(hammer and driving system data, static formulas among
others).
GRLWEAP - Santa Cruz, 2015112
An example for a Dynamic Test
Preparation
An example for a Dynamic Test
Preparation
• Prepare dynamic test on a 400 mm dia.
pile with Expander Body of 600 mm
diameter and 2000 mm length.
• Sand and Gravel
• Drop Weights 5 and 8 tons
• Drop Height 1.2 m
• Cushion 100 mm
28. GRLWEAP - Santa Cruz, 2015113
Ananlysis of a Pile with Expander BodyAnanlysis of a Pile with Expander Body
GRLWEAP - Santa Cruz, 2015114
Analysis results
Hammers 1 m drop height, 9 inch cushioin
Analysis results
Hammers 1 m drop height, 9 inch cushioin
GRLWEAP - Santa Cruz, 2015115
Thank you for your
attention!
QUESTIONS?
Thank you for your
attention!
QUESTIONS?