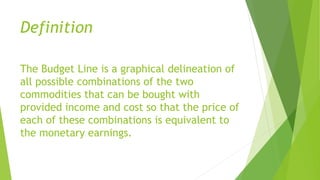
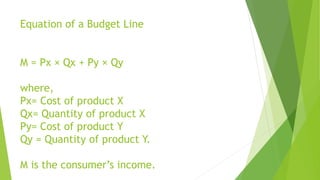
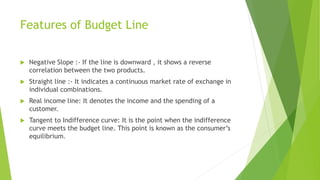
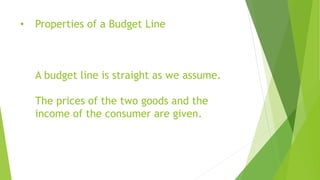
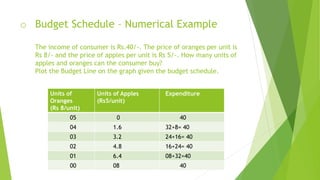
Budget Line
Definition of a Budget Line
Equation of a Budget Line
Features of a Budget Line
Properties of a Budget line
Budget Schedule -Numerical Example
Definition
The Budget Line is a graphical delineation of
all possible combinations of the two
commodities that can be bought with
provided income and cost so that the price of
each of these combinations is equivalent to
the monetary earnings.
Equation of a Budget Line
M = Px × Qx + Py × Qy
where,
Px= Cost of product X
Qx= Quantity of product X
Py= Cost of product Y
Qy = Quantity of product Y.
M is the consumer’s income.
Features of Budget Line
 Negative Slope :- If the line is downward , it shows a reverse
correlation between the two products.
 Straight line :- It indicates a continuous market rate of exchange in
individual combinations.
 Real income line: It denotes the income and the spending of a
customer.
 Tangent to Indifference curve: It is the point when the indifference
curve meets the budget line. This point is known as the consumer’s
equilibrium.
• Properties of a Budget Line
A budget line is straight as we assume.
The prices of the two goods and the
income of the consumer are given.
o Budget Schedule – Numerical Example
The income of consumer is Rs.40/-. The price of oranges per unit is
Rs 8/- and the price of apples per unit is Rs 5/-. How many units of
apples and oranges can the consumer buy?
Plot the Budget Line on the graph given the budget schedule.
Units of
Oranges
(Rs 8/unit)
Units of Apples
(Rs5/unit)
Expenditure
05 0 40
04 1.6 32+8= 40
03 3.2 24+16= 40
02 4.8 16+24= 40
01 6.4 08+32=40
00 08 40

Budget Line.pptx

  • 1.
    Budget Line Definition ofa Budget Line Equation of a Budget Line Features of a Budget Line Properties of a Budget line Budget Schedule -Numerical Example
  • 2.
    Definition The Budget Lineis a graphical delineation of all possible combinations of the two commodities that can be bought with provided income and cost so that the price of each of these combinations is equivalent to the monetary earnings.
  • 3.
    Equation of aBudget Line M = Px × Qx + Py × Qy where, Px= Cost of product X Qx= Quantity of product X Py= Cost of product Y Qy = Quantity of product Y. M is the consumer’s income.
  • 4.
    Features of BudgetLine  Negative Slope :- If the line is downward , it shows a reverse correlation between the two products.  Straight line :- It indicates a continuous market rate of exchange in individual combinations.  Real income line: It denotes the income and the spending of a customer.  Tangent to Indifference curve: It is the point when the indifference curve meets the budget line. This point is known as the consumer’s equilibrium.
  • 5.
    • Properties ofa Budget Line A budget line is straight as we assume. The prices of the two goods and the income of the consumer are given.
  • 6.
    o Budget Schedule– Numerical Example The income of consumer is Rs.40/-. The price of oranges per unit is Rs 8/- and the price of apples per unit is Rs 5/-. How many units of apples and oranges can the consumer buy? Plot the Budget Line on the graph given the budget schedule. Units of Oranges (Rs 8/unit) Units of Apples (Rs5/unit) Expenditure 05 0 40 04 1.6 32+8= 40 03 3.2 24+16= 40 02 4.8 16+24= 40 01 6.4 08+32=40 00 08 40