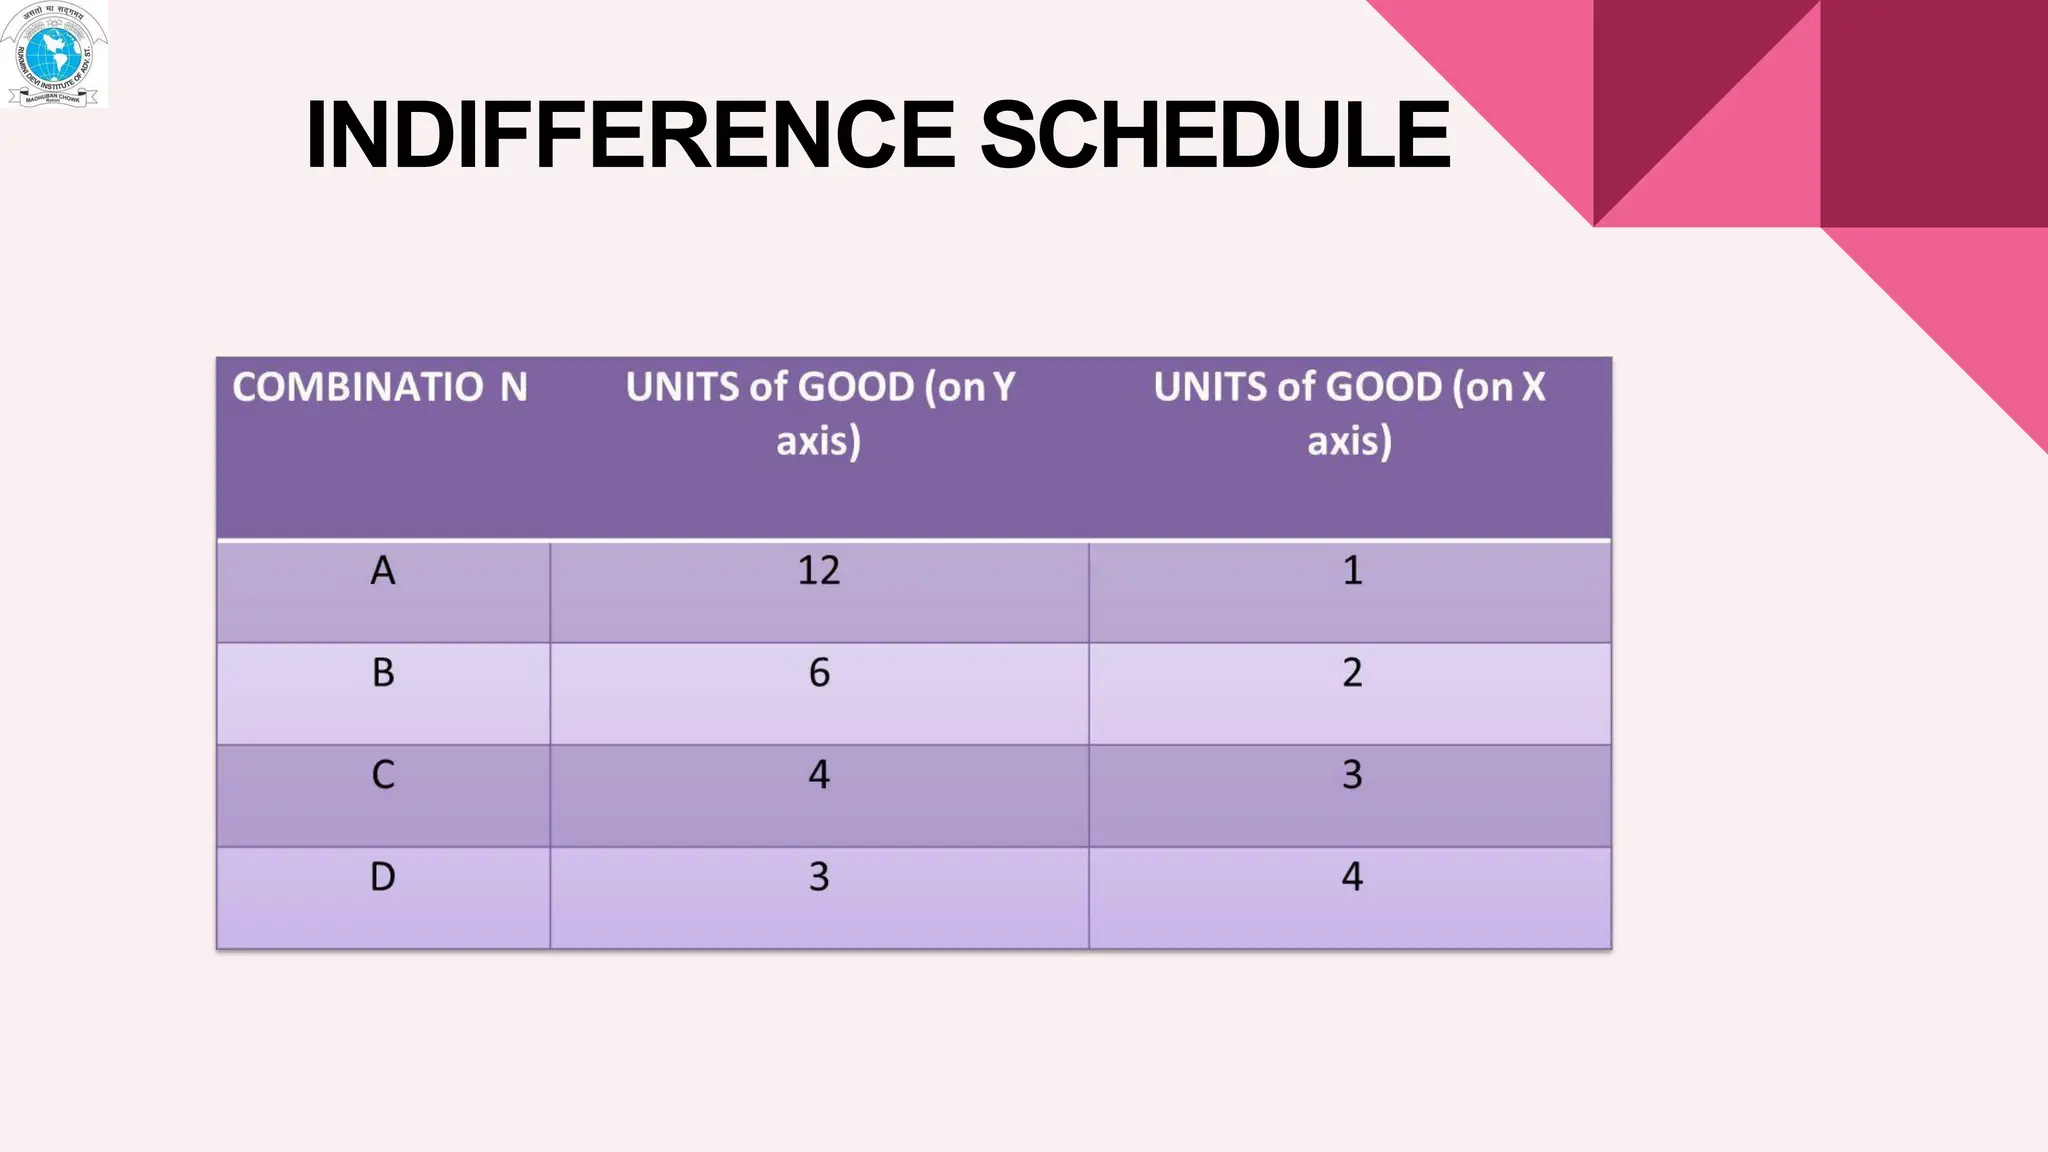
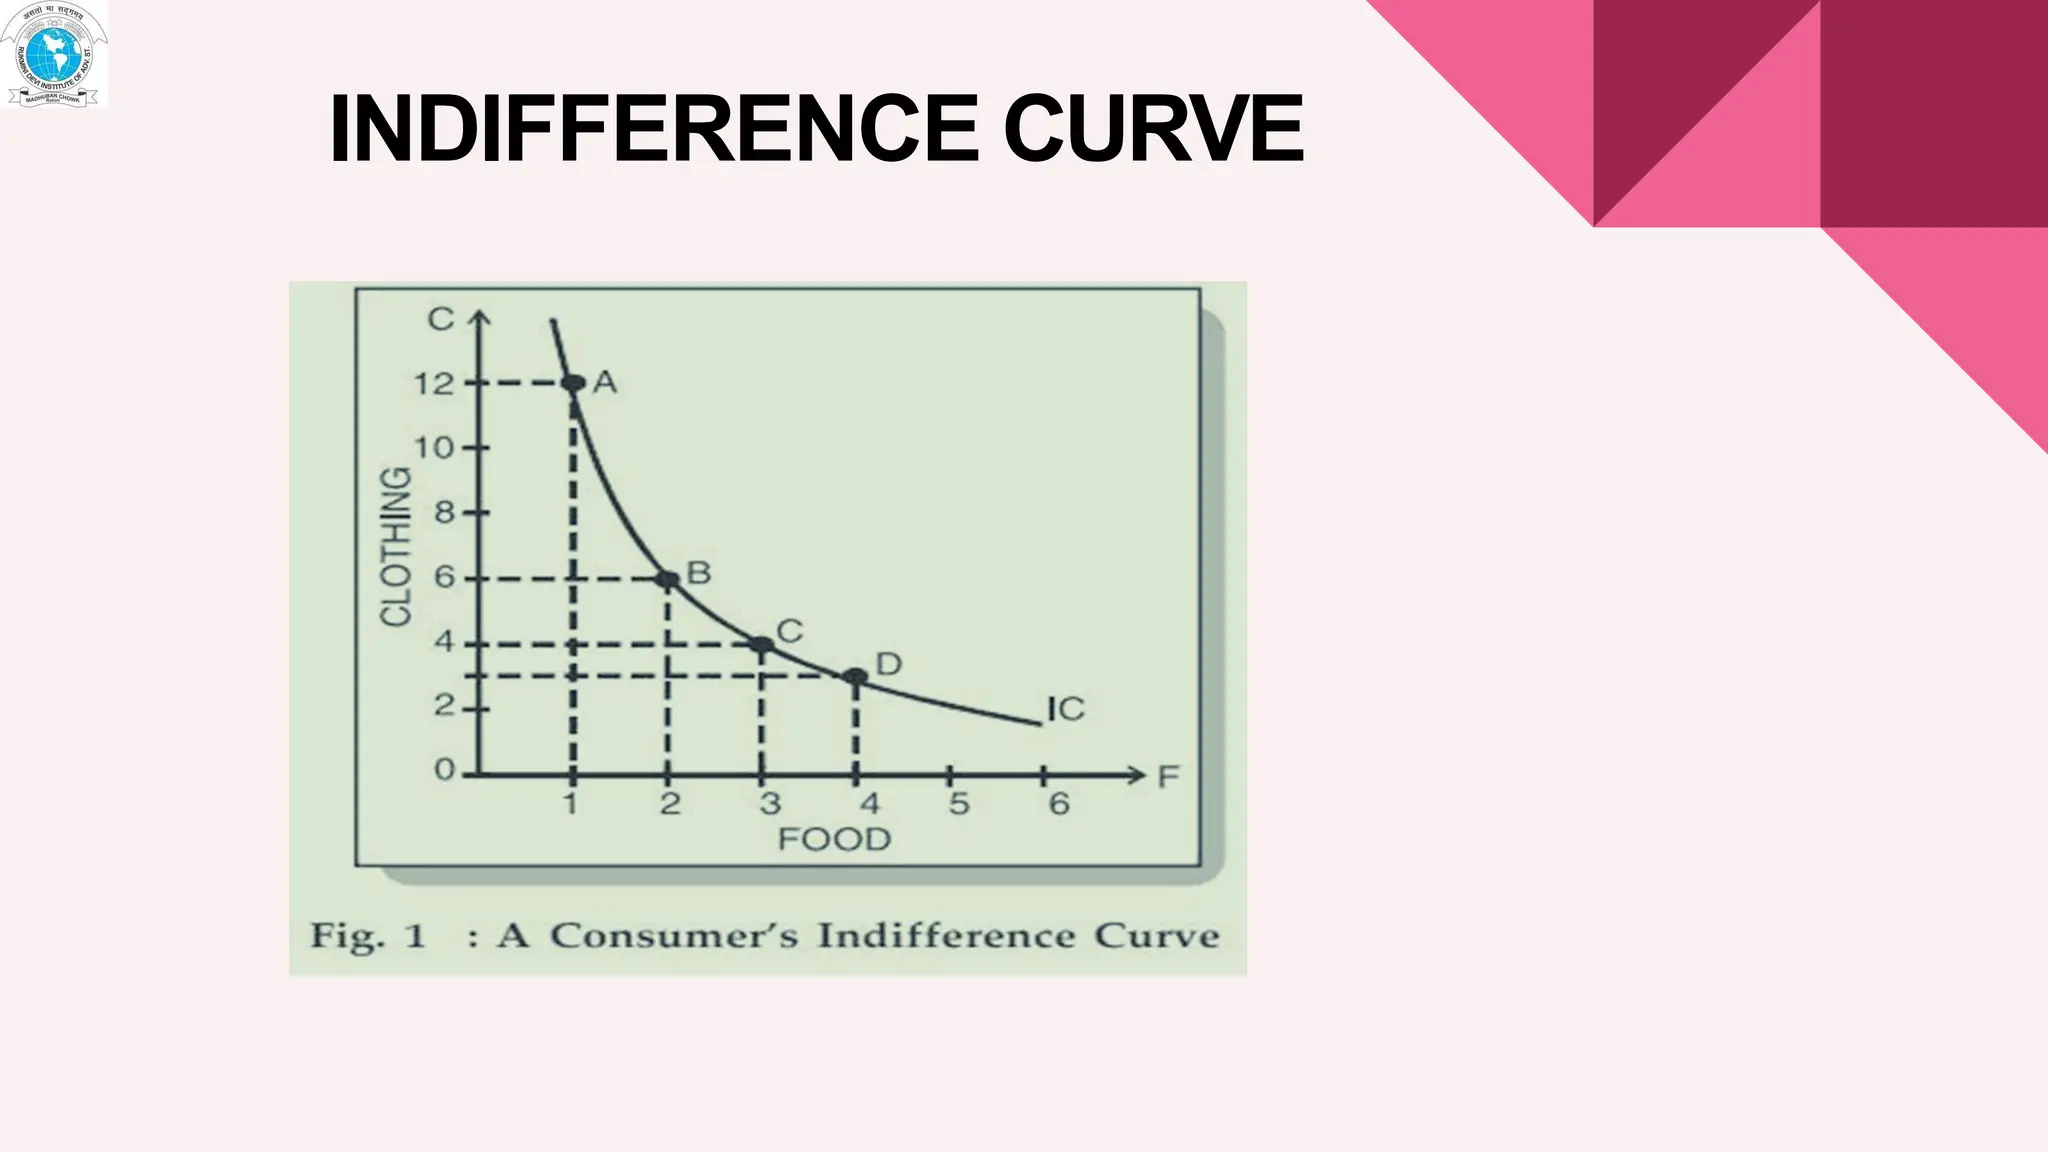
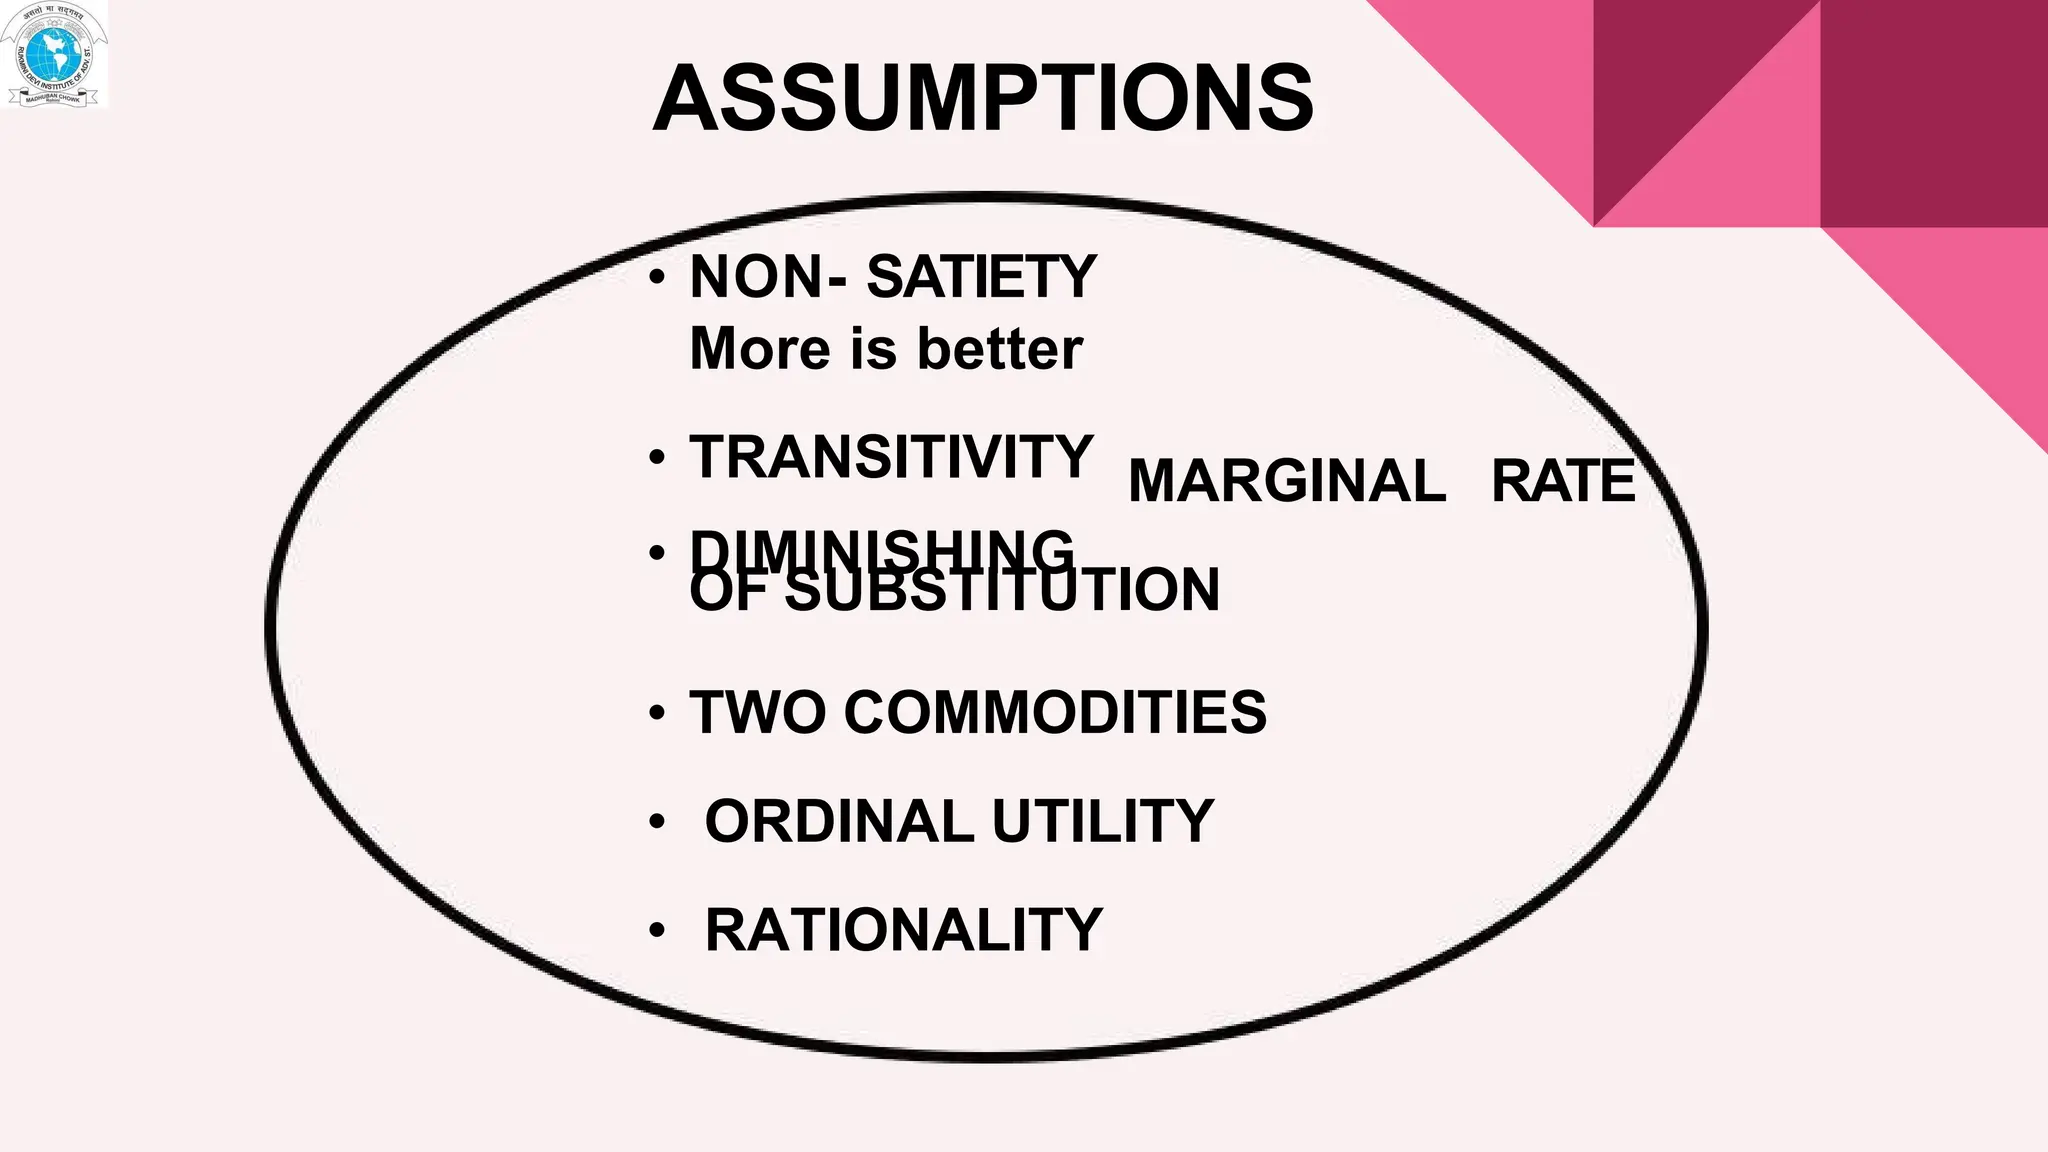
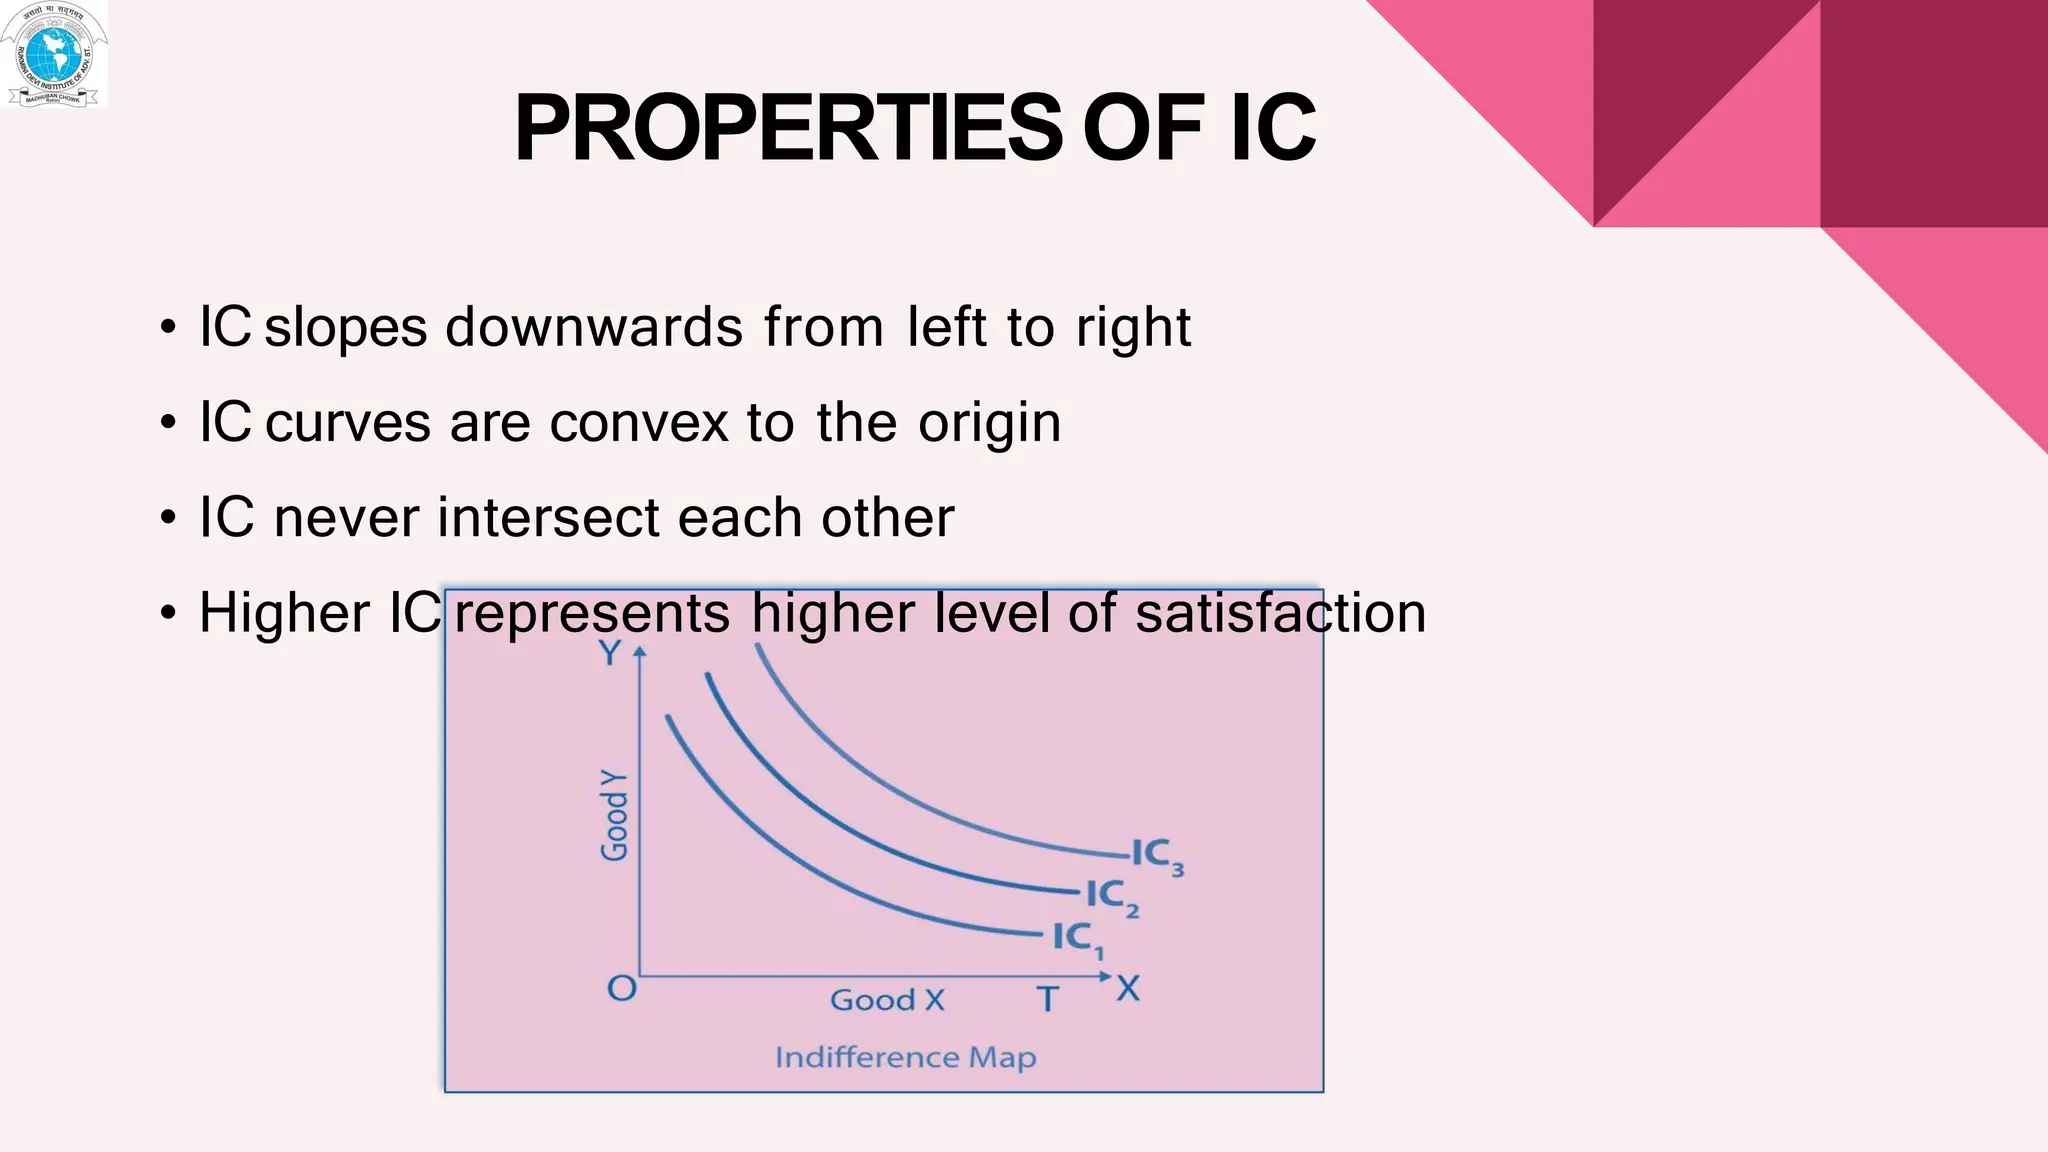
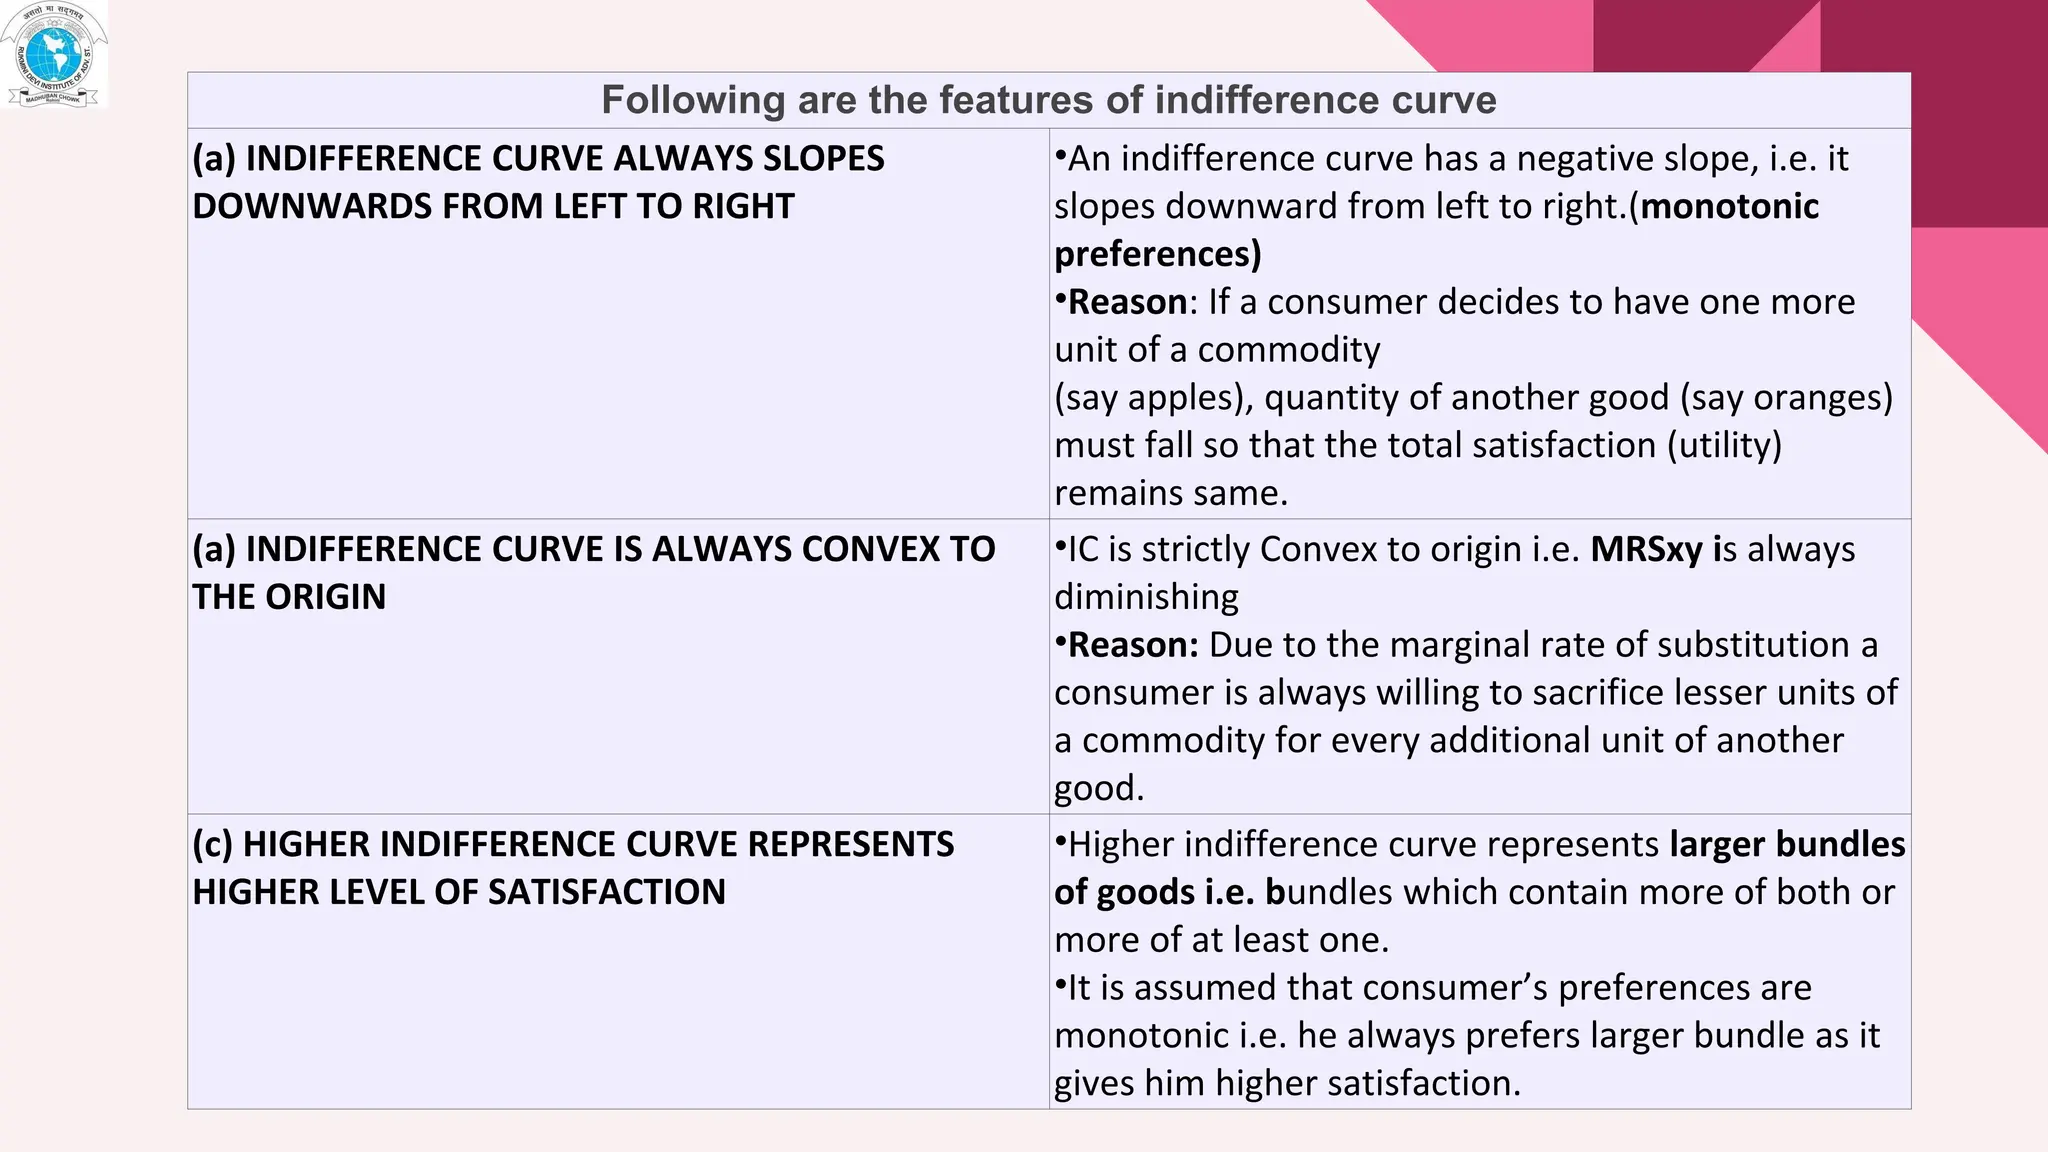
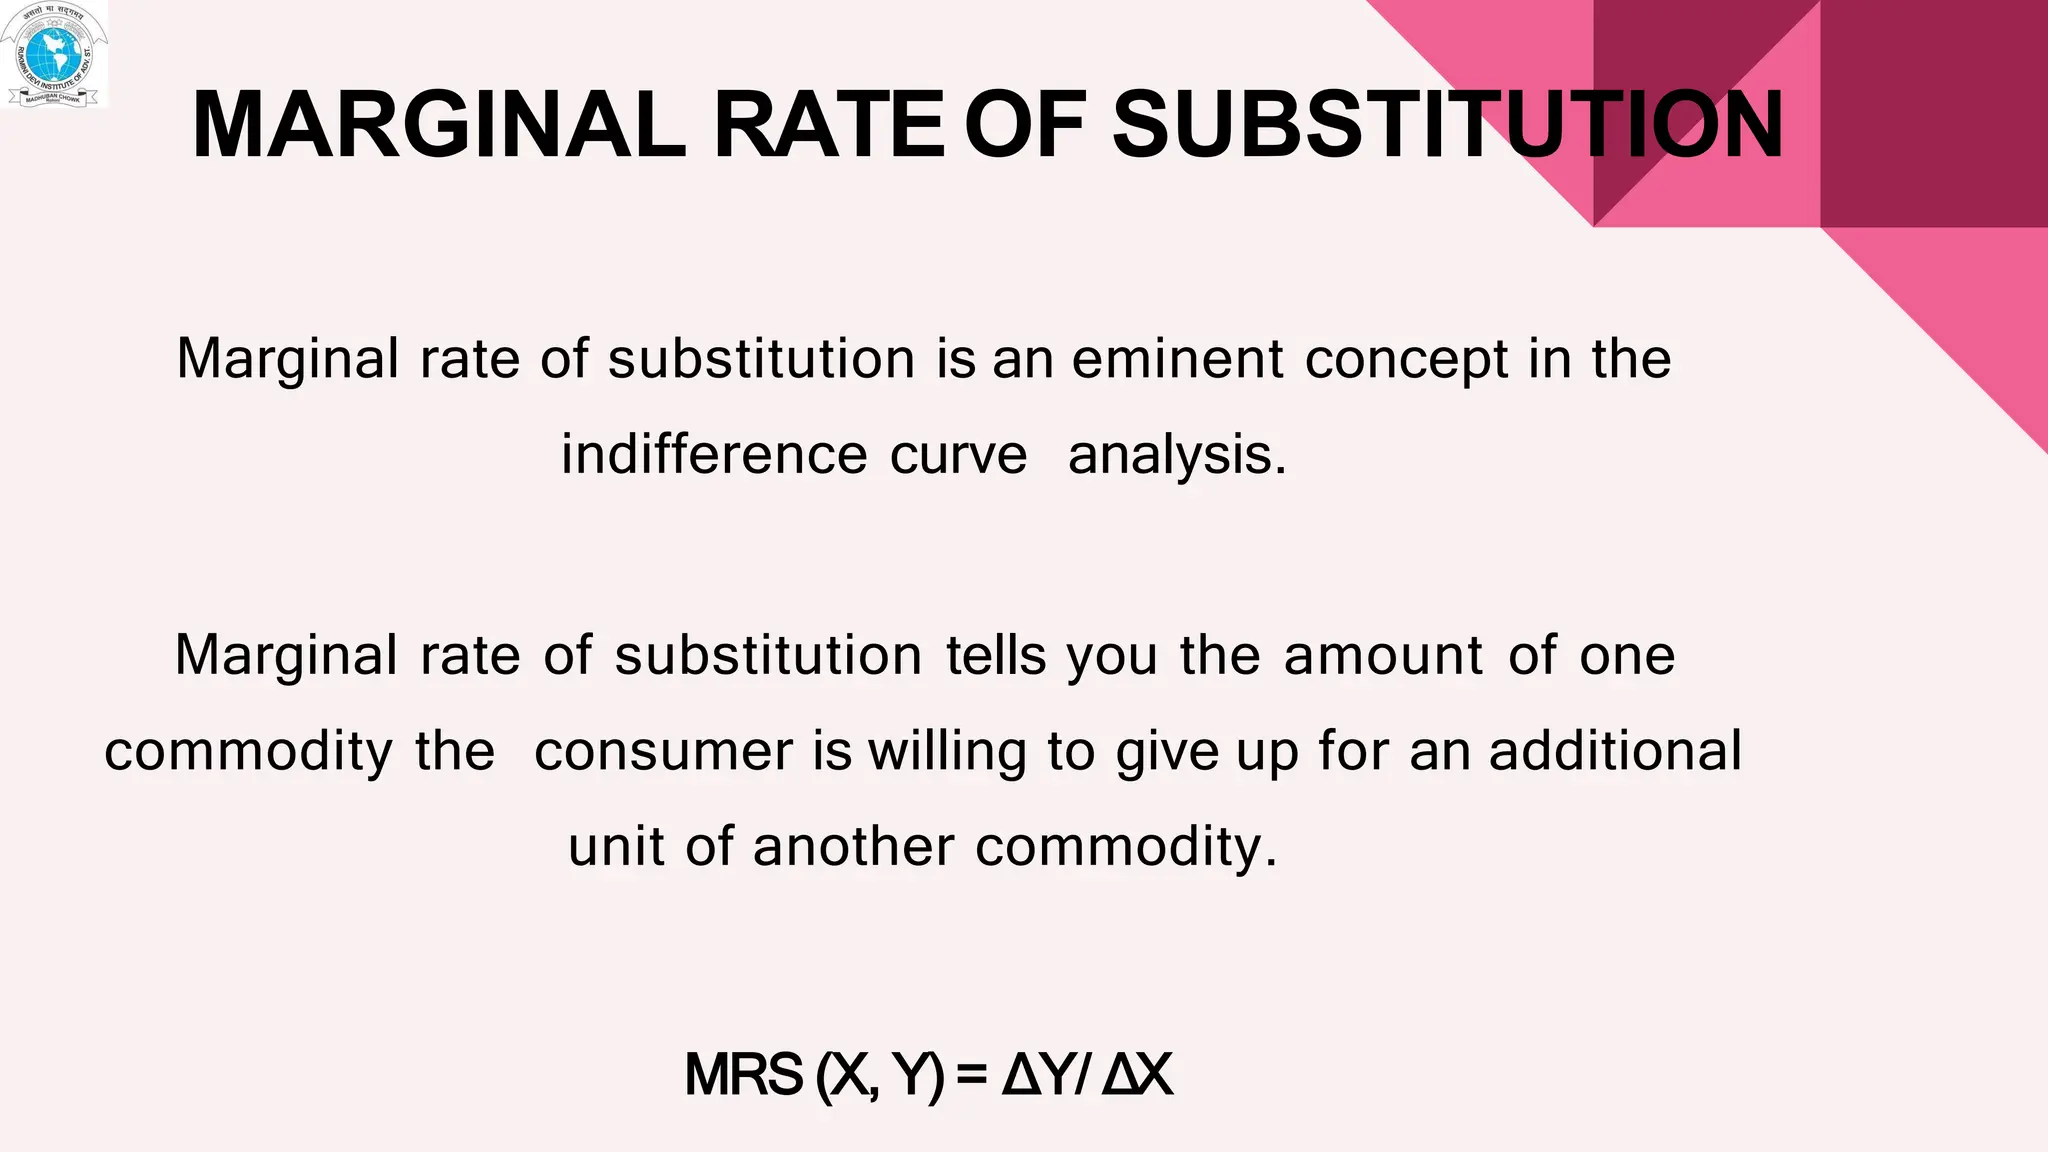
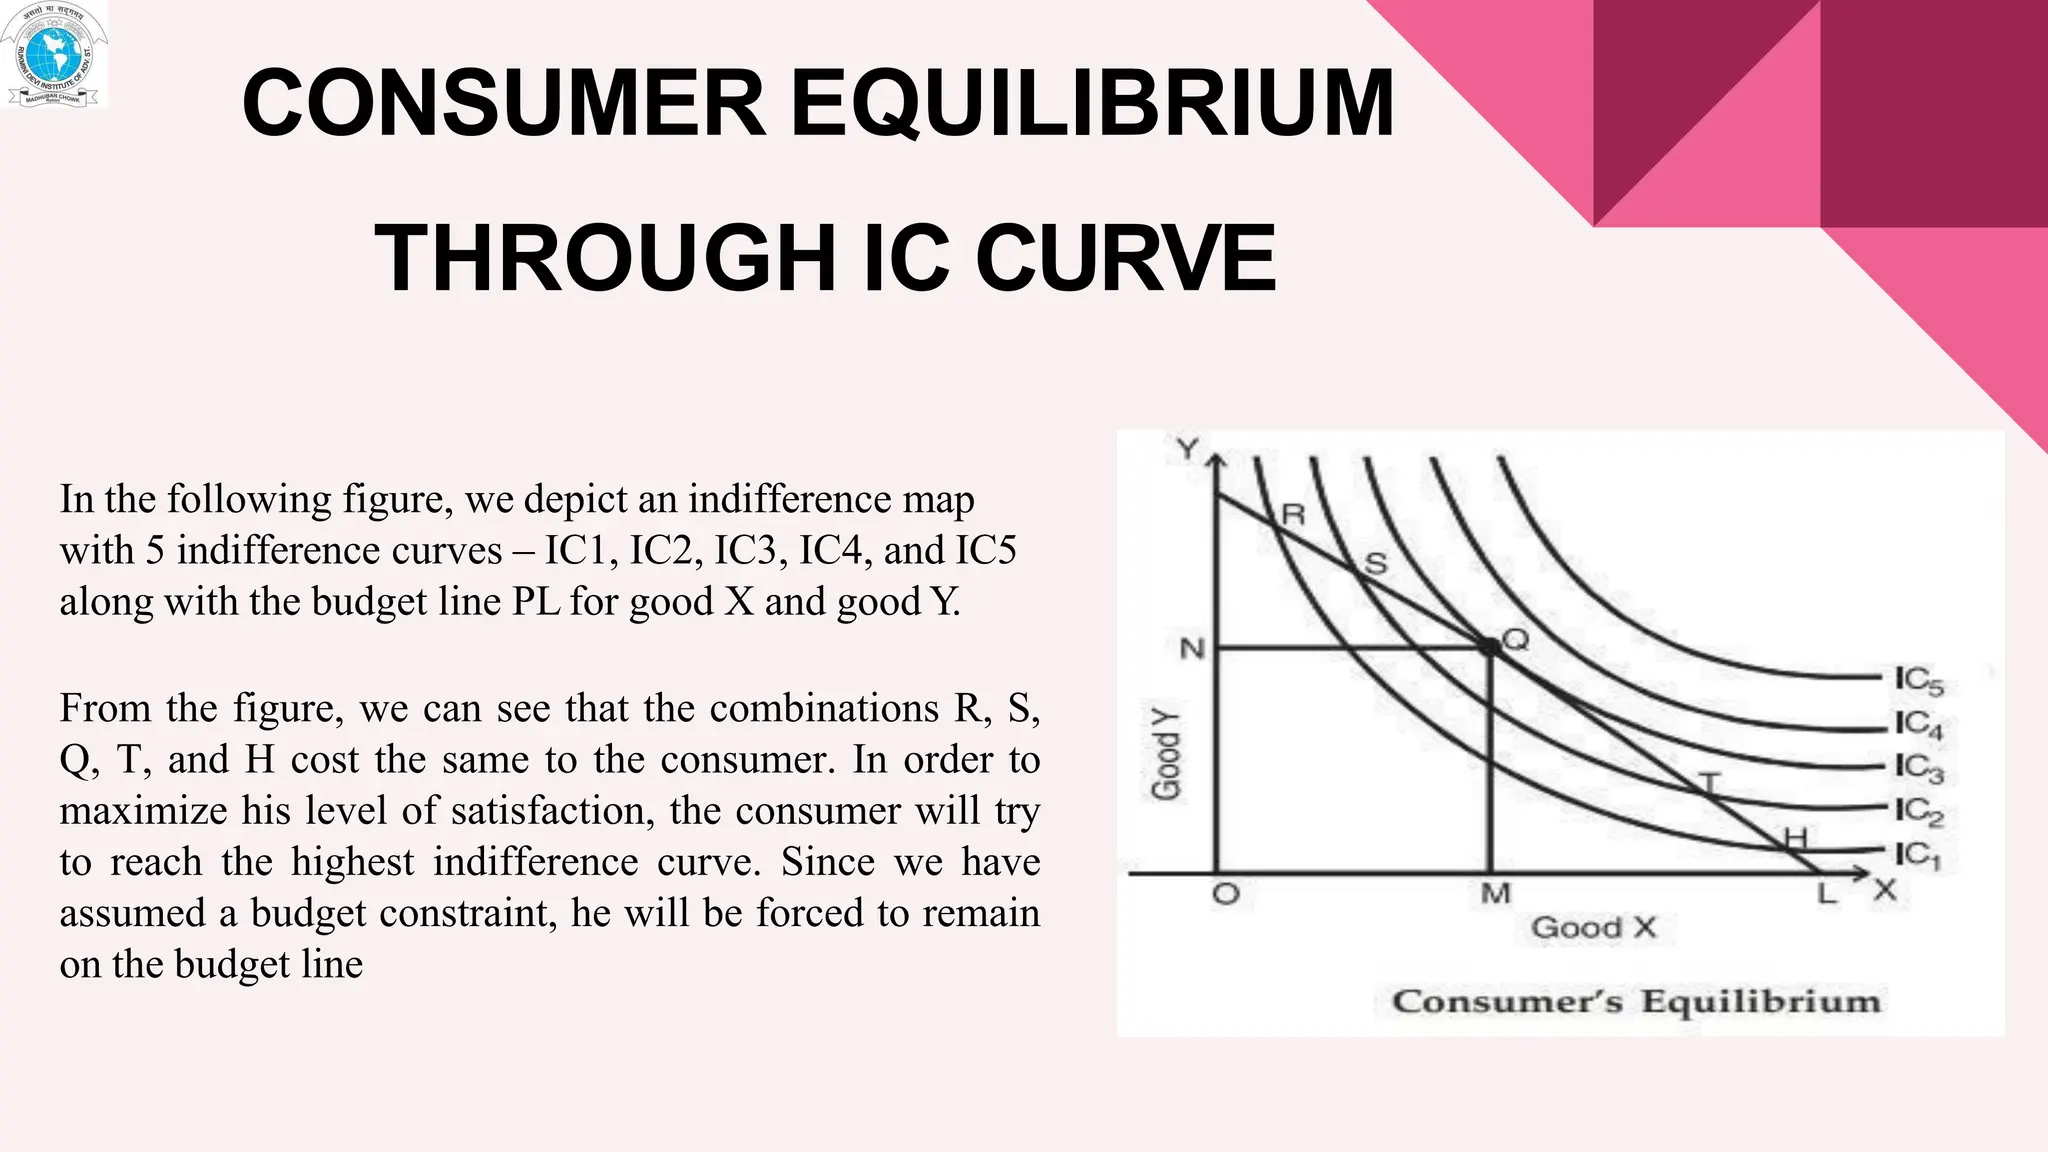
INDIFFERENCE
CURVE
Recapitalization
● Cardinal utility approach
● ordinal utility approach
INDIFFERENCE CURVE
S.NO Learning outcome CO PO KL
1. Students will be able to understand the concept of
indifference curve and budget line and how
consumer’s equilibrium is attained through it
CO2 PO1 K4
INDIFFERENCE CURVE
It is a graphical representation of the Indifference
Schedule.
Based on Ordinal Approach to consumer
behaviour
INDIFFERENCE SCHEDULE
INDIFFERENCE CURVE
• NON- SATIETY
More is better
• TRANSITIVITY
• DIMINISHING
MARGINAL RATE
OF SUBSTITUTION
• TWO COMMODITIES
• ORDINAL UTILITY
• RATIONALITY
ASSUMPTIONS
PROPERTIESOF IC
• IC slopes downwards from left to right
• IC curves are convex to the origin
• IC never intersect each other
• Higher IC represents higher level of satisfaction
Following are the features of indifference curve
(a) INDIFFERENCE CURVE ALWAYS SLOPES
DOWNWARDS FROM LEFT TO RIGHT
•An indifference curve has a negative slope, i.e. it
slopes downward from left to right.(monotonic
preferences)
•Reason: If a consumer decides to have one more
unit of a commodity
(say apples), quantity of another good (say oranges)
must fall so that the total satisfaction (utility)
remains same.
(a) INDIFFERENCE CURVE IS ALWAYS CONVEX TO
THE ORIGIN
•IC is strictly Convex to origin i.e. MRSxy is always
diminishing
•Reason: Due to the marginal rate of substitution a
consumer is always willing to sacrifice lesser units of
a commodity for every additional unit of another
good.
(c) HIGHER INDIFFERENCE CURVE REPRESENTS
HIGHER LEVEL OF SATISFACTION
•Higher indifference curve represents larger bundles
of goods i.e. bundles which contain more of both or
more of at least one.
•It is assumed that consumer’s preferences are
monotonic i.e. he always prefers larger bundle as it
gives him higher satisfaction.
MARGINAL RATE OF SUBSTITUTION
Marginal rate of substitution is an eminent concept in the
indifference curve analysis.
Marginal rate of substitution tells you the amount of one
commodity the consumer is willing to give up for an additional
unit of another commodity.
MRS (X, Y) = ∆Y/ ∆X
Hence, the marginal rate of substitution of X for Y (MRS x,y) is
the maximum
amount of Ythe consumer is willing to give up for an additional unit
of X.
However, the consumer remains on the same indifference curve.
In other words, the marginal rate of substitution explains the trade-
off between two goods.
IS MARGINAL RATE OF SUBSTITUTION
INCREASING OR DIMINISHING?
The MRS is diminishing.
A consumer is willing to sacrifice less and less units
of one commodity (say X) in order to consume one
additional unit of another commodity (say Y).
This is why Indifference Curve is Convex to the
Origin.
TABULAR REPRESENTATION OF MARGINAL
RATE OF SUBSTITUTION
GRAPHICAL PRSENTATION OF MARGINAL
RATE OF SUBSTITUION
BUDGET LINE
The budget line, also known as the budget constraint, exhibits all the combinations of two
commodities that a customer can manage to afford at the provided market prices and within the
particular earning degree.
The budget line is a graphical delineation of all possible combinations of the two commodities
that can be bought with provided income and cost so that the price of each of these
combinations is equivalent to the monetary earnings of the customer.
Equation : PXQX+PYQY<= M
Where,
The two basic elements of a budget line are as follows:
The consumer’s purchasing power (his/her income)
The market value of both the products
Px is the cost of product X.
Qx is the quantity of product X.
Py is the cost of product Y.
Qy is the quantity of product Y.
M is the consumer’s income.
Assumptions of a Budget Line
The budget line is mostly based on the assumption and not reality. However, to
get clear and precise results and summary, the economist considers the
following points in terms of a budget line:
Two commodities: The economist assumes that the customers spend their
income to purchase only two products.
Income of the customers: The income of the customer is limited, and it is
designated to buy only two products.
Market price: The cost of each commodity is known to the customer.
Expense is similar to income: It is assumed that the customer spends and
consumes the whole income
BUDGET LINE SCHEDULE
BUDGET LINE CURVE
A shift in Budget Line
A budget line includes a consumer’s earnings and the rate of a commodity.
These are the two important factors that shift the budget line.
Shift due to change in price: The amount of the product either increases or
decreases from time to time. For instance, if the price and income of product
A remains constant and the price of product B decreases, then the buying
potential of product B automatically increases. Similarly, if the price of B
increases and the other factors remain steady, the demand for product B
automatically decreases.
Shift due to change in income: Change in income makes a huge difference
that leads to a change in the budget line. High income means high
purchasing possibility and low income means low purchasing potential,
making the budget line to shift.
CONSUMER EQUILIBRIUM THROUGH
IC CURVE
INTRODUCTION OF CONSUMER EQUILIBRIUM
Consumer's equilibrium refers to a situation when a consumer
maximises his satisfaction, spending his given income across
different goods and services.
In terms of IC analysis, a consumer attains equilibrium when:
(i) IC and the budget line are tangent to each other, i.e. when
the slope of IC equals the price ratio of the goods.
(ii) IC is convex to the origin, at the point of equilibrium.
In the following figure, we depict an indifference map
with 5 indifference curves – IC1, IC2, IC3, IC4, and IC5
along with the budget line PL for good X and good Y.
From the figure, we can see that the combinations R, S,
Q, T, and H cost the same to the consumer. In order to
maximize his level of satisfaction, the consumer will try
to reach the highest indifference curve. Since we have
assumed a budget constraint, he will be forced to remain
on the budget line
CONSUMER EQUILIBRIUM
THROUGH IC CURVE
ASSUMPTIONS OF CONSUMERS EQUILIBRIUM
• There is a defined indifference map showing the consumer’s scale of preferences across
different combinations of two goods X and Y
.
• The consumer has a fixed money income and wants to spend it completely on the goods X and
Y
.
• The prices of the goods X and Y are fixed for the consumer.
• The goods are homogeneous and divisible.
• The consumer acts rationally and maximizes his satisfaction.
• In order to display the combination of two goods X and Y, that the consumer buys to be in
equilibrium, let’s bring his indifference curves and budget line together.
KEY LEARINGS
• concept of Indifference curve
•Assumptions od indifference curve
• concept of Marginal rate of substitution o
MRS (X, Y) = ∆Y/ ∆X
•Consumer Equilibrium is attained through IC, when it satisfies the
•D.N. Dwivedi, D.N. (2018). Essentials of Business
Economics, Vikas Publishing House.
•Chaturvedi D.D. (2018). Essentials of Business
Economics, Scholar Technical Press, New Delhi.
•“Business Economics”Microeconomic Analysis -Dr.H L
Ahuja,revised edition 2019, S. Chand Publishing.
References
:

2.2 Indiffernce curvenalysis updated.pdf

  • 1.
  • 2.
    Recapitalization ● Cardinal utilityapproach ● ordinal utility approach
  • 3.
    INDIFFERENCE CURVE S.NO Learningoutcome CO PO KL 1. Students will be able to understand the concept of indifference curve and budget line and how consumer’s equilibrium is attained through it CO2 PO1 K4
  • 4.
    INDIFFERENCE CURVE It isa graphical representation of the Indifference Schedule. Based on Ordinal Approach to consumer behaviour
  • 5.
  • 6.
  • 7.
    • NON- SATIETY Moreis better • TRANSITIVITY • DIMINISHING MARGINAL RATE OF SUBSTITUTION • TWO COMMODITIES • ORDINAL UTILITY • RATIONALITY ASSUMPTIONS
  • 8.
    PROPERTIESOF IC • ICslopes downwards from left to right • IC curves are convex to the origin • IC never intersect each other • Higher IC represents higher level of satisfaction
  • 9.
    Following are thefeatures of indifference curve (a) INDIFFERENCE CURVE ALWAYS SLOPES DOWNWARDS FROM LEFT TO RIGHT •An indifference curve has a negative slope, i.e. it slopes downward from left to right.(monotonic preferences) •Reason: If a consumer decides to have one more unit of a commodity (say apples), quantity of another good (say oranges) must fall so that the total satisfaction (utility) remains same. (a) INDIFFERENCE CURVE IS ALWAYS CONVEX TO THE ORIGIN •IC is strictly Convex to origin i.e. MRSxy is always diminishing •Reason: Due to the marginal rate of substitution a consumer is always willing to sacrifice lesser units of a commodity for every additional unit of another good. (c) HIGHER INDIFFERENCE CURVE REPRESENTS HIGHER LEVEL OF SATISFACTION •Higher indifference curve represents larger bundles of goods i.e. bundles which contain more of both or more of at least one. •It is assumed that consumer’s preferences are monotonic i.e. he always prefers larger bundle as it gives him higher satisfaction.
  • 10.
    MARGINAL RATE OFSUBSTITUTION Marginal rate of substitution is an eminent concept in the indifference curve analysis. Marginal rate of substitution tells you the amount of one commodity the consumer is willing to give up for an additional unit of another commodity. MRS (X, Y) = ∆Y/ ∆X
  • 11.
    Hence, the marginalrate of substitution of X for Y (MRS x,y) is the maximum amount of Ythe consumer is willing to give up for an additional unit of X. However, the consumer remains on the same indifference curve. In other words, the marginal rate of substitution explains the trade- off between two goods.
  • 12.
    IS MARGINAL RATEOF SUBSTITUTION INCREASING OR DIMINISHING? The MRS is diminishing. A consumer is willing to sacrifice less and less units of one commodity (say X) in order to consume one additional unit of another commodity (say Y). This is why Indifference Curve is Convex to the Origin.
  • 13.
    TABULAR REPRESENTATION OFMARGINAL RATE OF SUBSTITUTION
  • 14.
    GRAPHICAL PRSENTATION OFMARGINAL RATE OF SUBSTITUION
  • 15.
    BUDGET LINE The budgetline, also known as the budget constraint, exhibits all the combinations of two commodities that a customer can manage to afford at the provided market prices and within the particular earning degree. The budget line is a graphical delineation of all possible combinations of the two commodities that can be bought with provided income and cost so that the price of each of these combinations is equivalent to the monetary earnings of the customer. Equation : PXQX+PYQY<= M Where, The two basic elements of a budget line are as follows: The consumer’s purchasing power (his/her income) The market value of both the products Px is the cost of product X. Qx is the quantity of product X. Py is the cost of product Y. Qy is the quantity of product Y. M is the consumer’s income.
  • 16.
    Assumptions of aBudget Line The budget line is mostly based on the assumption and not reality. However, to get clear and precise results and summary, the economist considers the following points in terms of a budget line: Two commodities: The economist assumes that the customers spend their income to purchase only two products. Income of the customers: The income of the customer is limited, and it is designated to buy only two products. Market price: The cost of each commodity is known to the customer. Expense is similar to income: It is assumed that the customer spends and consumes the whole income
  • 17.
  • 18.
  • 19.
    A shift inBudget Line A budget line includes a consumer’s earnings and the rate of a commodity. These are the two important factors that shift the budget line. Shift due to change in price: The amount of the product either increases or decreases from time to time. For instance, if the price and income of product A remains constant and the price of product B decreases, then the buying potential of product B automatically increases. Similarly, if the price of B increases and the other factors remain steady, the demand for product B automatically decreases. Shift due to change in income: Change in income makes a huge difference that leads to a change in the budget line. High income means high purchasing possibility and low income means low purchasing potential, making the budget line to shift.
  • 20.
  • 21.
    INTRODUCTION OF CONSUMEREQUILIBRIUM Consumer's equilibrium refers to a situation when a consumer maximises his satisfaction, spending his given income across different goods and services. In terms of IC analysis, a consumer attains equilibrium when: (i) IC and the budget line are tangent to each other, i.e. when the slope of IC equals the price ratio of the goods. (ii) IC is convex to the origin, at the point of equilibrium.
  • 22.
    In the followingfigure, we depict an indifference map with 5 indifference curves – IC1, IC2, IC3, IC4, and IC5 along with the budget line PL for good X and good Y. From the figure, we can see that the combinations R, S, Q, T, and H cost the same to the consumer. In order to maximize his level of satisfaction, the consumer will try to reach the highest indifference curve. Since we have assumed a budget constraint, he will be forced to remain on the budget line CONSUMER EQUILIBRIUM THROUGH IC CURVE
  • 23.
    ASSUMPTIONS OF CONSUMERSEQUILIBRIUM • There is a defined indifference map showing the consumer’s scale of preferences across different combinations of two goods X and Y . • The consumer has a fixed money income and wants to spend it completely on the goods X and Y . • The prices of the goods X and Y are fixed for the consumer. • The goods are homogeneous and divisible. • The consumer acts rationally and maximizes his satisfaction. • In order to display the combination of two goods X and Y, that the consumer buys to be in equilibrium, let’s bring his indifference curves and budget line together.
  • 24.
    KEY LEARINGS • conceptof Indifference curve •Assumptions od indifference curve • concept of Marginal rate of substitution o MRS (X, Y) = ∆Y/ ∆X •Consumer Equilibrium is attained through IC, when it satisfies the
  • 25.
    •D.N. Dwivedi, D.N.(2018). Essentials of Business Economics, Vikas Publishing House. •Chaturvedi D.D. (2018). Essentials of Business Economics, Scholar Technical Press, New Delhi. •“Business Economics”Microeconomic Analysis -Dr.H L Ahuja,revised edition 2019, S. Chand Publishing. References :