Download to read offline


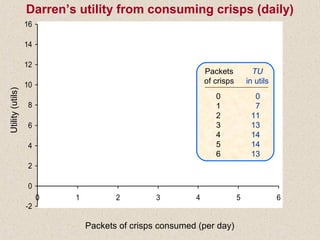
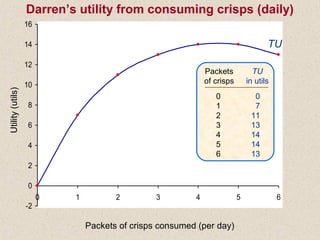
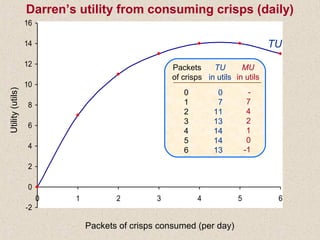
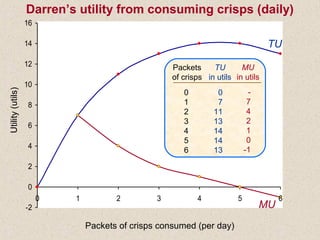
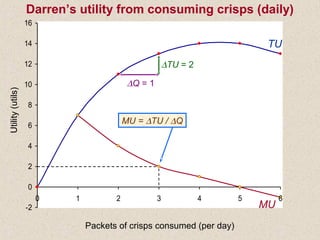
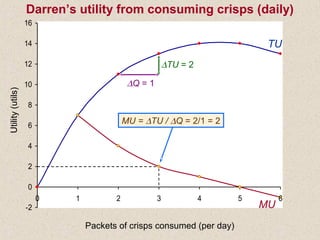
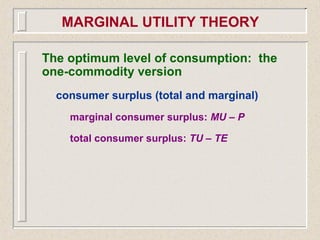
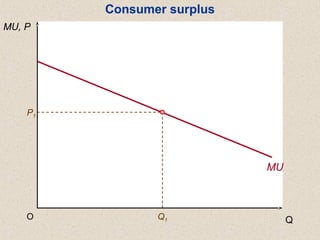
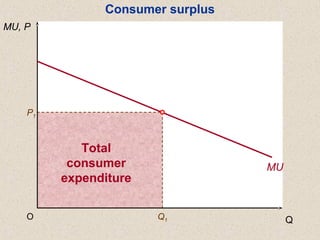
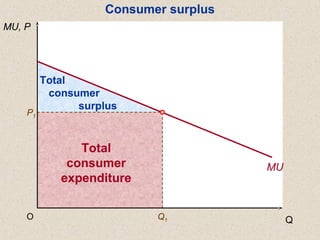
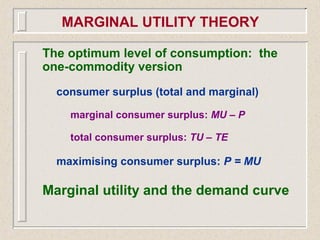
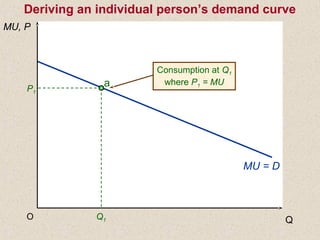
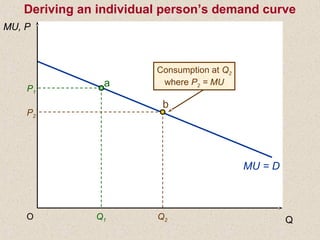
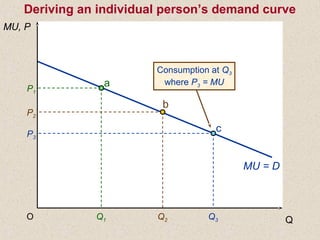


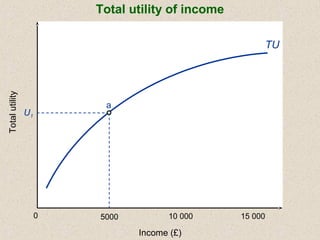
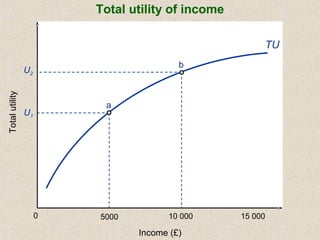
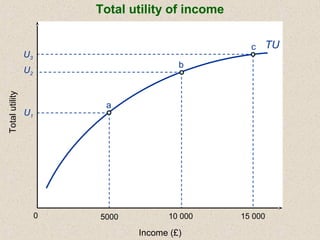
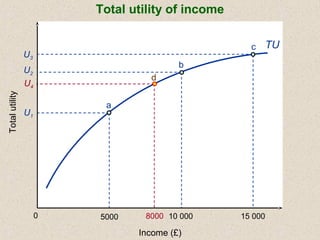

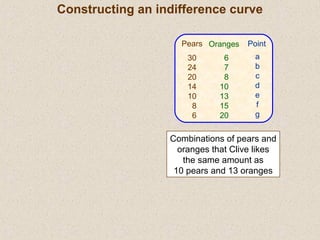
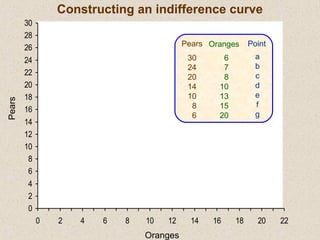
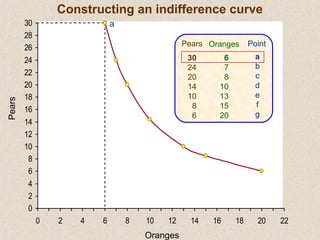

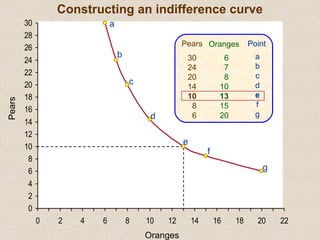
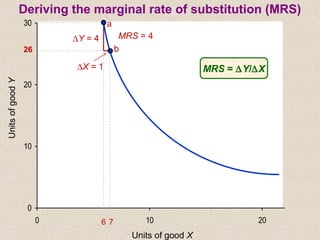
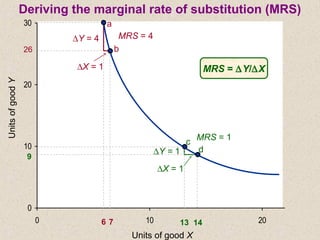
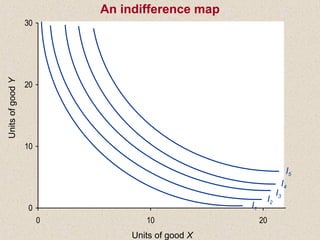
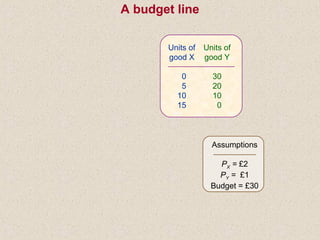
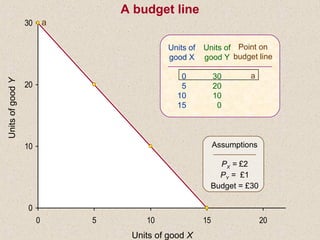
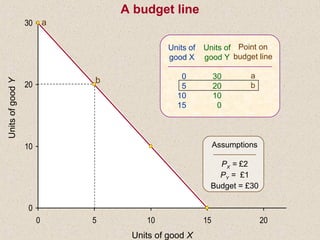
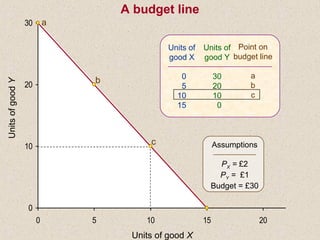
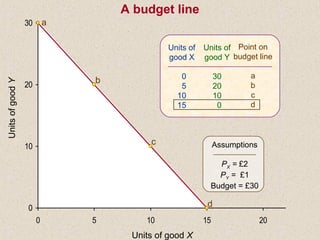
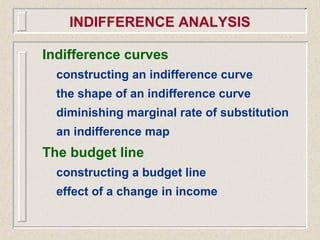
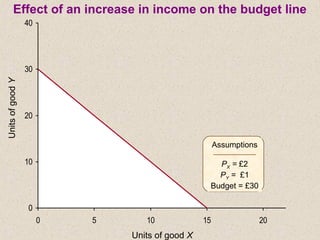
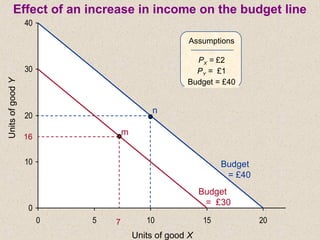
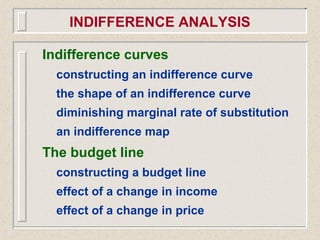
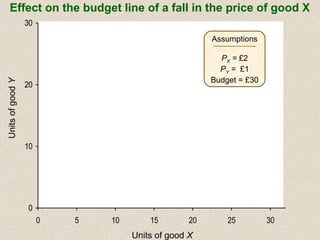
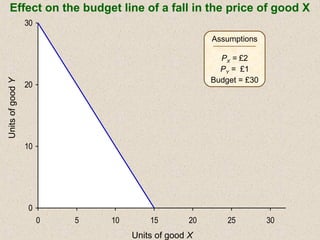
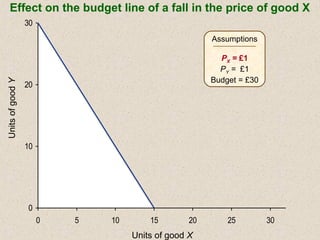
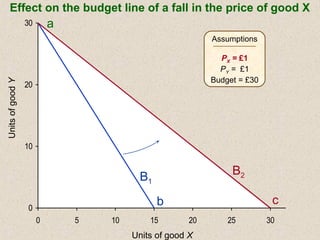
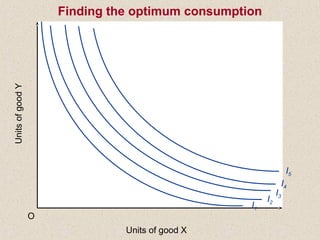
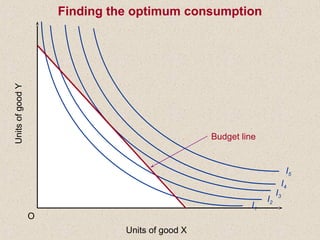
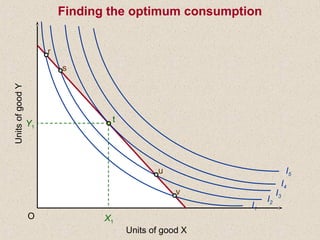

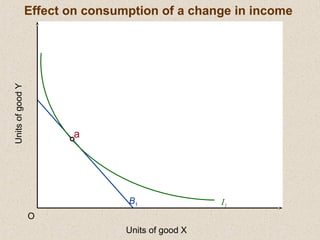
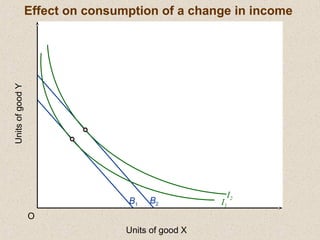
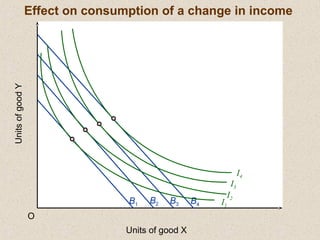
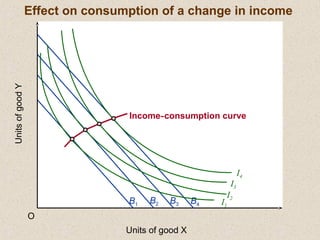
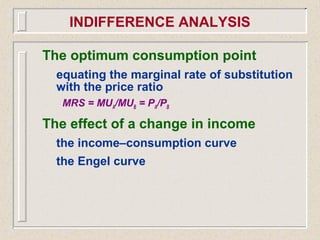
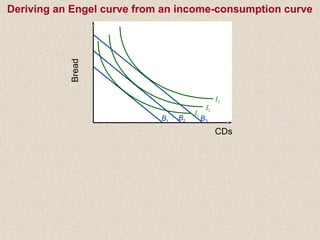
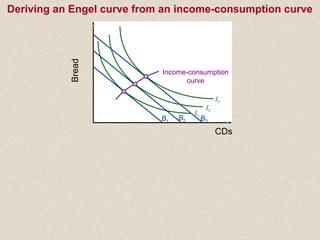
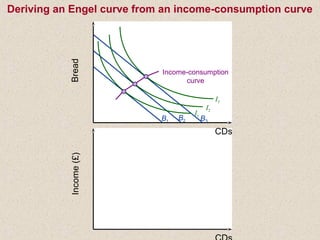
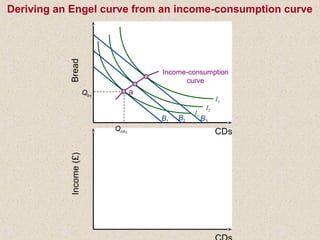
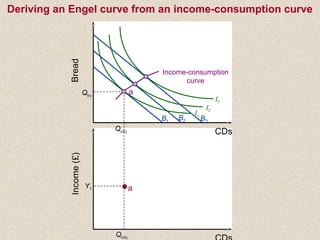
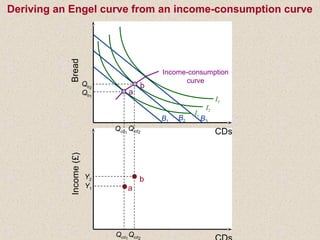
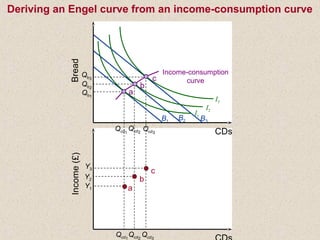

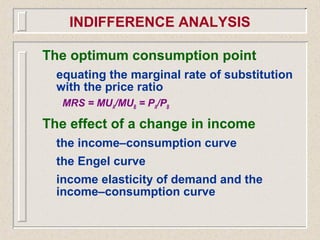
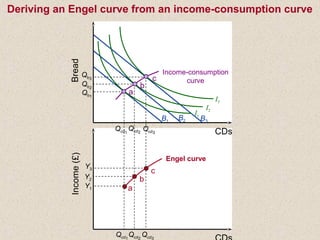
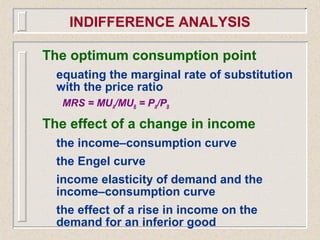
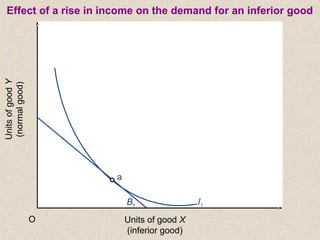
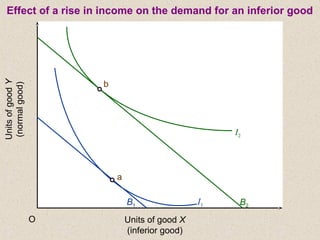
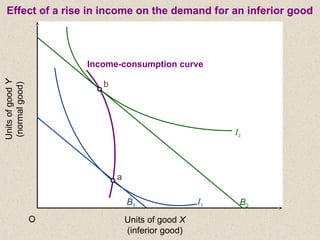
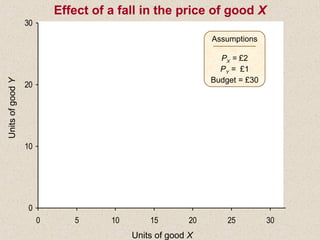

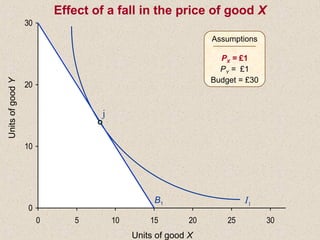
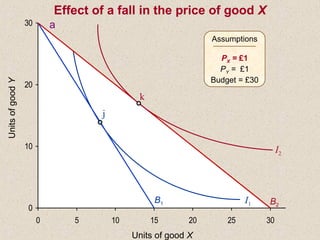
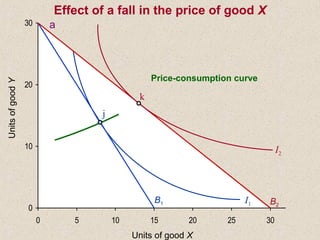
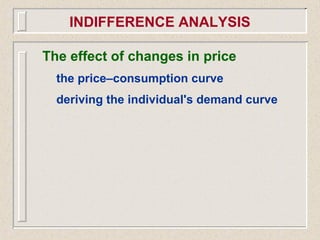
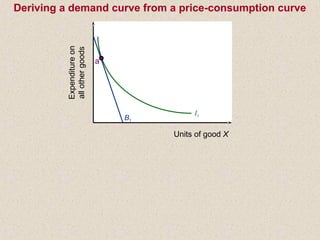
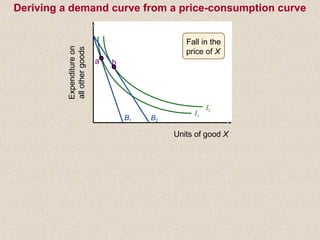
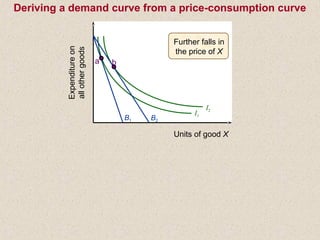
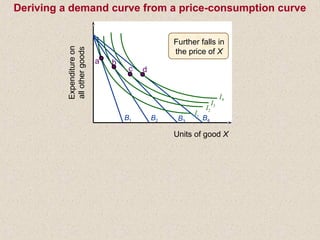
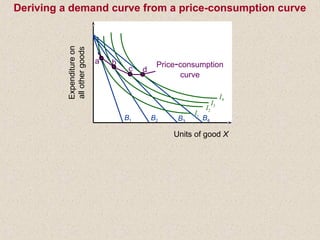
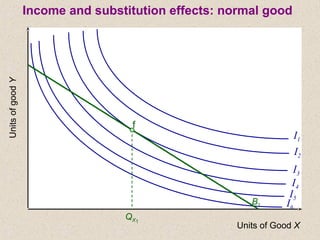
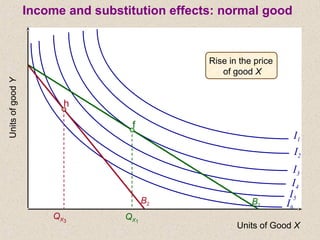
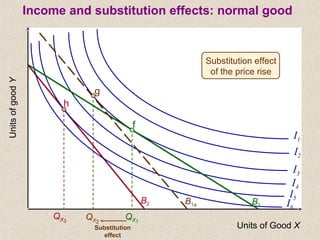
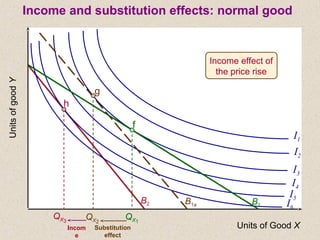
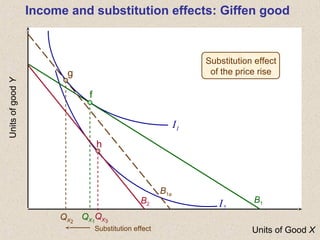
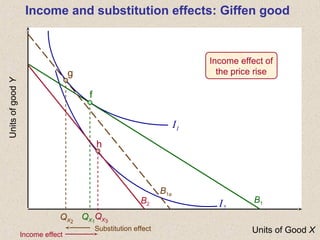

The document discusses marginal utility theory and indifference curves. It explains how total utility and marginal utility curves can be derived from an individual's consumption of a good. Indifference curves illustrate combinations of goods that provide equal utility. Budget constraints depend on income and prices. The optimal consumption point occurs where the marginal rate of substitution equals the price ratio, allowing maximum utility given constraints. Higher income shifts the budget line out, permitting greater consumption.


