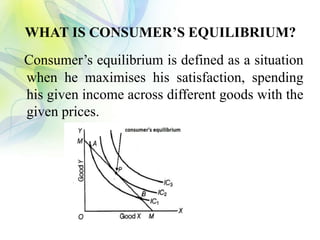
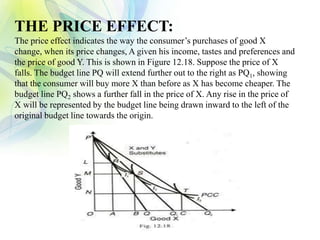
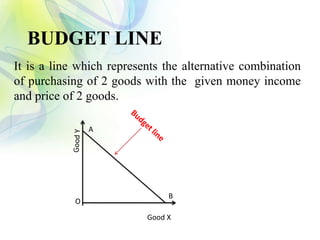
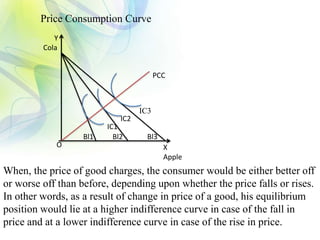
This document provides an overview of indifference curve analysis for consumer equilibrium. It discusses key concepts such as indifference curves, their properties, assumptions of indifference curve analysis, indifference maps, budget lines, price and income effects, derivation of demand curves, isoquants, iso-cost curves, short-run and long-run costs. The document contains definitions and explanations of these microeconomics concepts as well as examples and diagrams to illustrate them. It is intended as a reference for understanding consumer choice theory and producer theory using indifference curve and isoquant analysis.
A PowerPoint Presentation about Indifference Curve of Economics. Everyone should know about Indifference Curve. So watch it, download it and make your own from it.
In Macroeconomics Income and Employment are interchangeable terms, since in the short-run National income depends on the total volume of employment or economic activity in the country. As income and employment are synonymous the employment theory is also called income theory.
It should be clear to readers that the classical economists did not formulate any specific theory of employment as such. They only laid down certain postulates which subsequently developed as a theory.
An indifference curve shows combinations of goods and services between which a consumer is indifferent
In other words, each combination on an indifference curve gives the consumer the same total satisfaction
An indifference curve is normally drawn as convex to the origin
This reflects the assumption of the law of diminishing marginal satisfaction / marginal utility
I.e. as we consume extra units of something, the extra utility falls, total utility rises at a diminishing rate
Combinations of products on an indifference curve further from the origin are assumed to give greater total utility
This is part of an introduction to indifference curve analysis. A budget line shows the combinations of two products that a consumer can afford to buy with a given income – using all of their available budget
The gradient of the budget line reflects the relative prices of the two products
Macro Economics
For downloading this contact- bikashkumar.bk100@gmail.com
Prepared by Students of University of Rajshahi
Arif Hossain
Md.Abdul Aual
Risul Islam
Abul Kalam
MD Rasel Mollah
MD Rabiul Islam
Demand
Law of demand
Utility
Law of Diminishing marginal utility
Movement and shift of demand curve
Elasticity of demand
Price elasticity of demand
Uses of price elasticity
Consumer behavior is the study of individuals, groups, or organizations and all the activities associated with the purchase, use and disposal of goods and services. Consumer behaviour consists of how the consumer's emotions, attitudes, and preferences affect buying behaviour.
Introduction to AI for Nonprofits with Tapp NetworkTechSoup
Dive into the world of AI! Experts Jon Hill and Tareq Monaur will guide you through AI's role in enhancing nonprofit websites and basic marketing strategies, making it easy to understand and apply.
2024.06.01 Introducing a competency framework for languag learning materials ...Sandy Millin
http://sandymillin.wordpress.com/iateflwebinar2024
Published classroom materials form the basis of syllabuses, drive teacher professional development, and have a potentially huge influence on learners, teachers and education systems. All teachers also create their own materials, whether a few sentences on a blackboard, a highly-structured fully-realised online course, or anything in between. Despite this, the knowledge and skills needed to create effective language learning materials are rarely part of teacher training, and are mostly learnt by trial and error.
Knowledge and skills frameworks, generally called competency frameworks, for ELT teachers, trainers and managers have existed for a few years now. However, until I created one for my MA dissertation, there wasn’t one drawing together what we need to know and do to be able to effectively produce language learning materials.
This webinar will introduce you to my framework, highlighting the key competencies I identified from my research. It will also show how anybody involved in language teaching (any language, not just English!), teacher training, managing schools or developing language learning materials can benefit from using the framework.
Palestine last event orientationfvgnh .pptxRaedMohamed3
An EFL lesson about the current events in Palestine. It is intended to be for intermediate students who wish to increase their listening skills through a short lesson in power point.
Francesca Gottschalk - How can education support child empowerment.pptxEduSkills OECD
Francesca Gottschalk from the OECD’s Centre for Educational Research and Innovation presents at the Ask an Expert Webinar: How can education support child empowerment?
A Strategic Approach: GenAI in EducationPeter Windle
Artificial Intelligence (AI) technologies such as Generative AI, Image Generators and Large Language Models have had a dramatic impact on teaching, learning and assessment over the past 18 months. The most immediate threat AI posed was to Academic Integrity with Higher Education Institutes (HEIs) focusing their efforts on combating the use of GenAI in assessment. Guidelines were developed for staff and students, policies put in place too. Innovative educators have forged paths in the use of Generative AI for teaching, learning and assessments leading to pockets of transformation springing up across HEIs, often with little or no top-down guidance, support or direction.
This Gasta posits a strategic approach to integrating AI into HEIs to prepare staff, students and the curriculum for an evolving world and workplace. We will highlight the advantages of working with these technologies beyond the realm of teaching, learning and assessment by considering prompt engineering skills, industry impact, curriculum changes, and the need for staff upskilling. In contrast, not engaging strategically with Generative AI poses risks, including falling behind peers, missed opportunities and failing to ensure our graduates remain employable. The rapid evolution of AI technologies necessitates a proactive and strategic approach if we are to remain relevant.
Operation “Blue Star” is the only event in the history of Independent India where the state went into war with its own people. Even after about 40 years it is not clear if it was culmination of states anger over people of the region, a political game of power or start of dictatorial chapter in the democratic setup.
The people of Punjab felt alienated from main stream due to denial of their just demands during a long democratic struggle since independence. As it happen all over the word, it led to militant struggle with great loss of lives of military, police and civilian personnel. Killing of Indira Gandhi and massacre of innocent Sikhs in Delhi and other India cities was also associated with this movement.
Acetabularia Information For Class 9 .docxvaibhavrinwa19
Acetabularia acetabulum is a single-celled green alga that in its vegetative state is morphologically differentiated into a basal rhizoid and an axially elongated stalk, which bears whorls of branching hairs. The single diploid nucleus resides in the rhizoid.
How to Make a Field invisible in Odoo 17Celine George
It is possible to hide or invisible some fields in odoo. Commonly using “invisible” attribute in the field definition to invisible the fields. This slide will show how to make a field invisible in odoo 17.
June 3, 2024 Anti-Semitism Letter Sent to MIT President Kornbluth and MIT Cor...Levi Shapiro
Letter from the Congress of the United States regarding Anti-Semitism sent June 3rd to MIT President Sally Kornbluth, MIT Corp Chair, Mark Gorenberg
Dear Dr. Kornbluth and Mr. Gorenberg,
The US House of Representatives is deeply concerned by ongoing and pervasive acts of antisemitic
harassment and intimidation at the Massachusetts Institute of Technology (MIT). Failing to act decisively to ensure a safe learning environment for all students would be a grave dereliction of your responsibilities as President of MIT and Chair of the MIT Corporation.
This Congress will not stand idly by and allow an environment hostile to Jewish students to persist. The House believes that your institution is in violation of Title VI of the Civil Rights Act, and the inability or
unwillingness to rectify this violation through action requires accountability.
Postsecondary education is a unique opportunity for students to learn and have their ideas and beliefs challenged. However, universities receiving hundreds of millions of federal funds annually have denied
students that opportunity and have been hijacked to become venues for the promotion of terrorism, antisemitic harassment and intimidation, unlawful encampments, and in some cases, assaults and riots.
The House of Representatives will not countenance the use of federal funds to indoctrinate students into hateful, antisemitic, anti-American supporters of terrorism. Investigations into campus antisemitism by the Committee on Education and the Workforce and the Committee on Ways and Means have been expanded into a Congress-wide probe across all relevant jurisdictions to address this national crisis. The undersigned Committees will conduct oversight into the use of federal funds at MIT and its learning environment under authorities granted to each Committee.
• The Committee on Education and the Workforce has been investigating your institution since December 7, 2023. The Committee has broad jurisdiction over postsecondary education, including its compliance with Title VI of the Civil Rights Act, campus safety concerns over disruptions to the learning environment, and the awarding of federal student aid under the Higher Education Act.
• The Committee on Oversight and Accountability is investigating the sources of funding and other support flowing to groups espousing pro-Hamas propaganda and engaged in antisemitic harassment and intimidation of students. The Committee on Oversight and Accountability is the principal oversight committee of the US House of Representatives and has broad authority to investigate “any matter” at “any time” under House Rule X.
• The Committee on Ways and Means has been investigating several universities since November 15, 2023, when the Committee held a hearing entitled From Ivory Towers to Dark Corners: Investigating the Nexus Between Antisemitism, Tax-Exempt Universities, and Terror Financing. The Committee followed the hearing with letters to those institutions on January 10, 202
June 3, 2024 Anti-Semitism Letter Sent to MIT President Kornbluth and MIT Cor...
indifference curve
1. INDIFFERENCE CURVE
ANALYSIS
Department of Business
ManagementDr. Hari Singh Gour Central University Sagar
Presented by:-
MayankKesharwani (y17282016)
Pankaj Singh (y17282019)
Roshni Aathiya (y17282027)
Shilpi Rajak (y17282031)
UNDERTHEGUIDENCEOF: dr. BABITAYADAV
2. Table of Contents
S. NO. CONTENT SLIDE NO.
1 WHAT IS CONSUMER’S EQUILIBRIUM 4
2 INDIFFERENCE CURVE 5-6
3 ASSUMPTIONS OF IC ANALYSIS OF CONSUMER’S EQUILIBRIUM 7
4 PROPERTIES OF INDIFFERENCE CURVES 8-13
5 INDIFFERENCE MAP 14
6 INCOME EFFECT 15
7 SUBSTITUTION EFFECT 16
8 PRICE EFFECT 17
9 BUDGET LINE 18
10 PRICE CONSUMPTION CURVE 19-20
3. 13 INCOME CONSUMPTION CURVE 21-22
14 DERIVATION OF THE DEMAND CURVE 23-25
15 ISO-QUANT , ISO -COST CURVE & ITS ASSUMPTIONS 26-30
16 COST ANALYSIS, COST FUNCTIONS, VARIOUS TYPE OF COST
ANALYSIS
31-33
17 SHORT RUN AND LONG RUN CONCEPTS 34-35
18 REFERENCES 36
4. WHAT IS CONSUMER’S EQUILIBRIUM?
Consumer’s equilibrium is defined as a situation
when he maximises his satisfaction, spending
his given income across different goods with the
given prices.
5. INDIFFERENCE CURVE
An Indifference curve is a curve which represents all
those combinations of goods which gives same level of
satisfaction to the consumers.
Consider table 1,showing different combinations of
apples and oranges.
For Example:-
7. ASSUMPTIONS OF IC ANALYSIS OF
CONSUMER’S EQUILIBRIUM
1. Prices of goods are constant.
2. Money income of the consumer is given and does not
change.
3. The consumer spends his income on two goods which are
substitutes of each other.
4. More of a good always gives more satisfaction to the
consumer. This is called monotonic preference for a
good.
5. Perfect competition in the market.
6. The consumer is rational. He always tries to maximise
his satisfaction in given situation.
8. PROPERTIES OF INDIFFERENCE
CURVES:-
1.) INDIFFERENCE CURVE SLOPES DOWNWARDS:-
IC slops downward from left to right. It means that IC has a
negative slope. It implies that if the consumer decides to have
more of one good, he must have less of the other.
9. 2.) INDIFFERENCE CURVE IS CONVEX TO THE ORIGIN:-
Indifference curve is convex to the origin because Marginal
Rate of Substitution (MRS) Tends to decline.
MRS refers to the rate at which the consumer is willing to
sacrifice Good–Y for Good-X .
For example:-
As a consumer has more and more units of food, he is
prepared to forego less and less units of clothing. This
happens mainly because what for a particular good is
satiable and as a person has more and more of a good ,his
intensity of want for that good goes on diminishing. This
diminishing marginal rate of substitution gives convex shape
to the IC.
11. 3.) HIGHER INDIFFERENCE CURVE REPRESENT A
HIGHER LEVEL OF SATISFACTION :-
This is because combinations lying on a higher IC contain
more of either one or both goods and more goods are
preferred to less of them.
12. 4.) INDIFFERENCE CURVE CAN NEVER INTERSECT
EACH OTHER:-
No two IC will intersect each other because higher and
lower level are cannot be equal to each other.
Point A and B (on IC1)offer
the same level of
satisfaction.
Point A and C (on IC2)offer
the same level of
satisfaction.
IF A=B, and A=C, it implies
that B=C. This is wrong as C
is offering more of GOOD-1
13. 5.) INDIFFERENCE CURVE DOES NOT TOUCH X-AXIS
OR Y-AXIS:-
This is because IC analysis considers the consumption of
two goods.
Touching Y-Axis , IC would mean
zero consumption of Good-X
Touching X-Axis , IC would mean
zero consumption of Good-Y
14. INDIFFERENCE MAP
Indifference map refers to a set of indifference curve.
Higher IC shows
higher level of
satisfaction . It
corresponds to higher
level of income of the
consumer.
15. INCOME EFFECT:-
In the above analysis of the consumer’s equilibrium it was
assumed that the income of the consumer remains constant,
given the prices of the goods X and Y. Given the tastes and
preferences of the consumer and the prices of the two goods, if
the income of the consumer changes, the effect it will have on
his purchases is known as the income Effect.
16. THE SUBSTITUTION EFFECT:
The substitution effect relates to the change in the quantity demanded
resulting from a change in the price of good due to the substitution of
relatively cheaper good for a dearer one, while keeping the price of the other
good and real income and tastes of the consumer as constant. Prof. Hicks has
explained the substitution effect independent of the income effect through
compensating variation in income. “The substitution effect is the increase in
the quantity bought as the price of the commodity falls, after adjusting income
so as to keep the real purchasing power of the consumer the same as before.
This adjustment in income is called compensating variations and is shown
graphically by a parallel shift of the new budget line until it become tangent to
the initial indifference curve.”
17. THE PRICE EFFECT:
The price effect indicates the way the consumer’s purchases of good X
change, when its price changes, A given his income, tastes and preferences and
the price of good Y. This is shown in Figure 12.18. Suppose the price of X
falls. The budget line PQ will extend further out to the right as PQ1, showing
that the consumer will buy more X than before as X has become cheaper. The
budget line PQ2 shows a further fall in the price of X. Any rise in the price of
X will be represented by the budget line being drawn inward to the left of the
original budget line towards the origin.
18. BUDGET LINE
It is a line which represents the alternative combination
of purchasing of 2 goods with the given money income
and price of 2 goods.
Good X
A
B
O
19. • Shows how consumption is affected by price changes
(movement along demand curve).
•The consumer reacts to charges in the price of a good, his
money income, tastes and prices of other goods remaining
the same. Price effect shows this reaction of the consumer
and measures the full effect of the change in the price of a
good on the quantity purchased
PRICE CONSUMPTION CURVE
20. Price Consumption Curve
Y
Cola
X
Apple
Bl1 Bl2 Bl3
PCC
O
When, the price of good charges, the consumer would be either better off
or worse off than before, depending upon whether the price falls or rises.
In other words, as a result of change in price of a good, his equilibrium
position would lie at a higher indifference curve in case of the fall in
price and at a lower indifference curve in case of the rise in price.
IC3
IC2
IC1
21. •It Shows how consumption is affected by income
changes (shifts from one demand curve to another).
•In indifference curve map income consumption curve is
the locus of the equilibrium quantities consumed by an
individual at different levels of his income.
Thus, the income consumption curve (ICC) can be used
to derive the relationship between the level of
consumer’s income and the quantity purchased of a
commodity by him.
INCOME CONSUMPTION CURVE
22. With given prices and a given money income as indicated by the budget
line P1L1 the consumer is initially in equilibrium at point Q1 on the
indifference curve IC1 and is having OM1 of X and ON1 of Y. Now
suppose that income of the consumer increases. With his increased
income, he would be able to purchase larger quantities of both the goods.
23. DERIVATION OF THE DEMAND
CURVE
A demand curve has been defined as a curve that
shows a relationship between the quantity-demanded
of a commodity and its price assuming income, the
tastes and preferences of the consumer and the prices
of all other goods constant. To draw an individual
demand curve the information regarding prices of a
commodity at different levels and their corresponding
quantities demanded is required. The price-
consumption curve can provide this information.
24. With the above information, we draw up the following
demand schedule of the consumers.
25. Suppose a consumer has an income of Rs.240. If the price of the commodity X
is Rs.60 per unit, the relevant price line will be LM1, because at this 2 units can
be purchased. The consumer is in equilibrium at point el where the consumer
buys 2 units of the commodity.
Suppose the price of X falls to Rs.40 per unit. The price line shifts to LM2. The
consumer attains a new equilibrium point e2 and buys 3 units of X. As the price
of X further falls, the budget line shifts to the right and new successive points of
equilibrium are attained where the consumer is in equilibrium at e3 and e4 and
buys 5 and 7 units of commodity X when the price is Rs.30 and Rs.24 per unit
respectively.
26. ISO-QUANT
• Isoquant is also called as equal product curve or production
indifference curve or constant product curve. Isoquant indicates
various combinations of two factors of production which give the
same level of output per unit of time. The significance of factors of
productive resources is that, any two factors are substitutable e.g.
labour is substitutable for capital and vice versa. No two factors are
perfect substitutes. This indicates that one factor can be used a little
more and other factor a little less, without changing the level of
output.
• It is a graphical representation of various combinations of inputs say
Labour(L) and capital (K) which give an equal level of output per
unit of time. Output produced by different combinations of L and K
is say, Q, then Q=f (L, K). Just as we demonstrate the MRSxy in
respect of indifference curves through hypothetical data, we
demonstrate the Marginal Rate of Technical Substitution of factor L
for K (MRTS L,K )
27. ASSUMPTIONS OF ISOQUANT
• There are two factor inputs labour and capital
• The proportions of factor are variable.
• Physical production conditions are given
• The Scale of operation is variable
• The state of technology remains constant
• The shape of Isoquant
28. • In this section we examine the characteristics of isoquants,
define the economic region of production and consider the
special cases where the commodities can only be produced
with least cost factor combination.
• We can see that the shape of isoquant plays an important a
role in the production theory as the shape of indifference
curve in the consumption theory. Iso quant map shows all
the possible combinations of labour and capital that can
produce different levels of output. The iso quant closer to
the origin indicates a lower level of output. The slope of iso
quant is indicated as
K/L=MRSLK=MPL/MPK
29. ISO -COST CURVE
• Isocost curve is the locus traced out by various combinations of L
and K, each of which costs the producer the same amount of money
(C ) Differentiating equation with respect to L, we have dK/dL = -
w/r This gives the slope of the producer’s budget line . Iso cost line
shows various combinations of labour and capital that the firm can
buy for a given factor prices. The slope of iso cost line = PL/Pk. In
this equation , PL is the price of labour and Pk is the price of capital.
The slope of iso cost line indicates the ratio of the factor prices. A set
of isocost lines can be drawn for different levels of factor prices, or
different sums of money. The iso cost line will shift to the right when
money spent on factors increases or firm could buy more as the
factor prices are given.
30. • With the change in the factor prices the slope of iso cost line will
change. If the price of labour falls the firm could buy more of
labour and the line will shift away from the origin. The slope
depends on the prices of factors of production and the amount of
money which the firm spends on the factors. When the amount
of money spent by the firm changes, the isocost line may shift
but its slope remains the same. A change in factor price makes
changes in the slope of isocost lines as shown in the figure.
•
31. COST ANALYSIS
• Cost is a sacrifice or foregoing that has occurred or has Cost is a sacrifice or
foregoing that has occurred or has potential to occur in future, measured in monetary
terms.
• Cost results in current or future decrease in cash or other assets, Cost results in
current or future decrease in cash or other assets, or a current or future increase in
liability.
• Cost is determined by various factors and each of this has Cost is determined by
various factors and each of this has significant implications for cost decisions.
• An increase in any of these will affect cost pattern.
• The most important determinant is price(/s) of factor(/s) of The most important
determinant is price(/s) of factor(/s) of production, which are uncontrollable, as they
are largely production, which are uncontrollable, as they are largely determined by
the external environment of any business.
• The marginal efficiency and productivity of these factors is The marginal efficiency
and productivity of these factors is strongly related to their cost, higher the
productivity or strongly related to their cost, higher the productivity or efficiency,
lower will be the cost of the production, other things efficiency, lower will be the
cost of the production, other things remaining the same.
32. COST FUNCTIONS
• They are derived from the production function, which describes the
availability efficient methods of production at any one time.
• Economic theory distinguishes between short-run costs and long-run
costs.
• Short-run costs are the costs over a period during which some factors
of production (usually capital equipment and management) are fixed.
• The long-run costs are the costs over a period long enough to permit
the change of all factors of production. In the long run all factors
become variable.
• Both in the short run and in the long run, total cost is a multivariable
function, that is, a total cost is determined by many factors.
• Symbolically we may write the long run cost function as C= f (X, T, Pf)
And the short – run cost function as C = f (X, T, Pf, K)
Where, C = total costs, X = output, T = technology, Pf = prices of
factors, and K = fixed factor
33. VARIOUS TYPE OF COST
ANALYSIS
• In economic analysis, the following types of costs are
considered in studying costs data of a firm:
• Total Cost (TC)
• Total Fixed Cost (TFC)
• Total Variable Cost (TVC)
• Average Fixed Cost (AFC)
• Average Variable Cost (AVC)
• Average Total Cost (ATC) and
• Marginal Cost (MC)
34. SHORT RUN AND LONG RUN
CONCEPTS
• The short run is a period during which one of the factors of
production is considered to be constant (assuming that there are only
two factors of production labor and capital) and the other is variable.
Usually it is assumed that capital is the fixed factor in the short run.
• All costs are variable in the long run since factors of production, size
of plant, machinery and technology are all variable. This in turn
implies radical changes in the cost structure of the firm. The long run
cost function is often referred to as the ‘planning cost function’ and
the long run average cost (LAC) curve is known as the ‘planning
curve’. As all cost are variable, only the average cost curve is
relevant to the firm’s decision-making process in the long run. The
long run consists of many short runs, e.g., a week consists of seven
days and a month consists of four weeks and so on. So, the long run
cost curve is the composite of many short run cost curves.
35. LONG RUN COST CURVES
• In the long run, all inputs (factors of production) are variable and
firms can enter or exit any industry or market. Consequently, a
firm's output and costs are unconstrained in the sense that the firm
can produce any output level it chooses by employing the needed
quantities of inputs (such as labor and capital) and incurring the
total costs of producing that output level.
• The Long Run Average Cost (LRAC) curve of a firm shows the
minimum or lowest average total cost at which a firm can produce
any given level of output in the long run (when all inputs are
variable).
• The LRAC curve is the envelope of the short run average total cost
(SRATC) curves, where each SRATC curve is defined by a specific
quantity of capital (or other fixed input).
36. CONCLUSION
The above analysis shows that the theory of consumer’s
behaviour is an extension of the theory of demand .The
cardinal school explains that price alone is not the
major determinant of quality demanded of a
commodity but the final degree of utility to be derived
from the commodity. The law diminishing marginal
utility draws our attention to the fact that marginal
utility decreases as more quantities of a commodity are
acquired by a consumer.
37. REFERENCES
JAIN, T., & OHRI, V. (2010). INDIFFERENCE CURVE ANALYSIS. AMBALA: V.K.
GOOGLE. (n.d.). Retrieved MARCH SUNDAY, 2018, from WWW.GOOGLE.COM:
https://www.google.co.in/search?q=INDIFFERENCE+CURVE+ANALYSIS&dcr=0&sourc
e=lnms&tbm=isch&sa=X&ved=0ahUKEwjr_Z7trPvZAhWI6Y8KHRtGBEAQ_AUIDSgE&b
iw=1366&bih=613
http://wikieducator.org/ISO_QUANT_AND_ISOCOST ISOQUANT
CURVE,ISOCOST
https://www.bing.com/search?FORM=INCOH2&PC=IC03&PTAG=ICO-
e05ce23b&q=iso%20cost%20curve