Downloaded 1,780 times
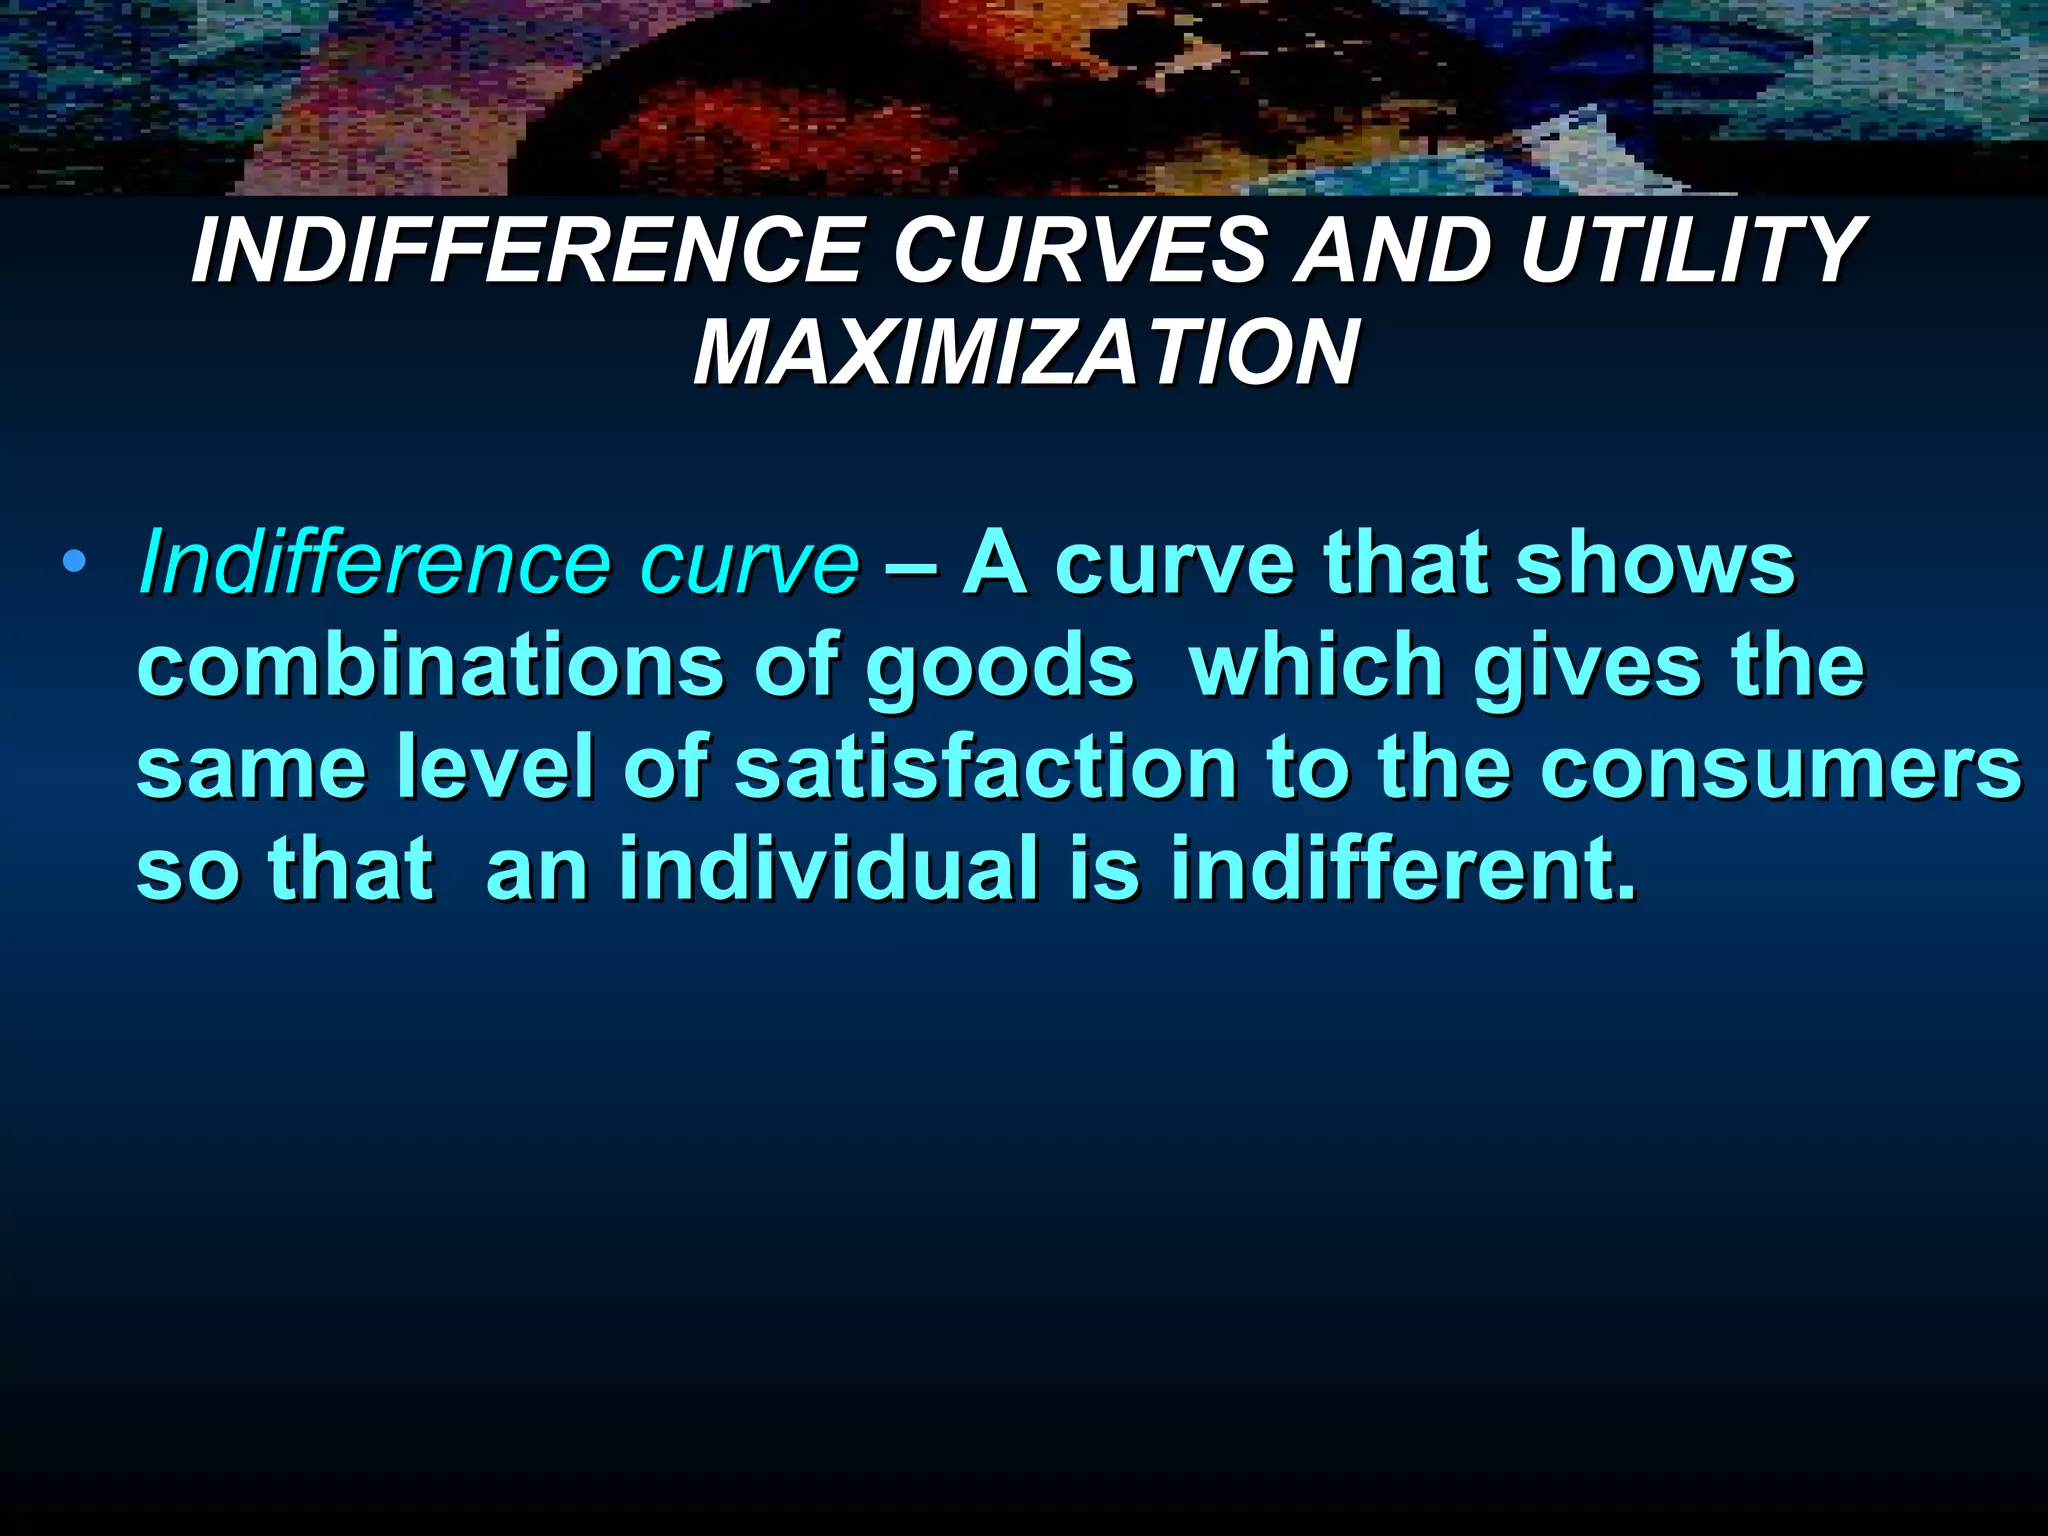
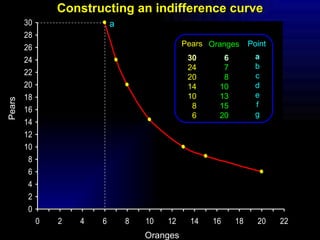
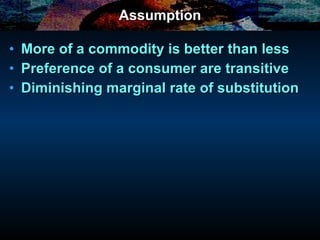
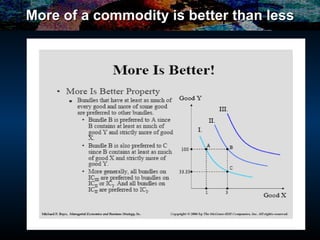
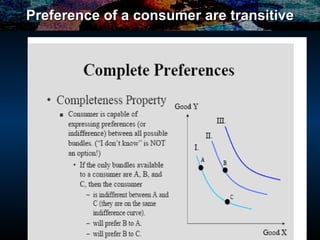
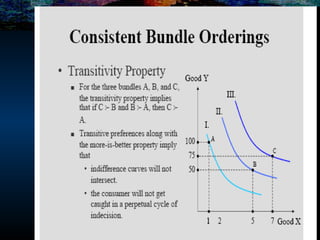
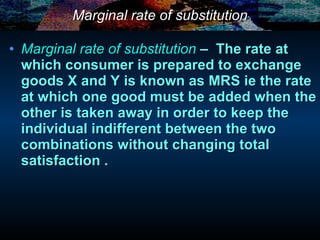
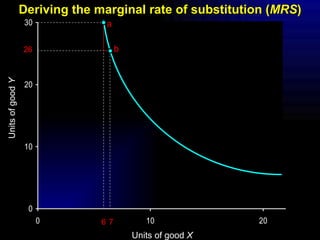
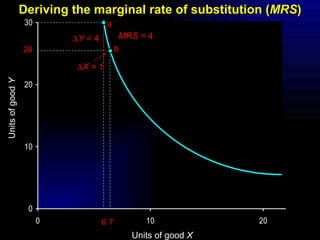
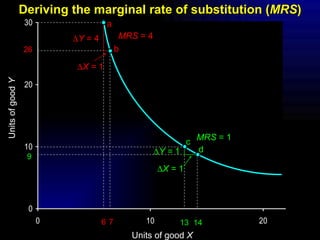
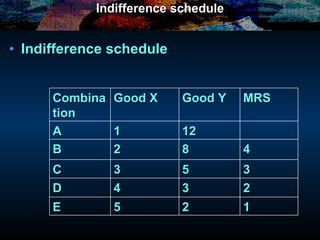
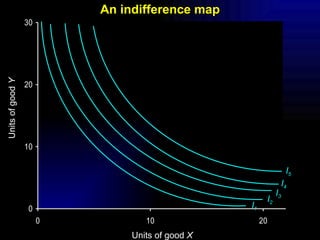
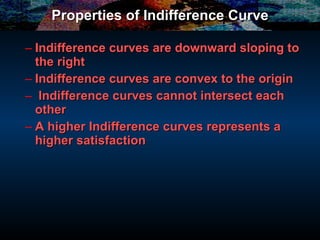

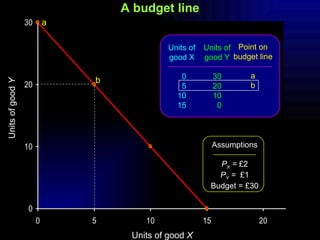
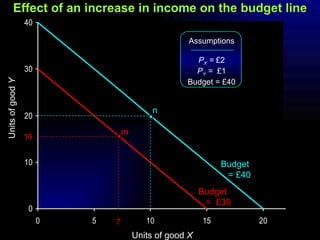
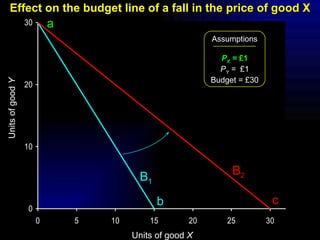


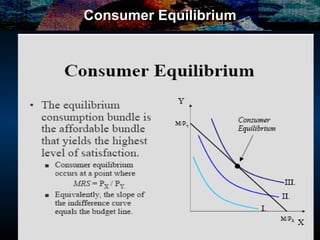

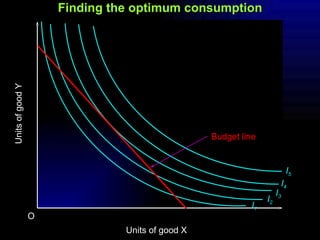
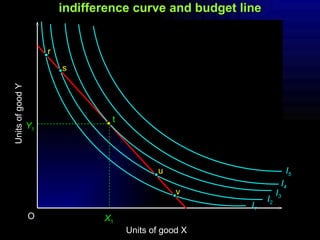
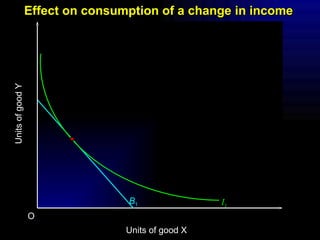
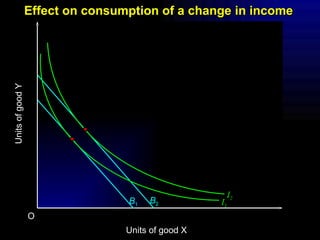
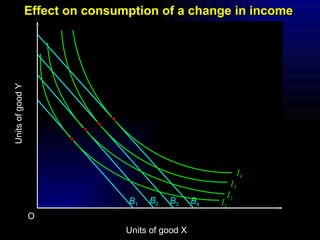
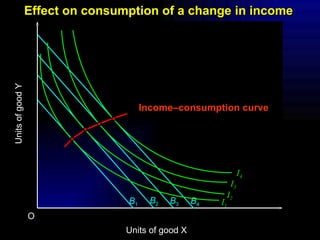


Indifference curves show combinations of goods that provide the same level of satisfaction to a consumer. A consumer seeks to maximize utility by consuming the combination on their highest attainable indifference curve, which is tangent to their budget constraint. As more of a good is consumed, the marginal rate of substitution diminishes, following the law of diminishing marginal rate of substitution. When prices or income change, the budget constraint shifts, changing the optimal consumption bundle where the indifference curve is tangent to the new budget line.


![indifference curve analysis [Autosaved].pptx](https://cdn.slidesharecdn.com/ss_thumbnails/indifferencecurveanalysisautosaved-230212040058-9caa8b7a-thumbnail.jpg?width=640&height=640&fit=bounds)


![[PERT-3] Consumer Behaviour.pdf](https://cdn.slidesharecdn.com/ss_thumbnails/pert-3consumerbehaviour-231017015937-da9d2839-thumbnail.jpg?width=640&height=640&fit=bounds)


