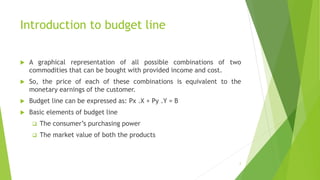
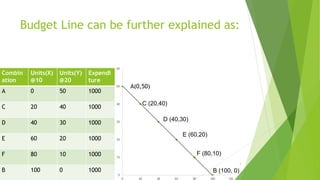
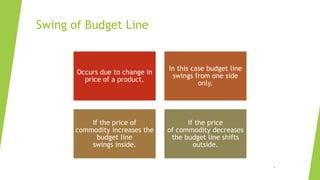
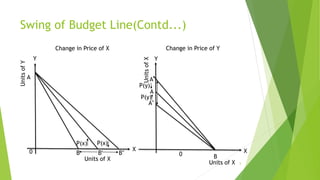
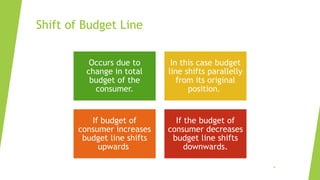
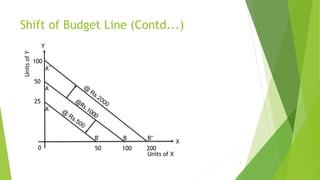
2. Introduction to budget line
A graphical representation of all possible combinations of two
commodities that can be bought with provided income and cost.
So, the price of each of these combinations is equivalent to the
monetary earnings of the customer.
Budget line can be expressed as: Px .X + Py .Y = B
Basic elements of budget line
The consumer’s purchasing power
The market value of both the products
2
3. Budget Line can be further explained as:
0
10
20
30
40
50
60
0 20 40 60 80 100 120
A(0,50)
C (20,40)
D (40,30)
E (60,20)
F (80,10)
B (100, 0)
3
Combin
ation
Units(X)
@10
Units(Y)
@20
Expendi
ture
A 0 50 1000
C 20 40 1000
D 40 30 1000
E 60 20 1000
F 80 10 1000
B 100 0 1000
4. Swing of Budget Line
4
Occurs due to change in
price of a product.
In this case budget line
swings from one side
only.
If the price of
commodity increases the
budget line
swings inside.
If the price
of commodity decreases
the budget line shifts
outside.
5. Swing of Budget Line(Contd...)
Change in Price of X
A
B B' B"
0 X
Y
Change in Price of Y
Y
X
B
A
A'
A"
0
P(x) P(x)
P(y)
P(y)
5
Units of X
Units of X
Units
of
Y
Units
of
X
6. Shift of Budget Line
6
Occurs due to
change in total
budget of the
consumer.
In this case budget
line shifts parallelly
from its original
position.
If budget of
consumer increases
budget line shifts
upwards
If the budget of
consumer decreases
budget line shifts
downwards.
7. Shift of Budget Line (Contd...)
7
0
X
Y
A"
A
A'
B' B B"
Units
of
Y
Units of X
25
50
100
50 100 200