This document discusses different thermodynamic property diagrams including:
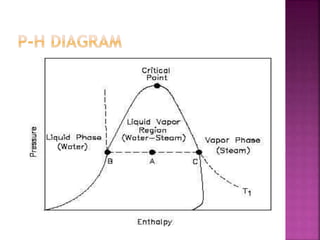
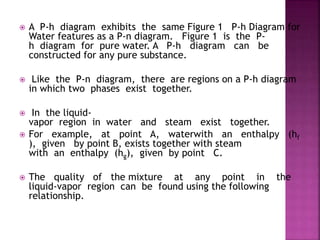
- P-h diagrams which show pressure vs enthalpy and can be used for any pure substance like water. Regions where two phases exist together are identified.
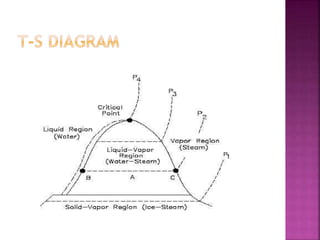
- T-s diagrams which are frequently used to analyze energy transfer systems by visualizing work and heat transfer. The heat transferred equals the area under the T-s curve.
- T-s diagrams can be made for any pure substance like water and show regions where liquid and vapor phases coexist.