應用:澳洲國稅局(1)
Australian TaxationOffice — Case Study
全澳洲共有 22,000 員工
Revenue Collection and Refund
Management
Compliance and Risk Modelling
12M Individuals, $450B Income, $100B
Tax
2M Companies..., $1800B Income, $40B
Tax
2005 年改用 R 軟體分析資料
23.
應用:澳洲國稅局(2)
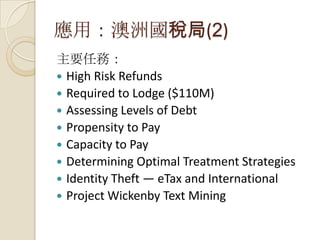
主要任務:
High RiskRefunds
Required to Lodge ($110M)
Assessing Levels of Debt
Propensity to Pay
Capacity to Pay
Determining Optimal Treatment Strategies
Identity Theft — eTax and International
Project Wickenby Text Mining
24.
R的應用:澳洲國稅局(3)
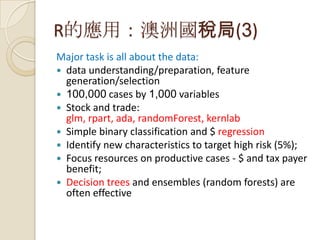
Major task isall about the data:
data understanding/preparation, feature
generation/selection
100,000 cases by 1,000 variables
Stock and trade:
glm, rpart, ada, randomForest, kernlab
Simple binary classification and $ regression
Identify new characteristics to target high risk (5%);
Focus resources on productive cases - $ and tax payer
benefit;
Decision trees and ensembles (random forests) are
often effective
德國 Fraunhofer 財經顧問公司(1)
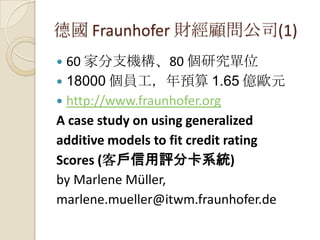
60 家分支機構、80 個研究單位
18000 個員工,年預算 1.65 億歐元
http://www.fraunhofer.org
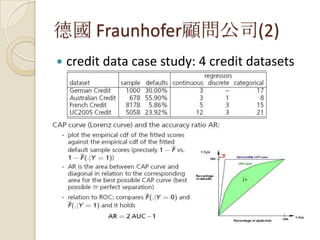
A case study on using generalized
additive models to fit credit rating
Scores (客戶信用評分卡系統)
by Marlene Müller,
marlene.mueller@itwm.fraunhofer.de
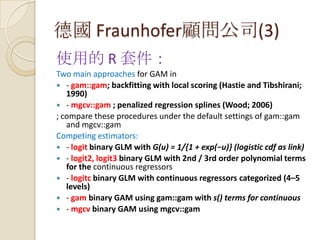
德國 Fraunhofer顧問公司(3)
使用的 R套件:
Two main approaches for GAM in
- gam::gam; backfitting with local scoring (Hastie and Tibshirani;
1990)
- mgcv::gam ; penalized regression splines (Wood; 2006)
; compare these procedures under the default settings of gam::gam
and mgcv::gam
Competing estimators:
- logit binary GLM with G(u) = 1/{1 + exp(−u)} (logistic cdf as link)
- logit2, logit3 binary GLM with 2nd / 3rd order polynomial terms
for the continuous regressors
- logitc binary GLM with continuous regressors categorized (4–5
levels)
- gam binary GAM using gam::gam with s() terms for continuous
- mgcv binary GAM using mgcv::gam


![活動議程(1)
Day 1
[1] 9:00-12:00
。R軟體快速簡介、常用程式技巧、與常用圖形函數
。常用的資料探勘技術簡介
。決策樹(Decision Trees) (1)
[2]13:30-16:30
。決策樹(Decision Trees) (2)
。類神經網路(Artifical Nueral Network) (1)
。類神經網路(Artifical Nueral Network) (2)](https://image.slidesharecdn.com/bigdata-20130521-130520204842-phpapp01/85/Big-data-20130521-2-320.jpg)
![活動議程(2)
Day 2
[3] 9:00-12:00
。SVM(Support Vetor Machine)與其他分類方法
。集群分析(Clustering Analysin)與其他多變量方
法
[4] 13:30-16:30
。關聯分析(Association Analysis)
。實例演練與分析
。綜合講解](https://image.slidesharecdn.com/bigdata-20130521-130520204842-phpapp01/85/Big-data-20130521-3-320.jpg)
![R軟體範例:迴歸分析
> ( IQ = round(rnorm(6,110,15)) ) # 隨機產生 6 個服從 N(110, 15) 的亂數,並四捨五入
[1] 118 121 107 108 87 131
> ( scores = 5 + 0.6*IQ + rnorm(6,0,2) ) # 分數 = 5 + 0.6 * IQ + 隨機誤差(N(0,2))
[1] 79.09683 77.53507 69.82176 69.17460 55.32896 84.49939
> summary( lm(scores ~ IQ) ) # 使用 lm( ) 函數作迴歸分析
Call:
lm(formula = scores ~ IQ)
Residuals:
1 2 3 4 5 6
2.4883 -1.0897 0.6060 -0.7132 -0.4453 -0.8461
Coefficients:
Estimate Std. Error t value Pr(>|t|)
(Intercept) -2.69628 5.05144 -0.534 0.621786
IQ 0.67207 0.04476 15.014 0.000115 ***
---
Signif. codes: 0 ‘***’ 0.001 ‘**’ 0.01 ‘*’ 0.05 ‘.’ 0.1 ‘ ’ 1
Residual standard error: 1.514 on 4 degrees of freedom
Multiple R-squared: 0.9826, Adjusted R-squared: 0.9782
F-statistic: 225.4 on 1 and 4 DF, p-value: 0.0001147](https://image.slidesharecdn.com/bigdata-20130521-130520204842-phpapp01/85/Big-data-20130521-12-320.jpg)
![R軟體範例:ANOVA
> scores
[1] 79.09683 77.53507 69.82176 69.17460 55.32896 84.49939
> gender
[1] "男" "男" "女" "女" "男" "女"
> gender = as.factor(gender) # 使用 as.factor( ) 函數轉為 factor 變數
> gender
[1] 男 男 女 女 男 女
Levels: 女 男
> anova(lm(scores ~ gender)) # 用 lm( ) 分析,再用 anova( ) 製作表格
Analysis of Variance Table
Response: scores
Df Sum Sq Mean Sq F value Pr(>F)
gender 1 22.18 22.176 0.1761 0.6963
Residuals 4 503.72 125.930](https://image.slidesharecdn.com/bigdata-20130521-130520204842-phpapp01/85/Big-data-20130521-13-320.jpg)


![[DSC 2016] 系列活動:許懷中 / R 語言資料探勘實務](https://cdn.slidesharecdn.com/ss_thumbnails/rdatamining-161030010840-thumbnail.jpg?width=640&height=640&fit=bounds)


![[系列活動] 手把手教你R語言資料分析實務](https://cdn.slidesharecdn.com/ss_thumbnails/stepbystepr20170114-170113030702-thumbnail.jpg?width=640&height=640&fit=bounds)
![[系列活動] 手把手打開Python資料分析大門](https://cdn.slidesharecdn.com/ss_thumbnails/python-171213042421-thumbnail.jpg?width=640&height=640&fit=bounds)


![[系列活動] Python 爬蟲實戰](https://cdn.slidesharecdn.com/ss_thumbnails/pythonafunjimv1-171213041823-thumbnail.jpg?width=640&height=640&fit=bounds)


![[系列活動] Python爬蟲實戰](https://cdn.slidesharecdn.com/ss_thumbnails/python-170809083644-thumbnail.jpg?width=640&height=640&fit=bounds)

![[系列活動] 機器學習速遊](https://cdn.slidesharecdn.com/ss_thumbnails/mltourhandout-170310083857-thumbnail.jpg?width=640&height=640&fit=bounds)


![[系列活動] Machine Learning 機器學習課程](https://cdn.slidesharecdn.com/ss_thumbnails/ml4ds02122017-170212005829-thumbnail.jpg?width=640&height=640&fit=bounds)
![[系列活動] 使用 R 語言建立自己的演算法交易事業](https://cdn.slidesharecdn.com/ss_thumbnails/rtradingbusiness-170115010649-thumbnail.jpg?width=640&height=640&fit=bounds)


![[系列活動] 給工程師的統計學及資料分析 123](https://cdn.slidesharecdn.com/ss_thumbnails/0114lckungtdsaprerequisite-170110090917-thumbnail.jpg?width=640&height=640&fit=bounds)


![[系列活動] 資料探勘速遊](https://cdn.slidesharecdn.com/ss_thumbnails/0114ycchendmquicktour-170110050658-thumbnail.jpg?width=640&height=640&fit=bounds)
![[系列活動] 資料探勘速遊 - Session4 case-studies](https://cdn.slidesharecdn.com/ss_thumbnails/session4-case-studies-170114072124-thumbnail.jpg?width=640&height=640&fit=bounds)

![[DSC 2016] 系列活動:吳牧恩、林佳緯 / 用 R 輕鬆做交易策略分析及自動下單](https://cdn.slidesharecdn.com/ss_thumbnails/tradingwithrcombine-160923053815-thumbnail.jpg?width=640&height=640&fit=bounds)


