GIS Research Center,Feng Chia University,Taiwan
Game or real project/system ?
Winner needs to control
construction project's
cumulative progress
from start to finish
Game by Microsoft - Age of Empires II
YES
We are playing real game.
Real Construction Project Management System
2. Find good partners
1. construction projects
need to be done on time
How to win?
7.
GIS Research Center,Feng Chia University,Taiwan
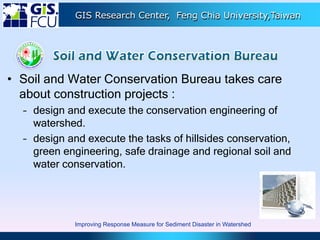
• Soil and Water Conservation Bureau takes care
about construction projects :
– design and execute the conservation engineering of
watershed.
– design and execute the tasks of hillsides conservation,
green engineering, safe drainage and regional soil and
water conservation.
Improving Response Measure for Sediment Disaster in Watershed
8.
GIS Research Center,Feng Chia University,Taiwan
Question from big data in existed system?
• Not big, but about 32,000 historical data.
• How to know the reasonable curve
forecast in each project?
• How to find good partners to finish
construction projects on time?
9.
GIS Research Center,Feng Chia University,Taiwan
Question from big data in existed system?
• How to know the reasonable curve
forecast in each project?
• How to find good partners to finish
construction projects on time?
GIS Research Center,Feng Chia University,Taiwan
Apply back
propagation neural
network
to build model
Input new data into
the trained model
Find the forecasted
S and P
Check definition table
Classify
four categories
How to build
prediction model?
How to predict the
progress of new
coming
engineering case?
How to classify
Engineering Case?
How to analyze every
project’s S-curve
characteristics?
Apply cubic
polynomial function ,
Curve Fitting to find
the parameters
A
Q
The process of predication
Write R code to run
S Curve Fitting
Find the parameters of a and b
Find S and P
Agricultural Road improvement and maintenance
Waterfront project
Non-waterfront project
Dredging project
Write R code to run
Neural net module
Train model
Compute the parameters of a, b
S-curve can be obtained
New Input:
Budget, duration, type, location, rainfall
15.
GIS Research Center,Feng Chia University,Taiwan
The introduction of S-curve
• The S-curve is a graphical representation of a construction
project’s cumulative progress from start to finish and
commonly used as a tool for project progress control, but
the traditional forecasting method by calculating the
cumulative progress at each time point from a schedule is
time-consuming and it would be beneficial for project
progress management if the forecast can be assisted by
faster methods.
Project’s cumulative progress
Time
16.
GIS Research Center,Feng Chia University,Taiwan
S Curve formula
x is the time of contract、
y is the cumulative progress
a,b are parameters
x=0, y=0; x=1, y=1
17.
GIS Research Center,Feng Chia University,Taiwan
Raw data
normalization
Curve Fitting by R
Find parameters of
a, b
Forecast New Project
Different S-curve obtained
by different projects
New Input of X
(Future time)
The Y value is
calculated by S-curve
Obtain S-curve
18.
GIS Research Center,Feng Chia University,Taiwan
Input X: 0.0, 0.1, 0.2, 0.3, 0.4, 0.5
Input Y: 0.0, 0.1, 0.2, 0.4, 0.5, 0.6
Model:
Nonlinear regression model
model: y ~ I(a * x^3 + b * x^2 + (1 – a – b) * x)
data: parent.frame()
a b
-0.9116 0.8963
residual sum-of-squares: 0.003034
Number of iterations to convergence: 1
Achieved convergence tolerance: 9.16e-08
New input of X : 0.6, 0.7, 0.8, 0.9, 1.0
Forecast Cumulative progress : 0.73, 0.84, 0.92, 0.98, 1.00
Cumulative monthly actual progress
Forecast Cumulative progress
Forecast Cumulative Progress Monthly Before the end of Selected Project
19.
GIS Research Center,Feng Chia University,Taiwan
Apply the neural network in R
Import Data
Forecast
P and S values
Model Training completed
New
Project’s
Condition
Compute a, b
Observe the difference between the
actual curve prediction curve
Budget, duration, type, location, rainfall
Budget, duration,
type, location, rainfall
20.
GIS Research Center,Feng Chia University,Taiwan
# --------- actual curve -------------
---
P = 0.5957
S = 1.0000
A = computeA(P,S)
B = computeB(P,S)
curve(SCurve, 0, 1)
Observe the difference between
the actual curve prediction curve
# -------- prediction curve ---------
--
PNN = 0.3812277520
SNN = 1.0433264985
A = computeA(PNN,SNN)
B = computeB(PNN,SNN)
curve(SCurve, 0, 1, add=T, col=2)
Prediction curve
Actual curve
21.
GIS Research Center,Feng Chia University,Taiwan
The number of hidden layers RMSE for P RMSE for S
hidden=1 0.1753558174 0.5418783552
hidden=3 0.1757130704 0.5303154711
hidden=5 0.1755577719 0.5280936548
Training
22.
GIS Research Center,Feng Chia University,Taiwan
Question from big data in existed system?
• How to know the reasonable curve
forecast in each project?
• How to find good partners to finish
construction projects on time?
23.
GIS Research Center,Feng Chia University,Taiwan
Data of Sampling
and Testing project
checkDataList<-read.csv(“L:0305/DT-EngQuality_Check.csv”)
gradeDataList<-read.csv("L:0305/DT-EngQuality_Grade.csv")
install.packages("rpart")
library(rpart)
check.tree=rpart(result~constructor+inspector, data= checkDataList)
grade.tree=rpart(result~constructor+inspector, data= gradeDataList)
Data of
Supervising project
Project’s quality correlation analysis
1. What combination (Constructor +
Inspector) is good from historical
data?
2. For reference to find good partners.
Constructor
Inspector
24.
GIS Research Center,Feng Chia University,Taiwan
Each trained data by decision tree
Import Data
Result: Pass/Failed
Ranking: A/B/C
Trained model
New
combination
Verify the accuracy of model
by testing data
Data of Sampling and Testing project
Data of Supervising project
Sampling and Testing project
Supervise project
Constructor
Inspector


![[DSC 2016] 系列活動:許懷中 / R 語言資料探勘實務](https://cdn.slidesharecdn.com/ss_thumbnails/rdatamining-161030010840-thumbnail.jpg?width=640&height=640&fit=bounds)


![[系列活動] 智慧製造與生產線上的資料科學 (製造資料科學:從預測性思維到處方性決策)](https://cdn.slidesharecdn.com/ss_thumbnails/20170211datascienceinmanufacturing-170205150525-thumbnail.jpg?width=640&height=640&fit=bounds)


![[DSC 2016] 系列活動:李祈均 / 人類行為大數據分析](https://cdn.slidesharecdn.com/ss_thumbnails/bspdatasci2016-jeremy-161029145502-thumbnail.jpg?width=640&height=640&fit=bounds)

![[系列活動] Machine Learning 機器學習課程](https://cdn.slidesharecdn.com/ss_thumbnails/ml4ds02122017-170212005829-thumbnail.jpg?width=640&height=640&fit=bounds)


![[台灣人工智慧學校] 人工智慧技術發展與應用](https://cdn.slidesharecdn.com/ss_thumbnails/version5-final-190319060225-thumbnail.jpg?width=640&height=640&fit=bounds)
![[台灣人工智慧學校] 執行長報告](https://cdn.slidesharecdn.com/ss_thumbnails/openingsw-190315170512-thumbnail.jpg?width=640&height=640&fit=bounds)
![[台灣人工智慧學校] 工業 4.0 與智慧製造的發展趨勢與挑戰](https://cdn.slidesharecdn.com/ss_thumbnails/20190316jyh-horngchou-190315170336-thumbnail.jpg?width=640&height=640&fit=bounds)
![[台灣人工智慧學校] 開創台灣產業智慧轉型的新契機](https://cdn.slidesharecdn.com/ss_thumbnails/aiotforaiabytedchangho-190227081005-thumbnail.jpg?width=640&height=640&fit=bounds)
![[台灣人工智慧學校] 開創台灣產業智慧轉型的新契機](https://cdn.slidesharecdn.com/ss_thumbnails/aiinhealthcare-20190216victoria-v6-190227081004-thumbnail.jpg?width=640&height=640&fit=bounds)
![[台灣人工智慧學校] 台北總校第三期結業典禮 - 執行長談話](https://cdn.slidesharecdn.com/ss_thumbnails/tp3closingsw-190126030359-thumbnail.jpg?width=640&height=640&fit=bounds)
![[TOxAIA台中分校] AI 引爆新工業革命,智慧機械首都台中轉型論壇](https://cdn.slidesharecdn.com/ss_thumbnails/aia-chen-190116063635-thumbnail.jpg?width=640&height=640&fit=bounds)
![[TOxAIA台中分校] 2019 台灣數位轉型 與產業升級趨勢觀察](https://cdn.slidesharecdn.com/ss_thumbnails/to-sheng-190116063620-thumbnail.jpg?width=640&height=640&fit=bounds)
![[TOxAIA台中分校] 智慧製造成真! 產線導入AI的致勝關鍵](https://cdn.slidesharecdn.com/ss_thumbnails/thu-hsu-190116063619-thumbnail.jpg?width=640&height=640&fit=bounds)
![[台灣人工智慧學校] 從經濟學看人工智慧產業應用](https://cdn.slidesharecdn.com/ss_thumbnails/1-the-application-of-ai-industry-from-economics-190108064940-thumbnail.jpg?width=640&height=640&fit=bounds)
![[台灣人工智慧學校] 台中分校第二期開學典禮 - 執行長報告](https://cdn.slidesharecdn.com/ss_thumbnails/tc2-opening1-compressed-190107034100-thumbnail.jpg?width=640&height=640&fit=bounds)

![[台中分校] 第一期結業典禮 - 執行長談話](https://cdn.slidesharecdn.com/ss_thumbnails/sw-ppt-181217031715-thumbnail.jpg?width=640&height=640&fit=bounds)
![[TOxAIA新竹分校] 工業4.0潛力新應用! 多模式對話機器人](https://cdn.slidesharecdn.com/ss_thumbnails/20181206004-181210031031-thumbnail.jpg?width=640&height=640&fit=bounds)
![[TOxAIA新竹分校] AI整合是重點! 竹科的關鍵轉型思維](https://cdn.slidesharecdn.com/ss_thumbnails/20181206002-181210031031-thumbnail.jpg?width=640&height=640&fit=bounds)
![[TOxAIA新竹分校] 2019 台灣數位轉型與產業升級趨勢觀察](https://cdn.slidesharecdn.com/ss_thumbnails/20181206-001-181210031002-thumbnail.jpg?width=640&height=640&fit=bounds)
![[TOxAIA新竹分校] 深度學習與Kaggle實戰](https://cdn.slidesharecdn.com/ss_thumbnails/20181206003-181210031001-thumbnail.jpg?width=640&height=640&fit=bounds)
![[台灣人工智慧學校] Bridging AI to Precision Agriculture through IoT](https://cdn.slidesharecdn.com/ss_thumbnails/hc-2nd-openingai-school-181206104858-thumbnail.jpg?width=640&height=640&fit=bounds)
![[2018 台灣人工智慧學校校友年會] 產業經驗分享: 如何用最少的訓練樣本,得到最好的深度學習影像分析結果,減少一半人力,提升一倍品質 / 李明達](https://cdn.slidesharecdn.com/ss_thumbnails/lee-181130104127-thumbnail.jpg?width=640&height=640&fit=bounds)
![[2018 台灣人工智慧學校校友年會] 啟動物聯網新關鍵 - 未來由你「喚」醒 / 沈品勳](https://cdn.slidesharecdn.com/ss_thumbnails/20181117shengfn-181130083931-thumbnail.jpg?width=640&height=640&fit=bounds)