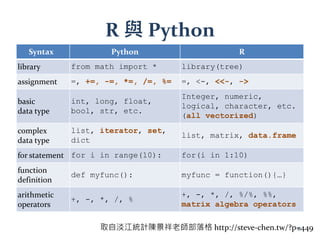
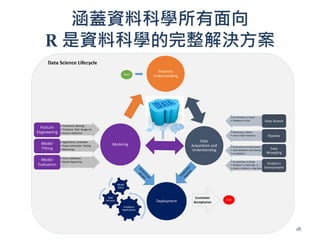
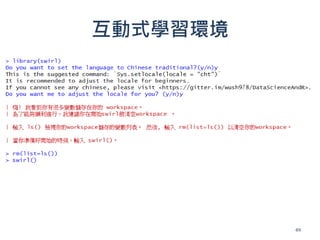
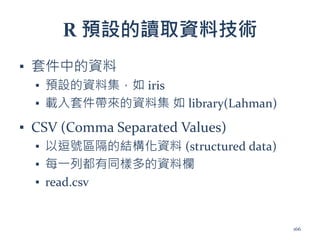
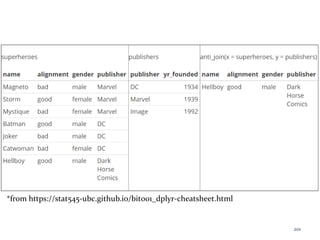
本文档为学习 R 语言的入门指南,涵盖了安装 R 和 RStudio 的步骤、R 语言的特点、基本语法以及常用的数据科学工具和技术,包括统计建模、数据处理和可视化。文中还通过 A/B 测试举例解释了 R 在数据分析中的应用,同时介绍了 R 的丰富生态系统和众多扩展包。最后,文档强调了 R 作为数据科学完整解决方案的重要性和应用潜力。
安裝 R
▪ 請至http://cran.csie.ntu.edu.tw/ 下載 3.2 版以上的 R
▪ For Windows Users
▪ https://www.youtube.com/watch?v=FsOHPGUIDZU
▪ 注意影片下載的是 3.0.2版,請安裝最新版 (3.2版以上)
▪ For Mac Users
▪ https://www.youtube.com/watch?v=72MYRBNo5Bk
▪ 感謝中華 R 軟體學會的李明昌老師提供影片
▪ For Ubuntu Users
▪ 請參照下列說明
▪ http://cran.csie.ntu.edu.tw/bin/linux/ubuntu/README.html
39
40.
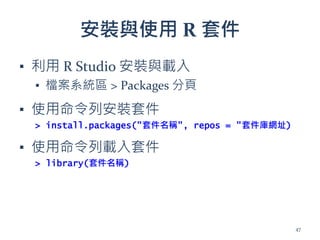
安裝 R Studio
▪R Studio 為 R 的 IDE 環境
▪ 圖形化介面,完整支援 R 的編輯、繪圖以及文件說明
▪ 具備「自動完成」功能
▪ 在 Windows 下支援 UTF-8 的檔案編碼
▪ 請到 R Studio 官方網站
https://www.rstudio.com/products/RStudio/
▪ 下載並安裝 R Studio Desktop Open Source
Edition
40
更多命令
> a <-1
> a
[1] 1
> a + 1
[1] 2
> a = a + 1
[1] 2
> a + 1 -> b
> b
[1] 3
> c(a, b, 1, 11, 21)
[1] 2 3 1 11 21
> 1:5
[1] 1 2 3 4 5
串接數值
賦值 (assignment)
觀察其他資訊區 Environment
分頁下的變化
43
44.
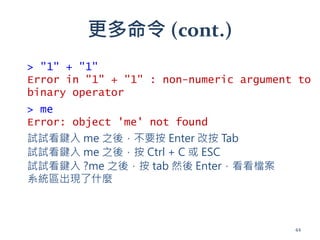
更多命令 (cont.)
> me
Error:object 'me' not found
試試看鍵入 me 之後,不要按 Enter 改按 Tab
試試看鍵入 me 之後,按 Ctrl + C 或 ESC
> "1" + "1"
Error in "1" + "1" : non-numeric argument to
binary operator
試試看鍵入 ?me 之後,按 tab 然後 Enter,看看檔案
系統區出現了什麼
44
45.
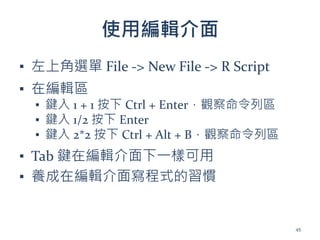
使用編輯介面
▪ 左上角選單 File-> New File -> R Script
▪ 在編輯區
▪ 鍵入 1 + 1 按下 Ctrl + Enter,觀察命令列區
▪ 鍵入 1/2 按下 Enter
▪ 鍵入 2*2 按下 Ctrl + Alt + B,觀察命令列區
▪ Tab 鍵在編輯介面下一樣可用
▪ 養成在編輯介面寫程式的習慣
45
list & names
>x <- list(1:5, c("a", "b"))
> x
[[1]]
[1] 1 2 3 4 5
[[2]]
[1] "a" "b"
> attributes(x)
NULL
101
101.
> x <-list(a = 1:5, b = c("a", "b"))
> x
$a
[1] 1 2 3 4 5
$b
[1] "a" "b"
> attributes(x)
$names
[1] "a" "b"
102
list & names (cont.)
102.
$
> x <-list(a = 1:5, b = c("a", "b"))
> x$a
[1] 1 2 3 4 5
> x$b
[1] "a" "b"
103
103.
從 list 到data.frame
▪ list 提供了處理異質資料的工具
▪ R 的物件導向系統就是以 list 為基礎
▪ 將 list 用於結構化資料仍然不甚直覺
▪ 不像矩陣提供許多方便的 API
▪ 所以我們有了 data.frame
▪ 用於結構化資料的 R 物件
▪ 兼具 list 與 matrix 的特性
104
R 的 DataFrame
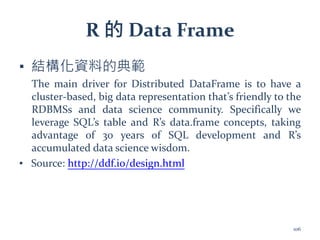
▪ 結構化資料的典範
The main driver for Distributed DataFrame is to have a
cluster-based, big data representation that’s friendly to the
RDBMSs and data science community. Specifically we
leverage SQL’s table and R’s data.frame concepts, taking
advantage of 30 years of SQL development and R’s
accumulated data science wisdom.
▪ Source: http://ddf.io/design.html
106
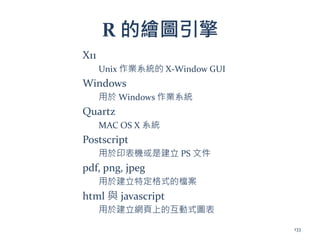
R 的繪圖引擎
X11
Unix 作業系統的X-Window GUI
Windows
用於 Windows 作業系統
Quartz
MAC OS X 系統
Postscript
用於印表機或是建立 PS 文件
pdf, png, jpeg
用於建立特定格式的檔案
html 與 javascript
用於建立網頁上的互動式圖表
133
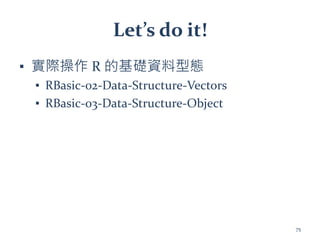
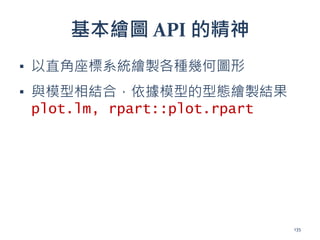
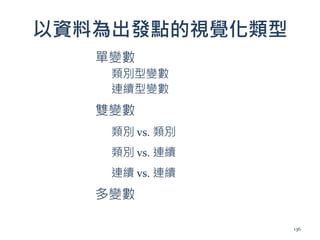
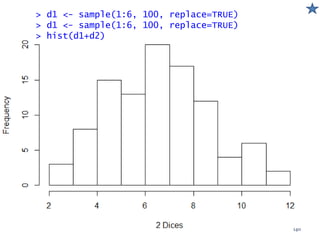
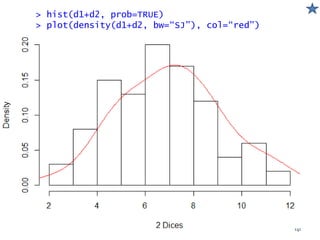
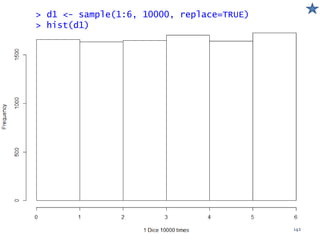
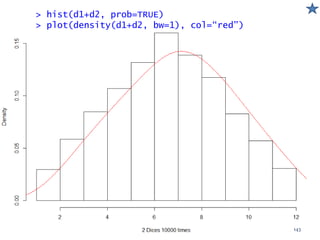
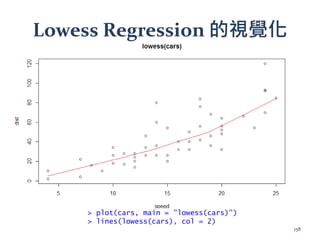
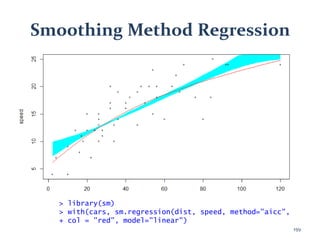
Let’s do it
▪實際利用 R 的基礎繪圖 API 進行單變數與
雙變數的視覺化
▪ 請同學們完成
▪ RVisualization-01-One-Variable-Visualization
▪ RVisualization-02-Two-Variables-Visualization
154
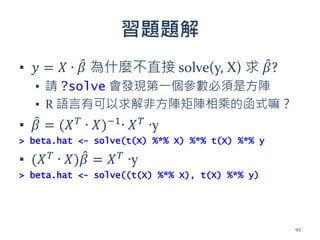
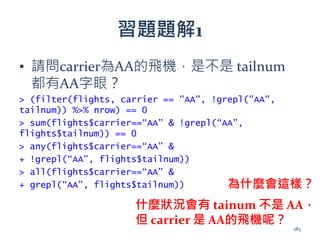
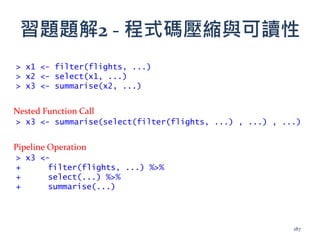
習題題解1 (cont.)
▪ 有事情想不明白,就向資料問答案
>filter(flights, carrier=="AA", !grepl("AA", tailnum)) %>%
"$"("tailnum")
[1] "" "" "" "" "" "" "" "" "" "" "" "" "" "" "" "" "" "" "" "" "" "“
[23] "" "" "" "" "" "" "" "" "" "" "" "" "" "" "" "" "" "" "" "" "" "“
[45] "" "" "" "" "" "" "" "" "" "" "" "" "" "" "" "" "" "" "" "" "" "“
[67] "" "" "" "" "" "" "" "" "" "" "" "" "" "" "" "" "" ""
> filter(flights, carrier=="AA", !grepl("AA", tailnum)) %>% head()
# A tibble: 6 × 16
year month day dep_time dep_delay arr_time arr_delay carrier tailnum
flight origin dest air_time distance hour minute <int> <int> <int>
<int> <dbl> <int> <dbl> <chr> <chr> <int> <chr> <chr> <dbl> <dbl>
<dbl> <dbl>
1 2013 1 2 NA NA NA NA AA 133 JFK LAX NA 2475 NA NA
2 2013 11 24 NA NA NA NA AA 1185 LGA DFW NA 1389 NA NA
3 2013 11 24 NA NA NA NA AA 1691 EWR DFW NA 1372 NA NA
4 2013 11 25 NA NA NA NA AA 1103 LGA DFW NA 1389 NA NA
5 2013 11 25 NA NA NA NA AA 1107 LGA DFW NA 1389 NA NA
6 2013 11 25 NA NA NA NA AA 1381 EWR DFW NA 1372 NA NA
186


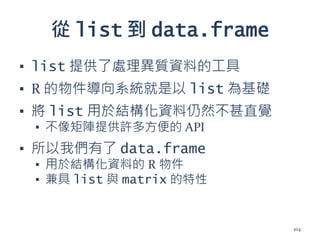
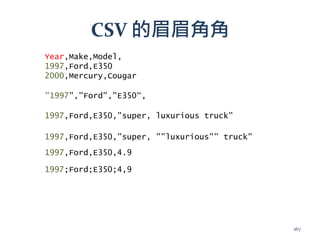
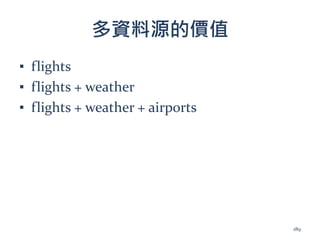
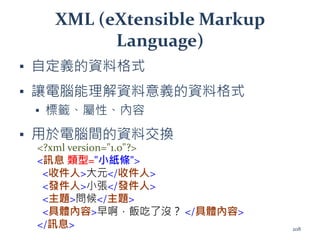
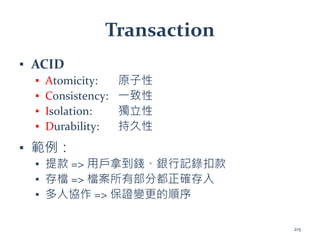
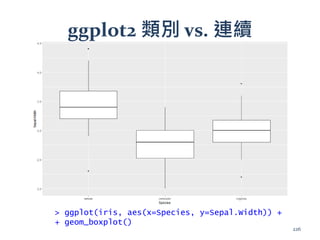
![範例 - A/B Testing (成效比較)
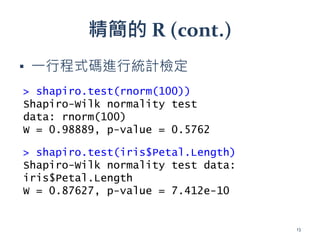
▪ 統計檢定的概念
▪ 如果方法 A 的轉換率與方法 B 相同 (3/5000)
▪ 那在 10000 點擊中,發生 10 個以上購買的機率是多少?
> p <- 3/5000
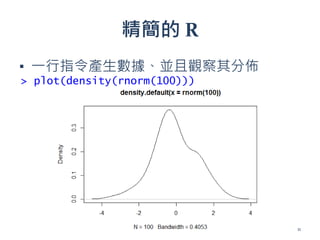
> plot(density(x <- rbinom(1000, 10000, p)))
> abline(v=10, col=2)
> mean(x > 10)
[1] 0.036
16](https://image.slidesharecdn.com/2017032526r4sweslides-170323012847/85/R-16-320.jpg)
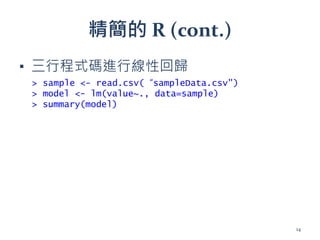
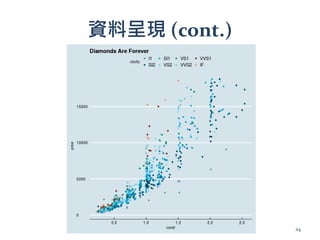
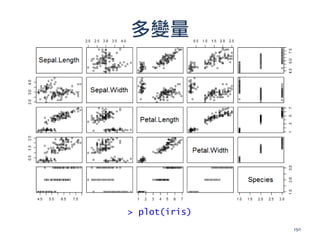
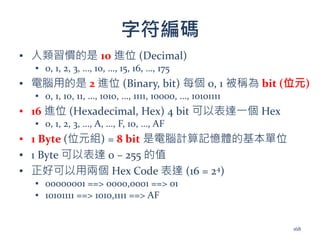
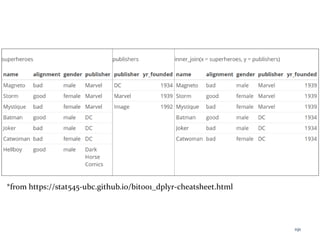
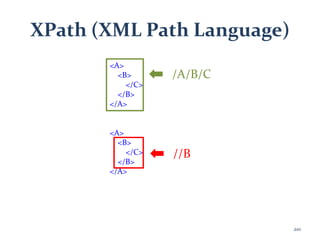
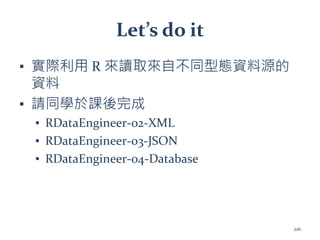
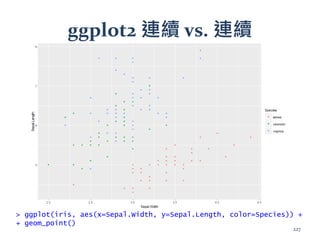
![資料呈現
> install.packages(“PerformanceAnalytics”)
> suppressPackageStartupMessages(library(PerformanceAnalytics))
> chart.Correlation(iris[-5], bg=iris$Species, pch=21)
23](https://image.slidesharecdn.com/2017032526r4sweslides-170323012847/85/R-23-320.jpg)

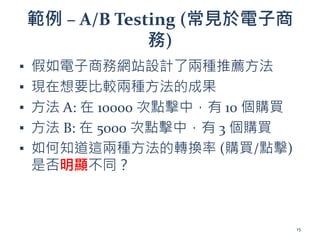
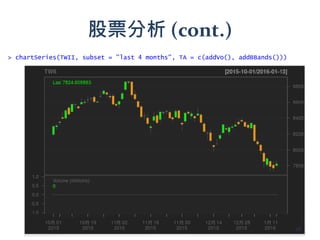
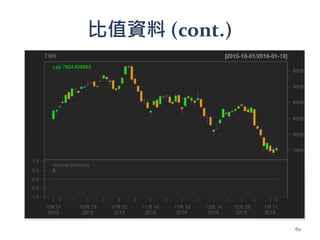
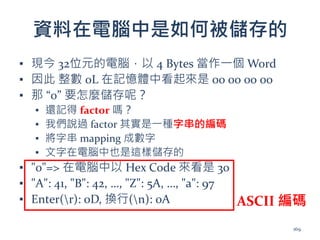
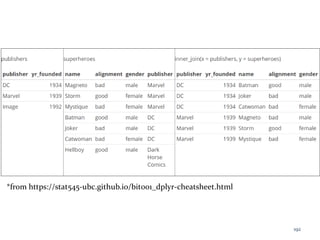
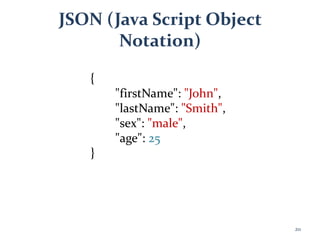
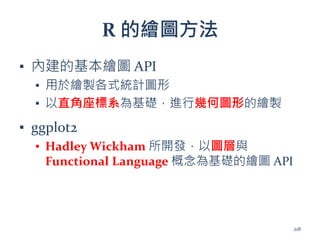
![眾多的套件 - 股票分析
> install.packages("quantmod")
> library(quantmod)
> getSymbols("^TWII")
[1] "TWII"
> head(TWII)
TWII.Open TWII.High TWII.Low TWII.Close TWII.Volume TWII.Adjusted
2007-01-02 7871.41 7937.26 7843.60 7920.80 5710600 7920.80
2007-01-03 7954.96 7999.42 7917.30 7917.30 5951400 7917.30
2007-01-04 7929.89 7955.90 7901.24 7934.51 5717400 7934.51
2007-01-05 7940.20 7942.23 7821.71 7835.57 5181400 7835.57
2007-01-08 7778.57 7797.57 7736.11 7736.71 4292400 7736.71
2007-01-09 7778.38 7827.93 7778.38 7790.01 4516000 7790.01
27](https://image.slidesharecdn.com/2017032526r4sweslides-170323012847/85/R-27-320.jpg)
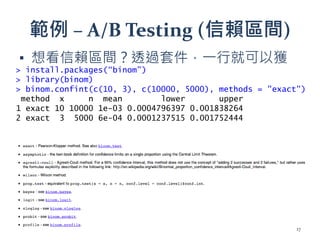
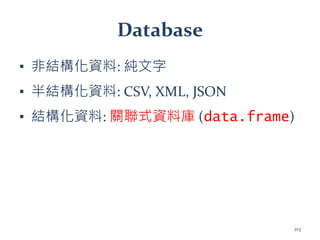
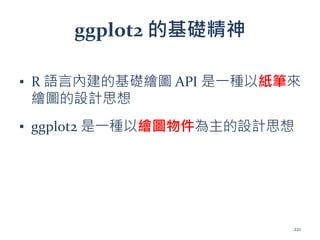
![眾多的套件 - 棒球分析
> library(Lahman)
> head(Teams[,c("yearID", "name", "Rank", "W", "L", "R", "RA")])
yearID name Rank W L R RA
1 1871 Boston Red Stockings 3 20 10 401 303
2 1871 Chicago White Stockings 2 19 9 302 241
3 1871 Cleveland Forest Citys 8 10 19 249 341
4 1871 Fort Wayne Kekiongas 7 7 12 137 243
5 1871 New York Mutuals 5 16 17 302 313
6 1871 Philadelphia Athletics 1 21 7 376 266
29](https://image.slidesharecdn.com/2017032526r4sweslides-170323012847/85/R-29-320.jpg)
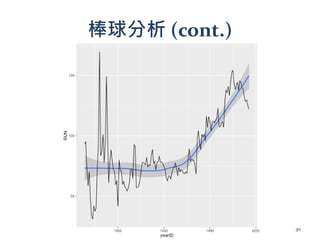
![棒球分析
> Pitching[Pitching$playerID=="wangch01", c(1,4,13,6,7,20)]
playerID teamID IPouts W L ERA
36850 wangch01 NYA 349 8 5 4.02
37547 wangch01 NYA 654 19 6 3.63
38262 wangch01 NYA 598 19 7 3.70
38978 wangch01 NYA 285 8 2 4.07
39706 wangch01 NYA 126 1 6 9.64
41101 wangch01 WAS 187 4 3 4.04
41824 wangch01 WAS 97 2 3 6.68
42547 wangch01 TOR 81 1 2 7.67
31](https://image.slidesharecdn.com/2017032526r4sweslides-170323012847/85/R-31-320.jpg)


![讓我們從命令列開始
▪ R 是一種 script language,使用者可以藉由命令列
執行指令
▪ R 的提示符號 >
> "hello world"
[1] "hello world"
> 1
[1] 1
> 1+1
[1] 2
> 1+
+ 1
[1] 2
提示符號變成 + 表示指令未完成
字串
數字
數字運算
42](https://image.slidesharecdn.com/2017032526r4sweslides-170323012847/85/R-42-320.jpg)
![更多命令
> a <- 1
> a
[1] 1
> a + 1
[1] 2
> a = a + 1
[1] 2
> a + 1 -> b
> b
[1] 3
> c(a, b, 1, 11, 21)
[1] 2 3 1 11 21
> 1:5
[1] 1 2 3 4 5
串接數值
賦值 (assignment)
觀察其他資訊區 Environment
分頁下的變化
43](https://image.slidesharecdn.com/2017032526r4sweslides-170323012847/85/R-43-320.jpg)


![R 的向量化資料型態
<= 相當於 a + c(1, 1, 1, 1, 1)
<= 每個元素都各別乘 2
> a <- c(1,2,3,4,5)
> a
[1] 1 2 3 4 5
> a+1
[1] 2 3 4 5 6
> a*2
[1] 2 4 6 8 10
67](https://image.slidesharecdn.com/2017032526r4sweslides-170323012847/85/R-66-320.jpg)
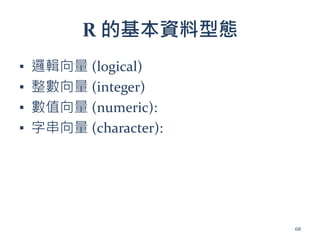
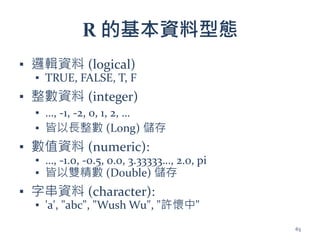
![邏輯向量 (logical)
▪ 用於作布林 (boolean) 運算,流程控制
> c(T, F, TRUE, FALSE)
[1] TRUE FALSE TRUE FALSE
> a = -1
> ifelse(a > 0, 1, 0)
[1] 0
> a > 0
[1] FALSE
69](https://image.slidesharecdn.com/2017032526r4sweslides-170323012847/85/R-68-320.jpg)
![整數向量
▪ 每個整數佔4 Bytes – 長整數
> c(1L, 2L, 3L, 4L, 0xaL)
[1] 1 2 3 4 10
70](https://image.slidesharecdn.com/2017032526r4sweslides-170323012847/85/R-69-320.jpg)
![數值向量
▪ 每個數值大小 8 bytes (雙精確浮點數)
> c(1.0, .1, 1e-2, 1e2, 1.2e2)
[1] 1.00 0.10 0.01 100.00 120.00
71](https://image.slidesharecdn.com/2017032526r4sweslides-170323012847/85/R-70-320.jpg)
![字串向量
▪ NULL 結尾的字串向量
> c("1","a","中文")
[1] "1" "a" "中文"
> c("a0b")
Error: nul character not allowed (line 1)
72](https://image.slidesharecdn.com/2017032526r4sweslides-170323012847/85/R-71-320.jpg)
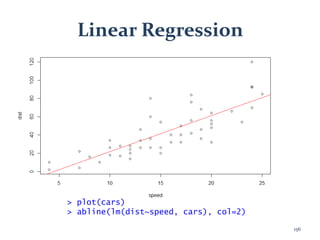
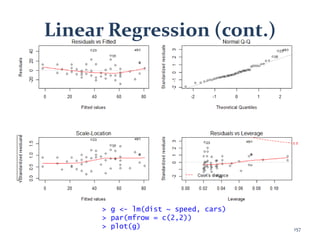
![R 物件可以很複雜
▪ 複雜的 R 物件都是由基礎的 R 物件所組成
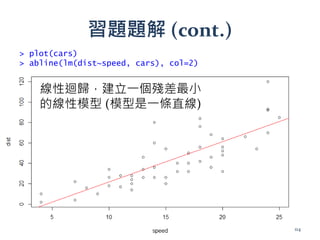
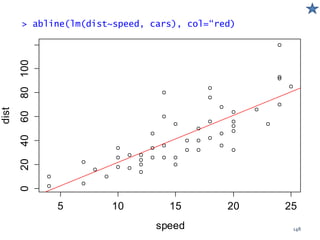
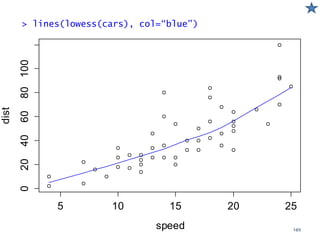
> g <- lm(dist ~ speed, cars)
> str(head(g))
List of 6
$ coefficients : Named num [1:2] -17.58 3.93
..- attr(*, "names")= chr [1:2] "(Intercept)" "speed"
$ residuals : Named num [1:50] 3.85 11.85 -5.95 12.05 2.12 ...
..- attr(*, "names")= chr [1:50] "1" "2" "3" "4" ...
$ effects : Named num [1:50] -303.914 145.552 -8.115 9.885 0.194 ...
..- attr(*, "names")= chr [1:50] "(Intercept)" "speed" "" "" ...
$ rank : int 2 $ fitted.values: Named num [1:50] -1.85 -1.85 9.95 9.95 13.88 ...
..- attr(*, "names")= chr [1:50] "1" "2" "3" "4" ...
$ assign : int [1:2] 0 1
74](https://image.slidesharecdn.com/2017032526r4sweslides-170323012847/85/R-73-320.jpg)
![習題題解 (cont.)
year1 power1 power2
87 6097059332 59090445718
88 6425887925 61981666330
89 6982579022 67378329131
90 7323992602.53436 66127460204.6482
91 7954239517 69696372914.6949
找出社會服務業用電量超過7x10⁹ 的年份
軟體工程師的想法:
(1) 找出 power1 陣列大於 7x10⁹ 的 index
(2) 取出 year1 相同 index 的值
> index = which(power1 > 7e9)
> year1[index]
[1] 90 91
用 R 怎麼做?
欸,老師你沒教!
77](https://image.slidesharecdn.com/2017032526r4sweslides-170323012847/85/R-76-320.jpg)
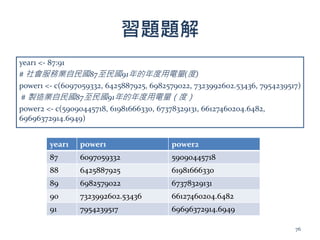
![習題題解 (cont.)
year1 power1 power2
87 6097059332 59090445718
88 6425887925 61981666330
89 6982579022 67378329131
90 7323992602.53436 66127460204.6482
91 7954239517 69696372914.6949
找出社會服務業用電量超過 7x10⁹ 的年份
R 語言的思維
(1) 年份跟用電量是互相對應的
(2) 那就取出社會服務業用電量超過 7x10⁹ 的年份吧
> year1[power1 > 7e9]
[1] 90 91
78](https://image.slidesharecdn.com/2017032526r4sweslides-170323012847/85/R-77-320.jpg)
![習題題解 (cont.)
> power1 > 7e9
[1] FALSE FALSE FALSE TRUE TRUE
> year1
[1] 87 88 89 90 91
> year1[power1 > 7e9]
[1] 90 91
79](https://image.slidesharecdn.com/2017032526r4sweslides-170323012847/85/R-78-320.jpg)
![習題題解 (cont.)
> pca <- prcomp(USArrests, scale = TRUE)
> str(pca)
List of 5
$ sdev : num [1:4] 1.575 0.995 0.597 0.416
$ rotation: num [1:4, 1:4] -0.536 -0.583 -0.278 -0.543 0.418 ...
..- attr(*, "dimnames")=List of 2
.. ..$ : chr [1:4] "Murder" "Assault" "UrbanPop" "Rape"
.. ..$ : chr [1:4] "PC1" "PC2" "PC3" "PC4"
$ center : Named num [1:4] 7.79 170.76 65.54 21.23
..- attr(*, "names")= chr [1:4] "Murder" "Assault" "UrbanPop" "Rape"
$ scale : Named num [1:4] 4.36 83.34 14.47 9.37
..- attr(*, "names")= chr [1:4] "Murder" "Assault" "UrbanPop" "Rape"
$ x : num [1:50, 1:4] -0.976 -1.931 -1.745 0.14 -2.499 ...
..- attr(*, "dimnames")=List of 2
.. ..$ : chr [1:50] "Alabama" "Alaska" "Arizona" "Arkansas" ...
.. ..$ : chr [1:4] "PC1" "PC2" "PC3" "PC4" - attr(*, "class")= chr
"prcomp“
> pca$sdev
[1] 1.575 0.995 0.597 0.416
> pca$[["sdev“]]
[1] 1.575 0.995 0.597 0.416
80](https://image.slidesharecdn.com/2017032526r4sweslides-170323012847/85/R-79-320.jpg)

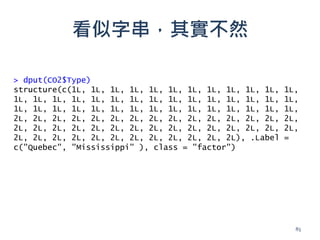
![factor?
▪ 內建的 factor 範例
> head(CO2$Type)
[1] Quebec Quebec Quebec Quebec Quebec Quebec
Levels: Quebec Mississippi
82](https://image.slidesharecdn.com/2017032526r4sweslides-170323012847/85/R-81-320.jpg)
![factor -名目資料的編碼
> attributes(CO2$Type)
$levels [1] "Quebec" "Mississippi"
$class [1] "factor"
84](https://image.slidesharecdn.com/2017032526r4sweslides-170323012847/85/R-83-320.jpg)


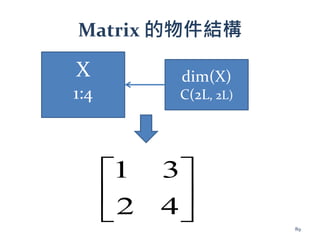
![R 的 Matrix
> x <- matrix(1:4, 2, 2)
> x
[,1] [,2]
[1,] 1 3
[2,] 2 4
> class(x)
[1] "matrix
> attributes(x)
$dim
[1] 2 2
87](https://image.slidesharecdn.com/2017032526r4sweslides-170323012847/85/R-86-320.jpg)
![藉由 Attributes 操弄 Matrix
> attributes(x) <- NULL
> x
[1] 1 2 3 4
88](https://image.slidesharecdn.com/2017032526r4sweslides-170323012847/85/R-87-320.jpg)
![R 的 Array 與 Attributes
> x <- 1:8
> x
[1] 1 2 3 4 5 6 7 8
> attr(x, "dim") <- c(2, 2, 2)
> x
, , 1
[,1] [,2]
[1,] 1 3
[2,] 2 4
, , 2
[,1] [,2]
[1,] 5 7
[2,] 6 8
90](https://image.slidesharecdn.com/2017032526r4sweslides-170323012847/85/R-89-320.jpg)

![基本資料型態的向量必須是同質的
> x <- 1:10
> class(x)
[1] "integer"
> x
[1] 1 2 3 4 5 6 7 8 9 10
> x[1] <- "1"
> class(x)
[1] "character"
> x
[1] "1" "2" "3" "4" "5" "6" "7"
[8] "8" "9" "10"
牽一髮而動全身
95](https://image.slidesharecdn.com/2017032526r4sweslides-170323012847/85/R-94-320.jpg)

![整數向量
> 1:5
[1] 1 2 3 4 5
97](https://image.slidesharecdn.com/2017032526r4sweslides-170323012847/85/R-96-320.jpg)
![> x <- list(1:5, c("a","b"))
> x
[[1]]
[1] 1 2 3 4 5
[[2]]
[1] "a" "b"
list
98](https://image.slidesharecdn.com/2017032526r4sweslides-170323012847/85/R-97-320.jpg)
![[
> x[1]
[[1]]
[1] 1 2 3 4 5
> class(x[1])
[1] "list"
99](https://image.slidesharecdn.com/2017032526r4sweslides-170323012847/85/R-98-320.jpg)
![[[
> x[[1]]
[1] 1 2 3 4 5
> class(x[[1]])
[1] “integer"
100](https://image.slidesharecdn.com/2017032526r4sweslides-170323012847/85/R-99-320.jpg)
![list & names
> x <- list(1:5, c("a", "b"))
> x
[[1]]
[1] 1 2 3 4 5
[[2]]
[1] "a" "b"
> attributes(x)
NULL
101](https://image.slidesharecdn.com/2017032526r4sweslides-170323012847/85/R-100-320.jpg)
![> x <- list(a = 1:5, b = c("a", "b"))
> x
$a
[1] 1 2 3 4 5
$b
[1] "a" "b"
> attributes(x)
$names
[1] "a" "b"
102
list & names (cont.)](https://image.slidesharecdn.com/2017032526r4sweslides-170323012847/85/R-101-320.jpg)
![$
> x <- list(a = 1:5, b = c("a", "b"))
> x$a
[1] 1 2 3 4 5
> x$b
[1] "a" "b"
103](https://image.slidesharecdn.com/2017032526r4sweslides-170323012847/85/R-102-320.jpg)

![Data Frame 是一種 List
> class(iris)
[1] "data.frame"
> is.list(iris)
[1] TRUE
> head(iris[[1]])
[1] 5.1 4.9 4.7 4.6 5.0 5.4
108](https://image.slidesharecdn.com/2017032526r4sweslides-170323012847/85/R-107-320.jpg)
![但又可以當作 Matrix 來存取
> iris[1,]
Sepal.Length Sepal.Width Petal.Length Petal.Width Species
1 5.1 3.5 1.4 0.2 setosa
> iris[1,1]
[1] 5.1
不同之處在於,matrix 中所有資料型態必須一致,
但 data.frame 由於具備 list 的特性,可以容許各
column 的資料型態不同
109](https://image.slidesharecdn.com/2017032526r4sweslides-170323012847/85/R-108-320.jpg)


![字串向量的記憶體用量較難估計
> speaker <- readLines("speaker.txt")
> speaker[2]
[1] "年會總召, 中央研究院資訊科學研究所/ 研究員"
> length(speaker)
[1] 216
> file.size("speaker.txt")
[1] 18464
> object.size(speaker)
24664 bytes
125](https://image.slidesharecdn.com/2017032526r4sweslides-170323012847/85/R-124-320.jpg)

![tracemem
> x<-c(1,2,3)
> tracemem(x)
[1] "<000000001C45EA30>"
> x <- c(1,2,3)
> tracemem(x)
[1] "<0000000017ED9AD0>"
> y <- x
> tracemem(y)
[1] "<0000000017ED9AD0>"
> y[2] <- 3
tracemem[0x0000000017ed9ad0 -> 0x0000000017f6f888]:
131](https://image.slidesharecdn.com/2017032526r4sweslides-170323012847/85/R-130-320.jpg)

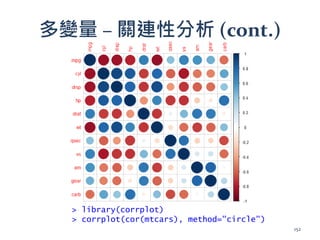
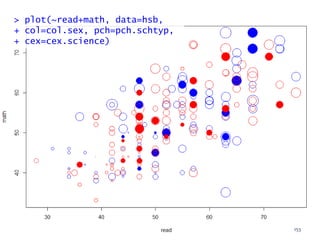
![多變量 – 關連性分析
> library(PerformanceAnalytics)
> chart.Correlation(iris[-5], bg=iris$Species, pch=21)
151](https://image.slidesharecdn.com/2017032526r4sweslides-170323012847/85/R-150-320.jpg)


![多變量 PCA
> library(ade4)
> g <- dudi.pca(iris[,-5], scan = F)
> scatter(g)
161](https://image.slidesharecdn.com/2017032526r4sweslides-170323012847/85/R-160-320.jpg)


![何謂非結構化資料?
▪ 非結構化資料範例
▪ 64.242.88.10 - - [07/Mar/2004:16:05:49 -0800] "GET
/twiki/bin/edit/Main/Double_bounce_sender?topicparent
=Main.ConfigurationVariables HTTP/1.1" 401 12846
▪ 64.242.88.10 - - [07/Mar/2004:16:06:51 -0800] "GET
/twiki/bin/rdiff/TWiki/NewUserTemplate?rev1=1.3&rev2=
1.2 HTTP/1.1" 200 4523
175](https://image.slidesharecdn.com/2017032526r4sweslides-170323012847/85/R-174-320.jpg)
![什麼是 Parsing
▪ 告訴電腦分拆非結構化資料的規則
▪ Domain Knowledge,例如 ip位址:
168.95.192.1
▪ 字元在字串中的位置,如 121E25N
▪ 分隔符號,如逗號、分號、冒號等
▪ Regular Expression 正規表示式
▪ 身分證字號的正規表示式:
▪ ^[A-Z]{1}[1-2]{1}[0-9]{8}$
176](https://image.slidesharecdn.com/2017032526r4sweslides-170323012847/85/R-175-320.jpg)

![習題題解1 (cont.)
▪ 有事情想不明白,就向資料問答案
> filter(flights, carrier=="AA", !grepl("AA", tailnum)) %>%
"$"("tailnum")
[1] "" "" "" "" "" "" "" "" "" "" "" "" "" "" "" "" "" "" "" "" "" "“
[23] "" "" "" "" "" "" "" "" "" "" "" "" "" "" "" "" "" "" "" "" "" "“
[45] "" "" "" "" "" "" "" "" "" "" "" "" "" "" "" "" "" "" "" "" "" "“
[67] "" "" "" "" "" "" "" "" "" "" "" "" "" "" "" "" "" ""
> filter(flights, carrier=="AA", !grepl("AA", tailnum)) %>% head()
# A tibble: 6 × 16
year month day dep_time dep_delay arr_time arr_delay carrier tailnum
flight origin dest air_time distance hour minute <int> <int> <int>
<int> <dbl> <int> <dbl> <chr> <chr> <int> <chr> <chr> <dbl> <dbl>
<dbl> <dbl>
1 2013 1 2 NA NA NA NA AA 133 JFK LAX NA 2475 NA NA
2 2013 11 24 NA NA NA NA AA 1185 LGA DFW NA 1389 NA NA
3 2013 11 24 NA NA NA NA AA 1691 EWR DFW NA 1372 NA NA
4 2013 11 25 NA NA NA NA AA 1103 LGA DFW NA 1389 NA NA
5 2013 11 25 NA NA NA NA AA 1107 LGA DFW NA 1389 NA NA
6 2013 11 25 NA NA NA NA AA 1381 EWR DFW NA 1372 NA NA
186](https://image.slidesharecdn.com/2017032526r4sweslides-170323012847/85/R-185-320.jpg)


![JSON (cont.)
▪ 字串:"firstName", "John"
▪ 數字: 25
▪ 陣列: [1, 2, "3"]
▪ 物件: {
▪ "a" : 1,
▪ "b" : "string",
▪ "c" : { "c1" : 1 }
▪ }
212](https://image.slidesharecdn.com/2017032526r4sweslides-170323012847/85/R-211-320.jpg)
![藉由 DB Connection 操作外部資料
庫
▪ > library(RSQLite)
▪ Loading required package: DBI
▪ Loading required package: methods
▪ > methods("dbConnect")
▪ [1] dbConnect,SQLiteConnection-method
dbConnect,SQLiteDriver-method
▪ see '?methods' for accessing help and source code
214](https://image.slidesharecdn.com/2017032526r4sweslides-170323012847/85/R-213-320.jpg)


![SSII2021 [OS2-02] 深層学習におけるデータ拡張の原理と最新動向](https://cdn.slidesharecdn.com/ss_thumbnails/os2-03latest-210610045610-thumbnail.jpg?width=640&height=640&fit=bounds)


![[DL輪読会]Focal Loss for Dense Object Detection](https://cdn.slidesharecdn.com/ss_thumbnails/focalloss-180208092846-thumbnail.jpg?width=640&height=640&fit=bounds)


![[DL輪読会]Disentangling by Factorising](https://cdn.slidesharecdn.com/ss_thumbnails/20180720disentanglingbyfactorising-180720000930-thumbnail.jpg?width=640&height=640&fit=bounds)


![[R勉強会][データマイニング] R言語による時系列分析](https://cdn.slidesharecdn.com/ss_thumbnails/r-100423232629-phpapp01-thumbnail.jpg?width=640&height=640&fit=bounds)
![[系列活動] 一日搞懂生成式對抗網路](https://cdn.slidesharecdn.com/ss_thumbnails/gan-170813004356-thumbnail.jpg?width=640&height=640&fit=bounds)
![[系列活動] 無所不在的自然語言處理—基礎概念、技術與工具介紹](https://cdn.slidesharecdn.com/ss_thumbnails/nlptutorial-0828-170830062001-thumbnail.jpg?width=640&height=640&fit=bounds)
![[系列活動] 智慧城市中的時空大數據應用](https://cdn.slidesharecdn.com/ss_thumbnails/dscstbigdata1060211-170211004152-thumbnail.jpg?width=640&height=640&fit=bounds)
![[系列活動] 文字探勘者的入門心法](https://cdn.slidesharecdn.com/ss_thumbnails/textmininghandout-170320140215-170327095320-thumbnail.jpg?width=640&height=640&fit=bounds)
![[系列活動] Machine Learning 機器學習課程](https://cdn.slidesharecdn.com/ss_thumbnails/ml4ds02122017-170212005829-thumbnail.jpg?width=640&height=640&fit=bounds)
![[系列活動] 手把手教你R語言資料分析實務](https://cdn.slidesharecdn.com/ss_thumbnails/stepbystepr20170114-170113030702-thumbnail.jpg?width=640&height=640&fit=bounds)
![[系列活動] Python 程式語言起步走](https://cdn.slidesharecdn.com/ss_thumbnails/python20170812-170808043244-thumbnail.jpg?width=640&height=640&fit=bounds)
![[系列活動] 一天搞懂對話機器人](https://cdn.slidesharecdn.com/ss_thumbnails/onedaybot0422-170421235605-170422003351-thumbnail.jpg?width=640&height=640&fit=bounds)
![[系列活動] 使用 R 語言建立自己的演算法交易事業](https://cdn.slidesharecdn.com/ss_thumbnails/rtradingbusiness-170115010649-thumbnail.jpg?width=640&height=640&fit=bounds)
![[系列活動] Python爬蟲實戰](https://cdn.slidesharecdn.com/ss_thumbnails/python-170809083644-thumbnail.jpg?width=640&height=640&fit=bounds)
![[系列活動] 機器學習速遊](https://cdn.slidesharecdn.com/ss_thumbnails/mltourhandout-170310083857-thumbnail.jpg?width=640&height=640&fit=bounds)
![[DSC 2016] 系列活動:李宏毅 / 一天搞懂深度學習](https://cdn.slidesharecdn.com/ss_thumbnails/1-160521014039-thumbnail.jpg?width=640&height=640&fit=bounds)


![[DSC x TAAI 2016] 林守德 / 人工智慧與機器學習在推薦系統上的應用](https://cdn.slidesharecdn.com/ss_thumbnails/md-161124235136-thumbnail.jpg?width=640&height=640&fit=bounds)
![[系列活動] 人工智慧與機器學習在推薦系統上的應用](https://cdn.slidesharecdn.com/ss_thumbnails/merged-161217165734-thumbnail.jpg?width=640&height=640&fit=bounds)


![[系列活動] 資料探勘速遊](https://cdn.slidesharecdn.com/ss_thumbnails/0114ycchendmquicktour-170110050658-thumbnail.jpg?width=640&height=640&fit=bounds)


![[系列活動] Python 爬蟲實戰](https://cdn.slidesharecdn.com/ss_thumbnails/pythonafunjimv1-171213041823-thumbnail.jpg?width=640&height=640&fit=bounds)


![[台灣人工智慧學校] 人工智慧技術發展與應用](https://cdn.slidesharecdn.com/ss_thumbnails/version5-final-190319060225-thumbnail.jpg?width=640&height=640&fit=bounds)
![[台灣人工智慧學校] 執行長報告](https://cdn.slidesharecdn.com/ss_thumbnails/openingsw-190315170512-thumbnail.jpg?width=640&height=640&fit=bounds)
![[台灣人工智慧學校] 工業 4.0 與智慧製造的發展趨勢與挑戰](https://cdn.slidesharecdn.com/ss_thumbnails/20190316jyh-horngchou-190315170336-thumbnail.jpg?width=640&height=640&fit=bounds)
![[台灣人工智慧學校] 開創台灣產業智慧轉型的新契機](https://cdn.slidesharecdn.com/ss_thumbnails/aiotforaiabytedchangho-190227081005-thumbnail.jpg?width=640&height=640&fit=bounds)
![[台灣人工智慧學校] 開創台灣產業智慧轉型的新契機](https://cdn.slidesharecdn.com/ss_thumbnails/aiinhealthcare-20190216victoria-v6-190227081004-thumbnail.jpg?width=640&height=640&fit=bounds)
![[台灣人工智慧學校] 台北總校第三期結業典禮 - 執行長談話](https://cdn.slidesharecdn.com/ss_thumbnails/tp3closingsw-190126030359-thumbnail.jpg?width=640&height=640&fit=bounds)
![[TOxAIA台中分校] AI 引爆新工業革命,智慧機械首都台中轉型論壇](https://cdn.slidesharecdn.com/ss_thumbnails/aia-chen-190116063635-thumbnail.jpg?width=640&height=640&fit=bounds)
![[TOxAIA台中分校] 2019 台灣數位轉型 與產業升級趨勢觀察](https://cdn.slidesharecdn.com/ss_thumbnails/to-sheng-190116063620-thumbnail.jpg?width=640&height=640&fit=bounds)
![[TOxAIA台中分校] 智慧製造成真! 產線導入AI的致勝關鍵](https://cdn.slidesharecdn.com/ss_thumbnails/thu-hsu-190116063619-thumbnail.jpg?width=640&height=640&fit=bounds)
![[台灣人工智慧學校] 從經濟學看人工智慧產業應用](https://cdn.slidesharecdn.com/ss_thumbnails/1-the-application-of-ai-industry-from-economics-190108064940-thumbnail.jpg?width=640&height=640&fit=bounds)
![[台灣人工智慧學校] 台中分校第二期開學典禮 - 執行長報告](https://cdn.slidesharecdn.com/ss_thumbnails/tc2-opening1-compressed-190107034100-thumbnail.jpg?width=640&height=640&fit=bounds)

![[台中分校] 第一期結業典禮 - 執行長談話](https://cdn.slidesharecdn.com/ss_thumbnails/sw-ppt-181217031715-thumbnail.jpg?width=640&height=640&fit=bounds)
![[TOxAIA新竹分校] 工業4.0潛力新應用! 多模式對話機器人](https://cdn.slidesharecdn.com/ss_thumbnails/20181206004-181210031031-thumbnail.jpg?width=640&height=640&fit=bounds)
![[TOxAIA新竹分校] AI整合是重點! 竹科的關鍵轉型思維](https://cdn.slidesharecdn.com/ss_thumbnails/20181206002-181210031031-thumbnail.jpg?width=640&height=640&fit=bounds)
![[TOxAIA新竹分校] 2019 台灣數位轉型與產業升級趨勢觀察](https://cdn.slidesharecdn.com/ss_thumbnails/20181206-001-181210031002-thumbnail.jpg?width=640&height=640&fit=bounds)
![[TOxAIA新竹分校] 深度學習與Kaggle實戰](https://cdn.slidesharecdn.com/ss_thumbnails/20181206003-181210031001-thumbnail.jpg?width=640&height=640&fit=bounds)
![[台灣人工智慧學校] Bridging AI to Precision Agriculture through IoT](https://cdn.slidesharecdn.com/ss_thumbnails/hc-2nd-openingai-school-181206104858-thumbnail.jpg?width=640&height=640&fit=bounds)
![[2018 台灣人工智慧學校校友年會] 產業經驗分享: 如何用最少的訓練樣本,得到最好的深度學習影像分析結果,減少一半人力,提升一倍品質 / 李明達](https://cdn.slidesharecdn.com/ss_thumbnails/lee-181130104127-thumbnail.jpg?width=640&height=640&fit=bounds)
![[2018 台灣人工智慧學校校友年會] 啟動物聯網新關鍵 - 未來由你「喚」醒 / 沈品勳](https://cdn.slidesharecdn.com/ss_thumbnails/20181117shengfn-181130083931-thumbnail.jpg?width=640&height=640&fit=bounds)