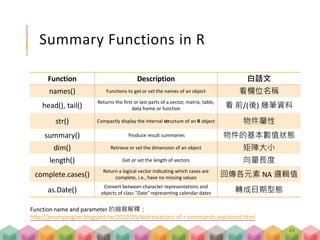
Summary Functions inR
Function Description 白話文
names() Functions to get or set the names of an object 看欄位名稱
head(), tail()
Returns the first or last parts of a vector, matrix, table,
data frame or function 看 前/(後) 幾筆資料
str() Compactly display the internal structure of an R object 物件屬性
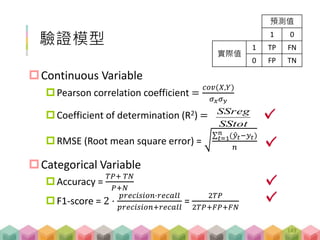
summary() Produce result summaries 物件的基本數值狀態
dim() Retrieve or set the dimension of an object 矩陣大小
length() Get or set the length of vectors 向量長度
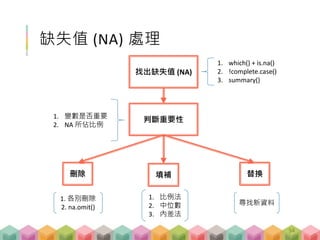
complete.cases()
Return a logical vector indicating which cases are
complete, i.e., have no missing values 回傳各元素 NA 邏輯值
as.Date()
Convert between character representations and
objects of class "Date" representing calendar dates 轉成日期型態
Function name and parameter 的縮寫解釋:
http://jeromyanglim.blogspot.tw/2010/05/abbreviations-of-r-commands-explained.html
48
48.
Visualization Functions inR
Function Description 白話文
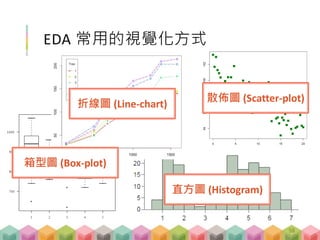
plot() Generic function for plotting of R objects 畫圖 (散布圖 or R object)
boxplot()
Produce box-and-whisker plot(s) of the given
(grouped) values 盒鬚圖
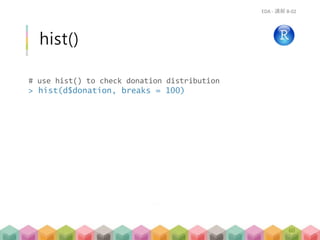
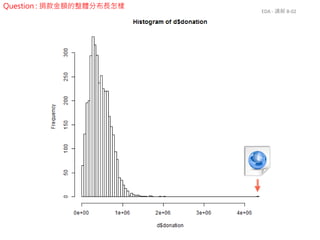
hist() Computes a histogram of the given data values 分布圖
barplot()
Creates a bar plot with vertical or horizontal
bars 長條圖
arrows() Draw arrows between pairs of points 加箭頭 (x0, y0, x1, y1)
abline()
a, b: the intercept and slope, single values.
y = [A] + [B]x 加一條截距為a, 斜率為b的直線
lines()
Join the corresponding points with line
segments. 折線圖
Function name and parameter 的縮寫解釋:
http://jeromyanglim.blogspot.tw/2010/05/abbreviations-of-r-commands-explained.html
49
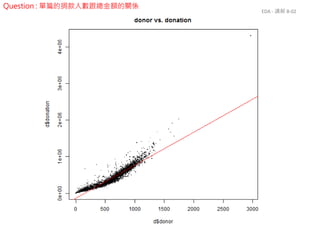
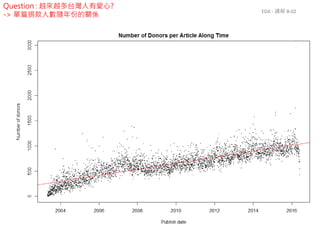
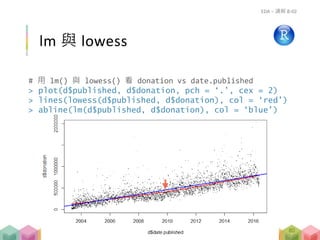
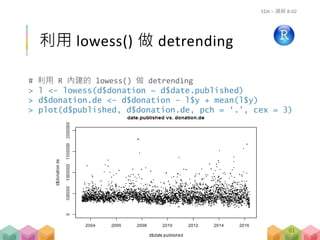
# use plotto check relationship between numbers of donors
and total donation (and draw a linear line)
> plot(d$donor, d$donation, pch = ‘.’, cex = 2)
> y <- lm(donation ~ donor, data = d)
> abline(y, col = ‘red’, lwd = 1.5)
plot()
EDA - 講解 B-02
63
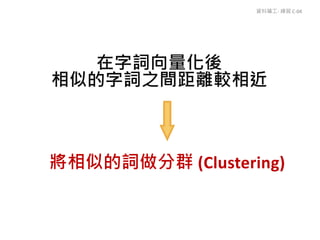
Skip-gram 模型
藉由current word 推測 context words
Neural network model
Stochastic gradient descend (SGD)
112
|V|:詞庫內所有的字詞數量
d :字詞向量化的維度
1 x |V|
0.2
:
:
0.5
:
0.1
0
0
:
1
:
:
0
0
0.1
:
:
0.6
:
0.1
0
:
:
:
:
|V| x d
W
C
d x |V|
C
d x |V|
1 x d
wt
最熱的
Wt-1
夏天
Wt+1
季節
0
:
:
1
:
0
0
0
:
:
1
:
0
0
-
-
112
110.
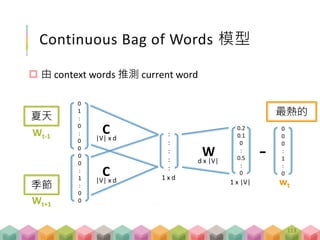
Continuous Bag ofWords 模型
由 context words 推測 current word
113
0.2
0.1
0
:
0.5
:
0
1 x |V|
d x |V|
W
C|V| x d
C|V| x d
:
:
:
:
:
1 x d
0
1
:
0
:
0
0
0
0
:
1
:
0
0
wt
最熱的
Wt-1
夏天
Wt+1
季節
0
0
0
:
1
:
0
-
113
111.
詞向量
訓練結束後,將1 x |V|字詞轉換成 d 維向量的
矩陣
|V| x d
W
|V| x d
1
2
:
i
:
:
|V|
1 2 … … … (d-2) (d-1) d
第 i 個詞的詞向量
114
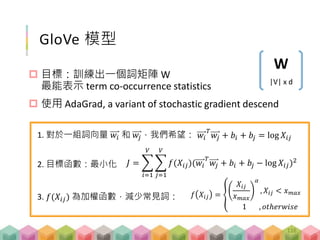
112.
淺談 text2vec
Global corpusstatistics + local window
Count-based method
Term co-occurrence matrix, X
Xij: 詞-i 和詞-j 共同出現次數
最熱的夏天 季節
Word,wt
Context words
Wt-1 Wt+1
1
2
⁞
i
⁞
|V|
1 … j … k … |V|
最熱的
夏
天
季
節
+1
Term Co-occurrence Matrix
+1
115


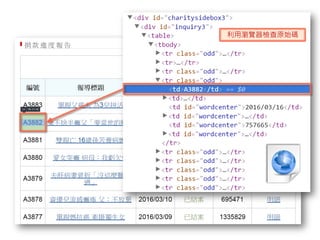

![XPath: a path of XML Tree
標記 意義
/ 選取某標籤的根節點
// 選取某標籤所有節點
[@] 選取屬性 (attribute)
* 任何標籤的節點
| OR
15](https://image.slidesharecdn.com/sessionallto-160904010419/85/R-15-320.jpg)
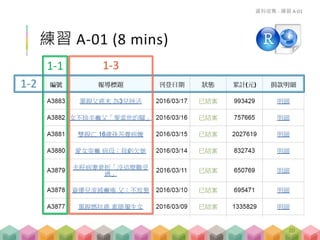
![Xpath = “//*[@id=‘inquiry3’]/table//tr[4]/td[1]”](https://image.slidesharecdn.com/sessionallto-160904010419/85/R-16-320.jpg)
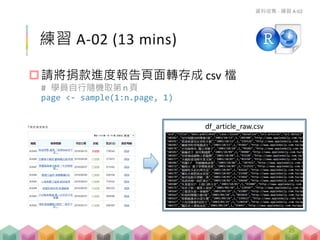
![讀取網頁資訊 (pkg xml2)
library(xml2)
# set your target url
doc <- read_html(url)
# set the xpath of info needed
xpath <- “//*[@id=‘inquiry3’]/table//tr[4]/td[1]”
xml_text(xml_find_all(doc, xpath))
資料收集 - 講解 A-01
17](https://image.slidesharecdn.com/sessionallto-160904010419/85/R-17-320.jpg)


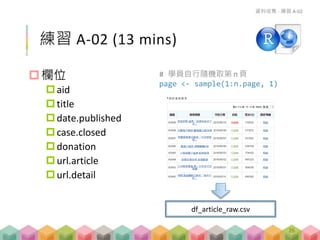
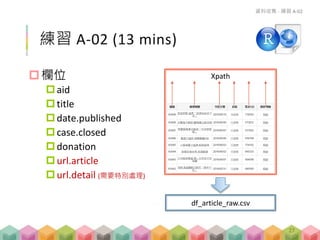
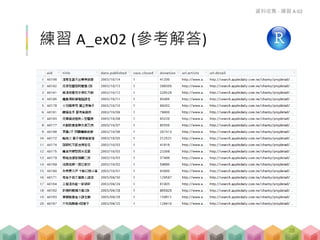
![練習 A_ex01 (參考解答)
請觀察網頁,寫出可以擷取正確資訊的 Xpath
1-1: 編號:"//*[@id='inquiry3']/table//tr/td[1]"
1-2: 欄位名稱: "//*[@id='inquiry3']//tr[2]/th"
1-3: 捐款明細連結:"//*[@id='inquiry3']//tr/td[6]/a"
bonus: 共計頁數: "//*[@id='charity_day']"
資料收集 - 練習 A-01
23](https://image.slidesharecdn.com/sessionallto-160904010419/85/R-22-320.jpg)


![Visualization Functions in R
Function Description 白話文
plot() Generic function for plotting of R objects 畫圖 (散布圖 or R object)
boxplot()
Produce box-and-whisker plot(s) of the given
(grouped) values 盒鬚圖
hist() Computes a histogram of the given data values 分布圖
barplot()
Creates a bar plot with vertical or horizontal
bars 長條圖
arrows() Draw arrows between pairs of points 加箭頭 (x0, y0, x1, y1)
abline()
a, b: the intercept and slope, single values.
y = [A] + [B]x 加一條截距為a, 斜率為b的直線
lines()
Join the corresponding points with line
segments. 折線圖
Function name and parameter 的縮寫解釋:
http://jeromyanglim.blogspot.tw/2010/05/abbreviations-of-r-commands-explained.html
49](https://image.slidesharecdn.com/sessionallto-160904010419/85/R-48-320.jpg)
![session_B_eda.R
讀入資料與看一看變數
# load in apple daily article
> d <- read.csv(“df_article.csv”, fileEncoding =
“utf-8”)
# use dim() to know data frame dimension
> dim(d)
[1] 3779 12
# check the column names
> names(d)
[1] "aid" "case.closed" "date.funded" "date.published"
[5] "donation" "donor" "journalist" "n.image" "n.word"
[10] "title" "url.article" "url.detail"
EDA - 講解 B-02
50](https://image.slidesharecdn.com/sessionallto-160904010419/85/R-49-320.jpg)


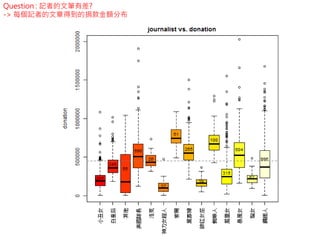
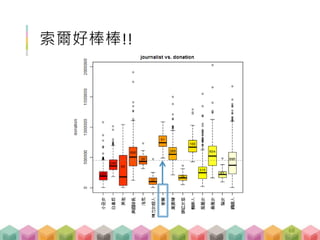
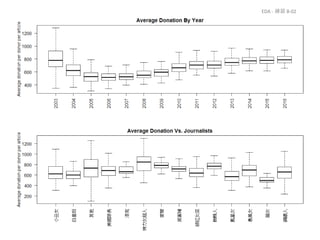
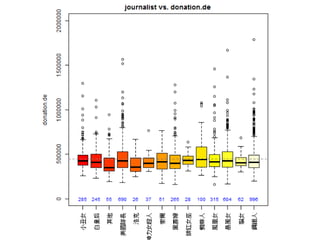
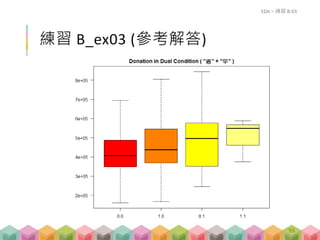
![# check received donation of each journalist
> n <- length(unique(d$journalist))
> b <- boxplot(d$donation ~ d$journalist, col =
heat.colors(n), las = 2, ylim = c(0,2e6))
> abline(h = mean(d$donation), lty = 2, cex = 2)
> text(1:n, (b$stats[3,]+b$stats[4,])/2, b$n, cex =
0.8)
boxplot()
EDA - 講解 B-02
66](https://image.slidesharecdn.com/sessionallto-160904010419/85/R-65-320.jpg)


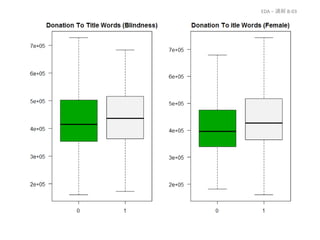
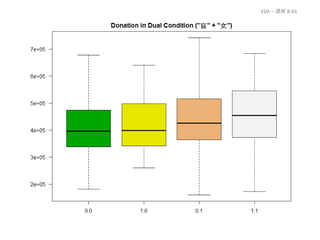
![i <- grep('夫|父|男|翁|公|爸|漢', d$title)
d$ttl.male <- 0
d[i, ]$ttl.male <- 1
i <- grep('妻|母|女|婆|嬤|媽|婦', d$title)
d$ttl.female <- 0
d[i, ]$ttl.female <- 1
i <- grep('憂', d$title)
d$ttl.anxiety <- 0
d[i, ]$ttl.anxiety <- 1
i <- grep('瞎|盲|失明', d$title)
d$ttl.eye <- 0
d[i, ]$ttl.eye <- 1
找出標題內的資訊
EDA – 講解 B-03
88](https://image.slidesharecdn.com/sessionallto-160904010419/85/R-85-320.jpg)


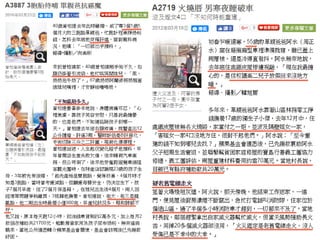


![
$A2719
[1] "火燒厝 男寒夜睡破車初春乍暖還寒,55歲的單親爸
爸阿水(周正水)窩在報廢廂型車裡準備就寢,雖已蓋上兩
層被,還是冷得直發抖。阿水無奈地說,去年底住處鐵皮屋
慘遭祝融,「現在我最擔心的,是住校讀高二兒子放假回來
沒地方睡。」多年來,單親爸爸阿水靠著山區林務零工掙錢
撫養17歲的獨生子小傑,去年12月中,住處鐵皮屋被無名
火燒毀,家當付之一炬,並波及隔壁姪女一家,「害姪女一
家4口沒地方住,很對不起他們。」阿水說:「至今重建的
錢不知到哪兒去找?」蘋果基金會獲悉後,已先撥款襄助阿
水父子短期生活窘迫,並聯繫幫貧困家庭修屋的寶島行善義
工團協力修繕,義工團評估,兩屋重建材料費用約需70萬元
。當地村長說,目前已有縣府補助款共20萬元。疑老舊電線
走火望著火場殘垣灰燼,阿火說,那天傍晚,他結束工作返
家,一進門,便見屋後廚房濃煙不斷竄出,急忙打電話叫消
防隊,住家位於偏遠山區,過了半個多小時消防車才趕到,
一切都來不及了。當地村長說,鄰居趕緊拿出自家滅火器幫
忙滅火,但當天風勢強助長火舌,用掉20多個滅火器卻沒用
,「火災鑑定是老舊電線走火,沒人受傷已是不幸中的大幸
。」姪女家境也不好阿水33歲的姪女阿菁說,她與33歲的
丈夫阿元育有6歲、4歲的子女,平時她在家帶孩子,家計由
阿元打零工維持,日子只能勉強餬口。火災當時,「聽到外
面有人叫『失火了』,我趕緊拉著兩個孩子往外衝。」阿菁
說,目前一家暫住附近大伯家,屋子太小,只能在客廳打地
舖,「我也知道二伯阿水沒錢,我們手頭也不寬裕,不知何
時房子才能重建。」阿水說,他現暫時睡在報廢廂型車中,
並在車外搭上帆布充當煮飯、作息空間,向鄰居借廁所大小
便、洗澡。「住在車裡,就當作野外露營,前幾波寒流來時
,整晚冷到睡不著,春節也只能在哥哥家裡過。」阿水17歲
的兒子小傑說:「車子空間小,我短期可借住同學家,久了
不好意思。」"
資料礦工- 講解 C-01
103](https://image.slidesharecdn.com/sessionallto-160904010419/85/R-100-320.jpg)
![# get all article names
> files =
list.files('data/db_articles_txt/db_articles_txt/',
pattern = ‘txt', full.names = T)
> file.name = gsub('.txt', '' ,basename(files))
# read the first 100 articles
> file.len = 100
> article_txt = list()
> for(i in 1:file.len) {
a = readLines(files[i], encoding = ‘UTF-8’)
article_txt[[file.name[i]]] = paste(a, collapse =‘’)
}
# check if all are correctly read in
> fivenum(nchar(article_txt))
讀入蘋果暖流文章
資料礦工- 講解 C-01
session_C_01_separate_words.R
104](https://image.slidesharecdn.com/sessionallto-160904010419/85/R-101-320.jpg)
![$A2719
[1] "火燒厝 男寒夜睡破車初春乍暖還寒,55歲的單親爸爸阿水(周正水)窩在報廢廂型車裡準備就寢,雖已蓋上兩層被,
還是冷得直發抖。阿水無奈地說,去年底住處鐵皮屋慘遭祝融,「現在我最擔心的,是住校讀高二兒子放假回來沒地方睡。」
多年來,單親爸爸阿水靠著山區林務零工掙錢撫養17歲的獨生子小傑,去年12月中,住處鐵皮屋被無名火燒毀,家當付之一炬
,並波及隔壁姪女一家,「害姪女一家4口沒地方住,很對不起他們。」阿水說:「至今重建的錢不知到哪兒去找?」蘋果基
金會獲悉後,已先撥款襄助阿水父子短期生活窘迫,並聯繫幫貧困家庭修屋的寶島行善義工團協力修繕,義工團評估,兩屋重
建材料費用約需70萬元。當地村長說,目前已有縣府補助款共20萬元。疑老舊電線走火望著火場殘垣灰燼,阿火說,那天傍晚
,他結束工作返家,一進門,便見屋後廚房濃煙不斷竄出,急忙打電話叫消防隊,住家位於偏遠山區,過了半個多小時消防車
才趕到,一切都來不及了。當地村長說,鄰居趕緊拿出自家滅火器幫忙滅火,但當天風勢強助長火舌,用掉20多個滅火器卻沒
用,「火災鑑定是老舊電線走火,沒人受傷已是不幸中的大幸。」姪女家境也不好阿水33歲的姪女阿菁說,她與33歲的丈夫阿
元育有6歲、4歲的子女,平時她在家帶孩子,家計由阿元打零工維持,日子只能勉強餬口。火災當時,「聽到外面有人叫『失
火了』,我趕緊拉著兩個孩子往外衝。」阿菁說,目前一家暫住附近大伯家,屋子太小,只能在客廳打地舖,「我也知道二伯
阿水沒錢,我們手頭也不寬裕,不知何時房子才能重建。」阿水說,他現暫時睡在報廢廂型車中,並在車外搭上帆布充當煮飯
、作息空間,向鄰居借廁所大小便、洗澡。「住在車裡,就當作野外露營,前幾波寒流來時,整晚冷到睡不著,春節也只能在
哥哥家裡過。」阿水17歲的兒子小傑說:「車子空間小,我短期可借住同學家,久了不好意思。」"
[1] "火燒" "厝" "男" "寒夜" "睡" "破車" "初春" "乍暖還寒" "55" "歲" "的" "單親" "爸爸“
[14] "阿水" "周正" "水" "窩" "在" "報廢" "廂型" "車裡" "準備" "就寢" "雖" "已" "蓋"
[27] "上" "兩層" "被" "還是" "冷得" "直發抖" "阿水" "無奈" "地說" "去年底" "住處" "鐵皮屋" "慘遭"
[40] "祝融" "現在" "我" "最" "擔心" "的" "是" "住校" "讀高二" "兒子" "放假" "回來" "沒"
[53] "地方" "睡" "多" "年來" "單親" "爸爸" "阿水靠" "著" "山區" "林務" "零工" "掙錢" "撫養"
[66] "17" "歲" "的" "獨生子" "小傑" "去年" "12" "月" "中" "住處" "鐵皮屋" "被" "無名"
[79] "火燒" "毀" "家當" "付之一炬" "並" "波及" "隔壁" "姪" "女" "一家" "害" "姪" "女"
[92] "一家" "4" "口" "沒" "地方" "住" "很" "對不起" "他們" "阿" "水" "說" "至今"
[105] "重建" "的" "錢" "不知" "到" "哪兒" "去找" "蘋果" "基金會" "獲悉" "後" "已先" "撥款"
[118] "襄助" "阿水" "父子" "短期" "生活" "窘迫" "並" "聯繫" "幫" "貧困家庭" "修屋" "的" "寶島"
[131] "行善" "義工" "團" "協力" "修繕" "義工" "團" "評估" "兩屋" "重建" "材料" "費用" "約"
[144] "需" "70" "萬元" "當地" "村長" "說" "目前" "已有" "縣府" "補助款" "共" "20" "萬元"
[157] "疑老舊" "電線走火" "望著" "火場" "殘垣" "灰燼" "阿火" "說" "那天" "傍晚" "他" "結束" "工作"
[170] "返家" "一" "進門" "便" "見" "屋後" "廚房" "濃煙" "不斷" "竄出" "急忙" "打電話" "叫"
[183] "消防隊" "住家" "位於" "偏遠" "山區" "過了" "半個" "多" "小時" "消防車" "才" "趕到" "一切"
[196] "都" "來不及" "了" "當地" "村長" "說" "鄰居" "趕緊" "拿出" "自家" "滅火器" "幫忙" "滅火"
105](https://image.slidesharecdn.com/sessionallto-160904010419/85/R-102-320.jpg)


![# calculate unit vector
> word.vec.norm = sqrt(rowSums(word.vec^2))
# build the function
> get_analogy = function(king, man, woman) {
queen = word.vec[king, , drop = F] –
word.vec[man, , drop = F] +
word.vec[woman, , drop = F]
cos.dist = text2vec:::cosine(queen,
word.vec, word.vec.norm)
head(sort(cos.dist[1, ], decreasing = T,10)
}
get_analogy
資料礦工- 練習 C-03
session_C_03_get_analogy.R
124](https://image.slidesharecdn.com/sessionallto-160904010419/85/R-119-320.jpg)


![k = 200
donor.de vs k133 (死亡用詞), cor = 0.203
donor.de vs k180 (食物用詞), cor = 0.1008
> w[w$k == 133,]$V1
[1] "走(Vi)" "病逝(Vi)" "逝(Vi)" "留下(Vt)" "死(Vi)" "去世(Vi)" "生前(N)" "喪葬(N)" "喪葬費(N)" "往生(Vi)"
[11] "猝(ADV)" "交代(Vt)" "後事(N)" "留(Vt)" "驟(ADV)" "心肌(N)" "梗塞(Vi)" "來不及(ADV)" "身亡(Vi)" "悲傷(Vi)"
[21] "喪夫(Vi)" "喪事(N)" "遺照(N)" "送走(Vt)" "突然(Vi)" "出殯(Vi)" "辦妥(Vt)" "靈堂(N)" "猝死(Vi)" "喪子(Vi)"
[31] "程(N)" "國民(N)" "不敵(Vt)" "白髮人(N)" "黑髮人(N)" "臨終(Vi)" "病故(Vi)" "含淚(Vi)" "溺斃(Vi)" "辦好(Vt)"
[41] "撒手(Vi)" "遺體(N)" "辭世(Vi)" "老幼(N)" "人世(N)" "辦完(Vt)" "斷氣(Vi)" "殯儀館(N)" "冰櫃(N)" "悲慟(Vi)"
[51] "桂圓(N)" "奠儀(N)" "睡夢(N)" "繼(P)" "葬儀社(N)" "離世(Vi)" "紙錢(N)" "再見(Vi)" "黑髮(N)" "平復(Vt)"
[61] "小晟(N)" "喪禮(N)" "林美琴(N)" "遺言(N)" "棺木(N)" "葬(Vt)" "積勞成疾(Vi)" "遽逝(Vi)" "享年(Vt)" "陳芷涵(N)"
[71] "孤(Vi)" "安葬(Vt)" "永隔(N)" "杜氏(N)" "火化(Vt)" "薛(N)" "葉榮進(N)" "含悲(Vi)" "悲痛(Vi)" "遺書(N)"
[81] "處理完(Vt)" "周麗珠(N)" "江鎧安(N)" "莫惠萍(N)" "自焚(Vi)" "莊台(N)" "阿治(N)" "李瑪美(N)" "忠正(N)" "悲(Vi)"
> w[w$k == 180,]$V1
[1] "吃(Vt)" "餐(M)" "飯(N)" "晚餐(N)" "煮(Vt)" "便當(N)" "青菜(N)" "餓(Vi)" "省錢(Vi)" "配(Vt)"
[11] "罐頭(N)" "飯菜(N)" "泡麵(N)" "早餐(N)" "稀飯(N)" "炒(Vt)" "熱(Vt)" "白飯(N)" "麵(N)" "肉(N)"
[21] "餓肚子(Vi)" "飽(Vi)" "包(M)" "鍋(M)" "碗(M)" "拌(Vt)" "果腹(Vi)" "粥(N)" "碗(N)" "吃飽(Vi)"
[31] "瓶(M)" "頓(M)" "好吃(Vi)" "吃完(Vt)" "一口(ADV)" "蛋(N)" "醬油(N)" "麵包(N)" "湯(N)" "加菜(Vi)"
[41] "餐桌(N)" "道(M)" "鍋(N)" "樣(M)" "麵線(N)" "煎(Vt)" "剩菜(N)" "饅頭(N)" "弄(Vt)" "麵條(N)"
[51] "開水(N)" "澆(Vt)" "鹹(Vi)" "填飽(Vt)" "煮好(Vt)" "鹽(N)" "肉鬆(N)" "炒飯(N)" "盤(M)" "蛋炒飯(N)"
[61] "加熱(Vi)" "荷包蛋(N)" "苦瓜(N)" "吃到(Vt)" "水餃(N)" "營養(Vi)" "滷肉(N)" "豆漿(N)" "菜色(N)" "年夜飯(N)"
[71] "放進(Vt)" "自助餐(N)" "省下來(Vi)" "扒(Vt)" "舀(Vt)" "吃剩(Vi)" "醬瓜(N)" "餓死(Vt)" "打發(Vt)" "蒸(Vt)"
[81] "充飢(Vi)" "燙(Vt)" "滷(Vt)" "菜肉(N)" "匙(M)" "攪拌(Vt)" "絲瓜(N)" "會兒(N)" "豆腐(N)" "配上(Vt)"
[91] "罐(N)" "飯桌(N)" "包子(N)" "白開水(N)" "津津有味(Vi)" "食量(N)" "吐司(N)" "熱騰騰(Vi)" "醬菜(N)" "用餐(Nv)"
[101] "填(Vt)" "湯汁(N)" "配飯(N)" "吃光(Vt)" "大鍋(N)" "菜葉(N)" "湯麵(N)" "午飯(N)" "食欲(N)" "菜湯(N)"
資料礦工- 練習 C-04
139](https://image.slidesharecdn.com/sessionallto-160904010419/85/R-127-320.jpg)


![資料欄位
# read in the data
load('data/w2v_name_clustering(k=200).Rdata')
# subset the column by names
ch <- which(sapply(d, is.factor))
ttl<- names(d)[grep("^ttl", colnames(d))]
fb <- names(d)[grep("fb", colnames(d))]
kg <- names(d)[grep('^g', names(d))]
time <- names(d)[grep('day|month', names(d))]
yns <- names(d)[grep('^don', names(d))]
rest <- names(d)[!names(d)%in%c(ttl, fb, k, kg, yns,
time)]
預測模型 - 講解 D-01
154](https://image.slidesharecdn.com/sessionallto-160904010419/85/R-138-320.jpg)

![Decision Tree
set.seed(904) # Control random sample
sample_index <- sample(1:nrow(data), nrow(data) * 0.95)
dta_trn <- data[sample_index, ]
dta_tst <- data[-sample_index, ]
dt.fit <- rpart(form, data=dta_trn)
printcp(dt.fit)
plot(dt.fit, uniform=T)
text(dt.fit, use.n=T, cex=0.75)
pred <- predict(dt.fit, newdata = dta_tst)
預測模型 – 講解 D-01
157](https://image.slidesharecdn.com/sessionallto-160904010419/85/R-141-320.jpg)


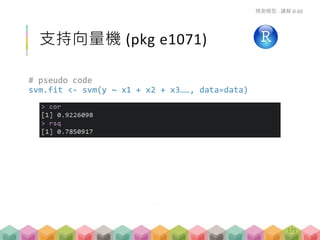
![Cross Validation
# leave-One-Out
i <- 1
testing <- d1[i, c(yn, x.ttl, x.fb, x.t, x.k, x.g)]
training <- d1[-i, c(yn, x.ttl, x.fb, x.t, x.k, x.g)]
svm.fit <- svm(form, data = training)
p <- predict(fit, testing)
c(testing[, yn], p)
預測模型 - 講解 D-03
173](https://image.slidesharecdn.com/sessionallto-160904010419/85/R-157-320.jpg)


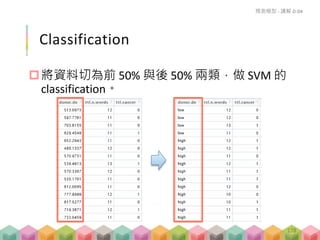


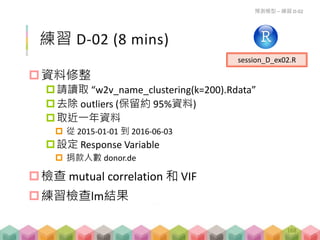
![練習 D-04 (解答)
將資料切為前 25% 與最後 25% 兩類,做 SVM
的 classification 後,計算 accuracy 與 F1-score。
# 切 upper / lower classes
quantile(d1[, yn], c(0.25, 0.75))[c("25%", "75%")]
預測模型 – 練習 D-04
session_D_ex04.R
182](https://image.slidesharecdn.com/sessionallto-160904010419/85/R-166-320.jpg)


![[系列活動] 手把手教你R語言資料分析實務](https://cdn.slidesharecdn.com/ss_thumbnails/stepbystepr20170114-170113030702-thumbnail.jpg?width=640&height=640&fit=bounds)


![[系列活動] 手把手打開Python資料分析大門](https://cdn.slidesharecdn.com/ss_thumbnails/python-171213042421-thumbnail.jpg?width=640&height=640&fit=bounds)


