Download as ODP, PPTX

![JSON
{
"employees": [
{ "firstName":"John" , "lastName":"Doe" },
{ "firstName":"Anna" , "lastName":"Smith" },
{ "firstName":"Peter" , "lastName":"Jones" }
]
}
Source: http://www.w3schools.com/json/json_syntax.asp](https://image.slidesharecdn.com/bigdataanalytics-140328102200-phpapp02/85/Big-Data-Analytics-Introduction-21-320.jpg)
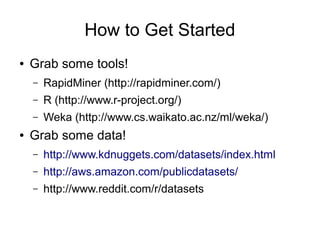
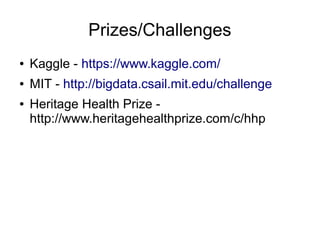

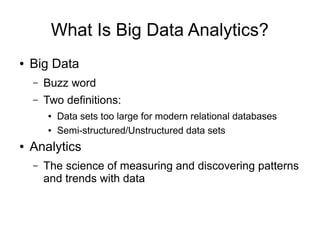
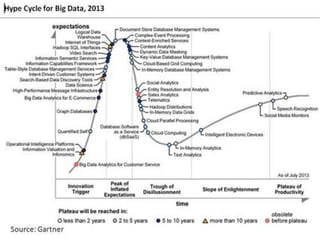
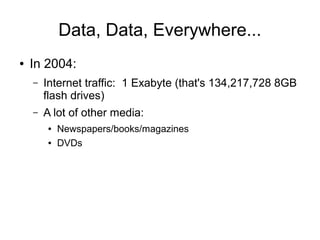
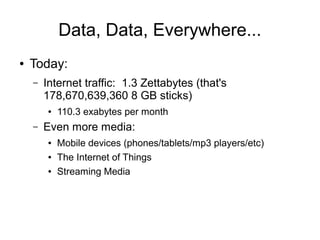
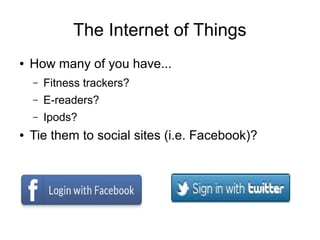
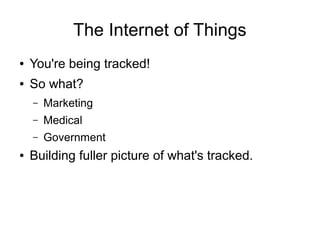
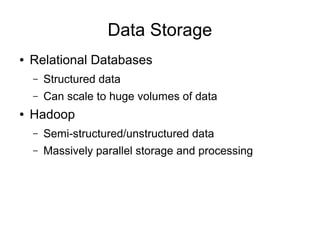
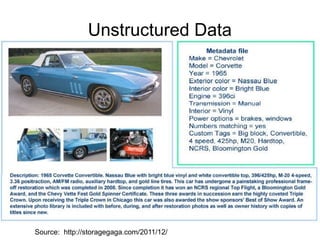
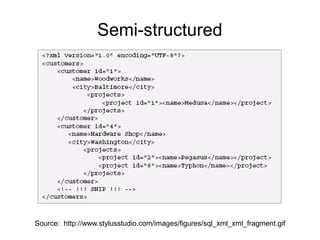
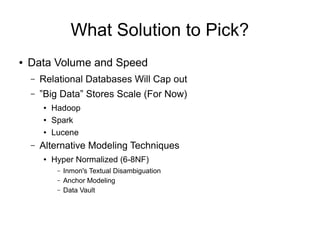
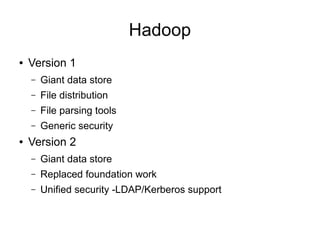
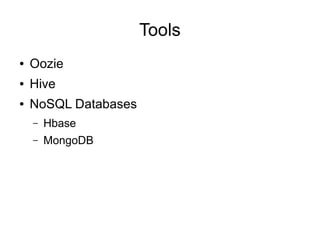
The document discusses big data analytics, defining big data as large, semi-structured or unstructured data sets beyond the capacity of traditional relational databases. It highlights the exponential growth of internet traffic and the rise of the Internet of Things, emphasizing the implications for marketing, medical applications, and government tracking. Various tools and solutions for managing and analyzing big data, including Hadoop, Spark, and NoSQL databases, are also mentioned, along with resources for getting started with data analytics.


![Getting Started with Apache Spark: Big Data Made Simple [Free Meetup]](https://cdn.slidesharecdn.com/ss_thumbnails/apachesparkgettingstarted-260203175547-8361bcc3-thumbnail.jpg?width=640&height=640&fit=bounds)


