Download as PDF, PPTX

![Big Data – How we got here
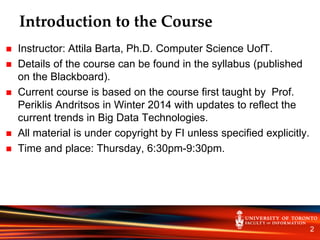
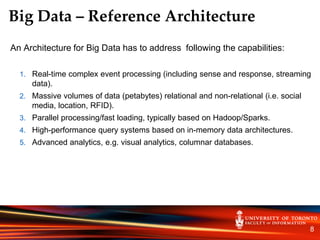
In a 2001 research report[1] Gartner analyst Doug Laney defined data growth challenges and
opportunities as being three-dimensional, i.e. increasing volume (amount of data), velocity
(speed of data in and out), and variety (range of data types and sources). Gartner, and now
much of the industry, continue to use this "3Vs" model for describing Big Data[2]. (Wikipedia).
What was happening in 2001? Three major trends:
Sloan Digital Sky Survey began collecting astronomical data in 2000 at a rate of 200GB/night – volume
Sensor networks (web of things) and streaming databases (Message Oriented Middleware) – velocity
Semi-structured databases, XML native databases beside object-oriented, relational databases – variety
What happened after 2001?
Rise of search engines and portals - Yahoo and Google:
Problem: how to store and query (cheaply large amounts of (semi-structured) data.
Answer: Hadoop on commodity Linux farms.
Memory got cheaper – in-memory data grids.
Rise of Social Media – petabytes in pictures, unstructured and semi-structured data.
Increased computational power and large memory – visual analytics.
6](https://image.slidesharecdn.com/588a2516-21d8-4643-a3f9-e8f2717877af-161110203009/85/INF2190_W1_2016_public-6-320.jpg)
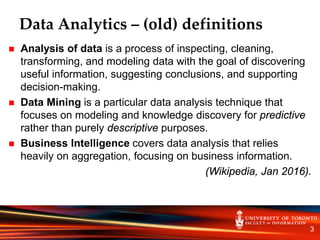
![Big Data – Definitions and Examples
7
•In 2012, Gartner updated its definition as follows: "Big data are high-volume, high-velocity, and/or high-variety
information assets that require new forms of processing to enable enhanced decision making, insight discovery
and process optimization“[3].
• In 2012 IDC defines Big Data technologies as “a new generation of technologies and architectures designed
to extract value economically from very large volumes of a wide variety of data by enabling high-velocity
capture, discovery, and/or analysis”[4].
•In 2012 Forrester characterize Big Data as “increases in data volume, velocity, variety, and variability”[5].
•Big Data Characteristics:
1. Data Volume: data size in order of petabytes.
• Example: Facebook on June 13, 2012 announced that their had reached 100 PB of data. On
November 8, 2012 they announced that their warehouse grows by half a PB per day.
2. Data Velocity: real time processing of streaming data, including real time analytics.
• Example: a jet engine generates 20TB data/hour that has to be processed near real time.
3. Data Variety: structured, semi-structured, text, imagines, video, audio, etc.
• Example: 80% of enterprise data is unstructured. YouTube - 500TB of video uploaded per year
4. Data Variability: data flows can be inconsistent with periodic peaks.
• Example: blogs commenting the new Blackberry 10; stock market data that reacts to market events.](https://image.slidesharecdn.com/588a2516-21d8-4643-a3f9-e8f2717877af-161110203009/85/INF2190_W1_2016_public-7-320.jpg)


This document provides an introduction and overview of the INF2190 - Data Analytics course. It discusses the instructor, Attila Barta, details on where and when the course will take place. It then provides definitions and history of data analytics, discusses how the field has evolved with big data, and references enterprise data analytics architectures. It contrasts traditional vs. big data era data analytics approaches and tools. The objective of the course is described as providing students with the foundation to become data scientists.


![[Bài dạy] cấu trúc rẽ nhánh](https://cdn.slidesharecdn.com/ss_thumbnails/bidycutrcrnhnh-161116071225-thumbnail.jpg?width=640&height=640&fit=bounds)


