Downloaded 48 times

![MapReduce/ Hadoop
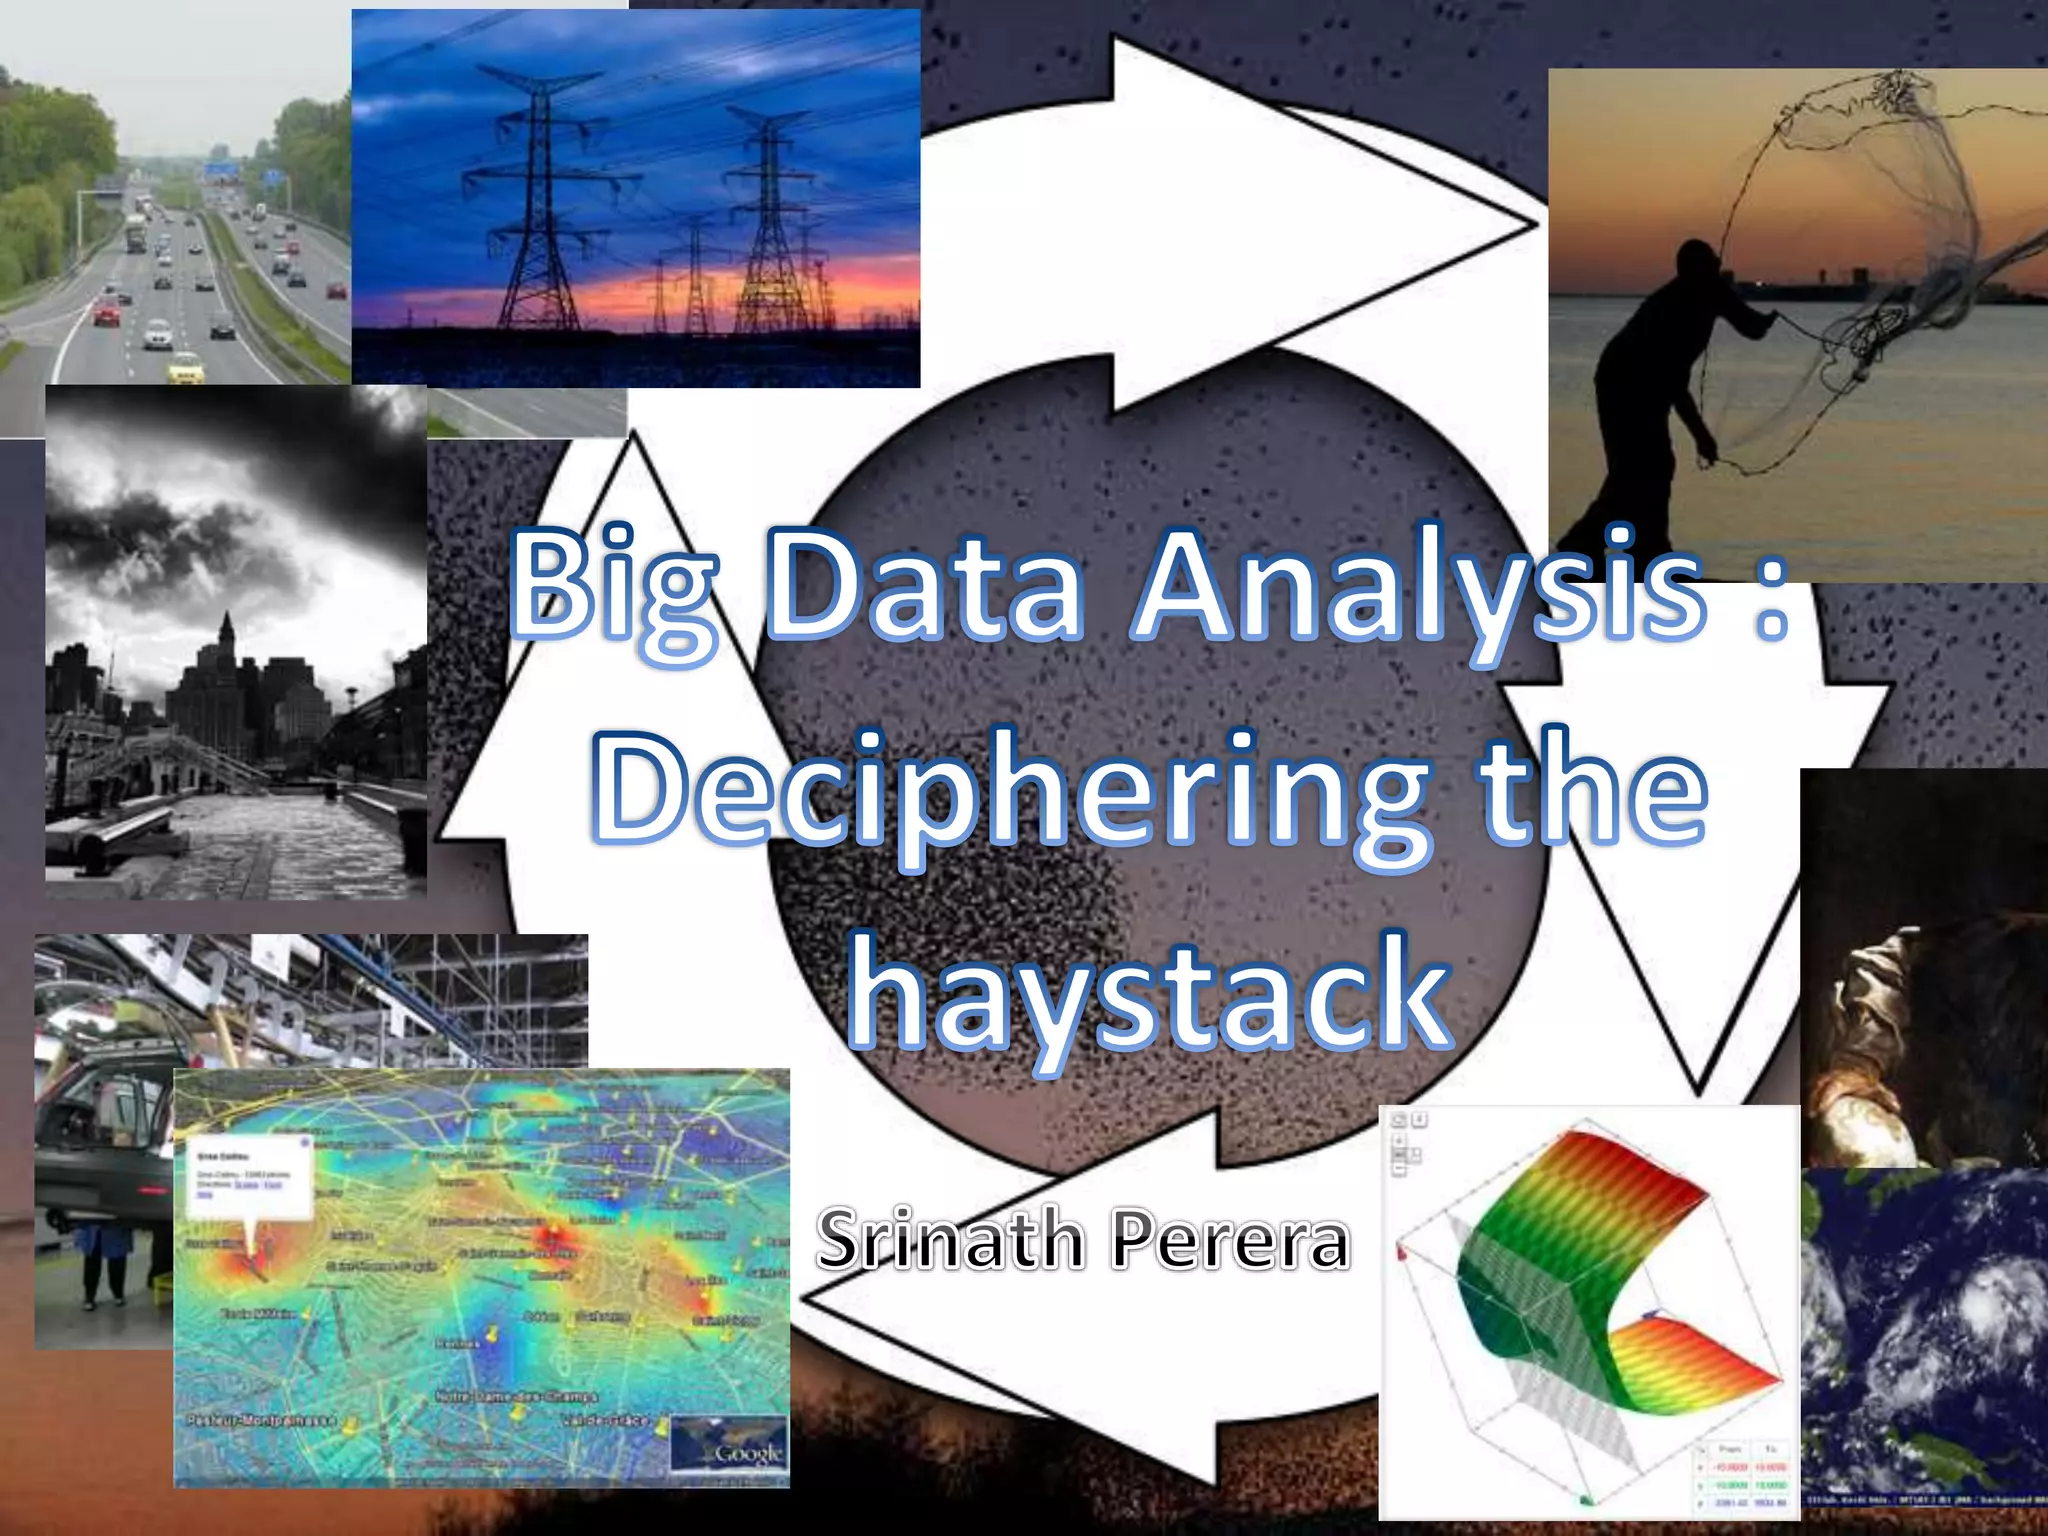
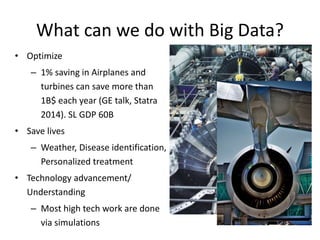
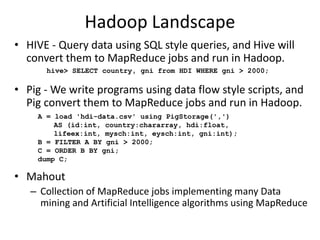
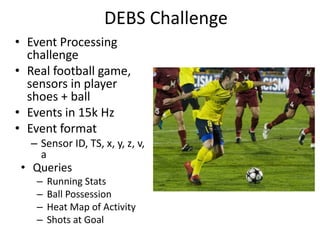
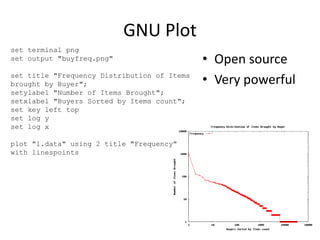
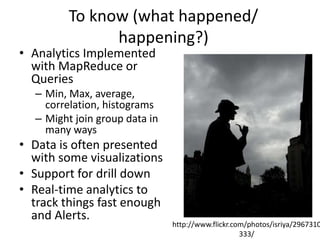
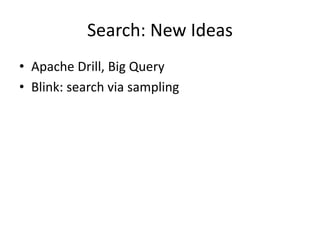
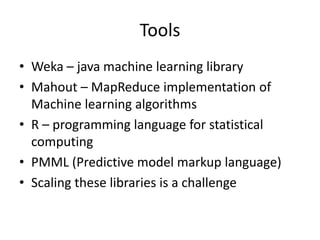
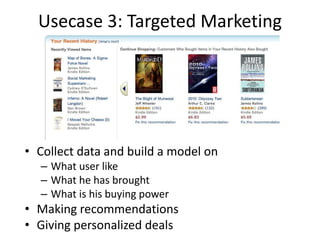
• First introduced by Google,
and used as the processing
model for their architecture
• Implemented by opensource
projects like Apache Hadoop
and Spark
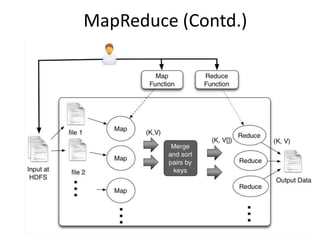
• Users writes two functions:
map and reduce
• The framework handles the
details like distributed
processing, fault tolerance,
load balancing etc.
• Widely used, and the one of
the catalyst of Big data
void map(ctx, k, v){
tokens = v.split();
for t in tokens
ctx.emit(t,1)
}
void reduce(ctx, k, values[]){
count = 0;
for v in values
count = count + v;
ctx.emit(k,count);
}](https://image.slidesharecdn.com/unicombigdata-140322235315-phpapp01/85/Big-Data-Analysis-Deciphering-the-haystack-12-320.jpg)
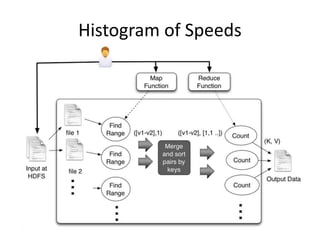
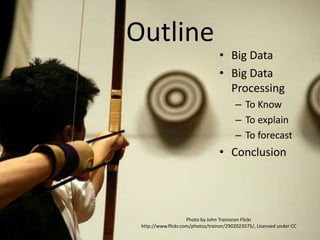
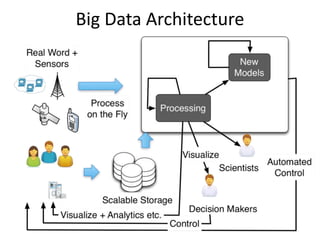
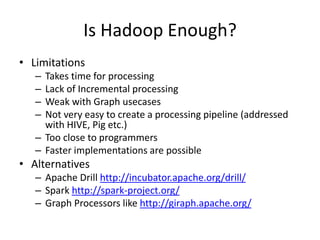
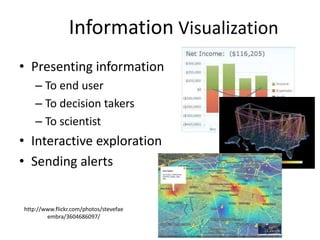
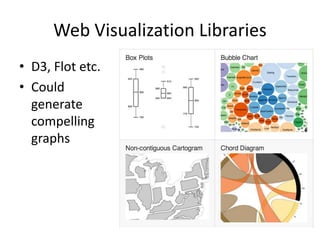
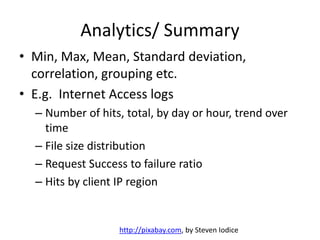
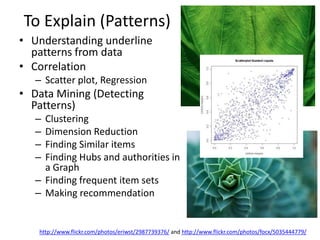
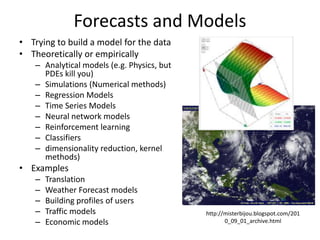
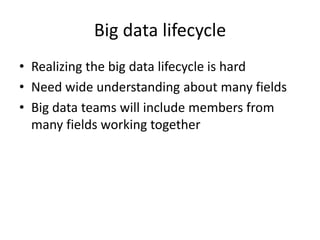
![Histogram of Speeds(Contd.)
void map(ctx, k, v){
event = parse(v);
range = calcuateRange(event.v);
ctx.emit(range,1)
}
void reduce(ctx, k, values[]){
count = 0;
for v in values
count = count + v;
ctx.emit(k,count);
}](https://image.slidesharecdn.com/unicombigdata-140322235315-phpapp01/85/Big-Data-Analysis-Deciphering-the-haystack-15-320.jpg)
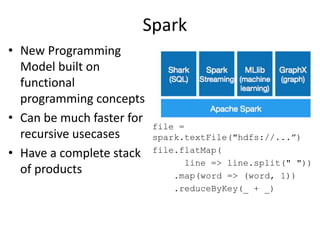
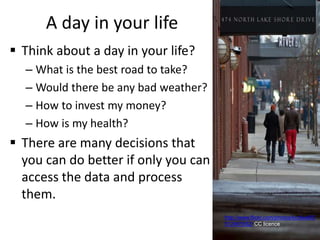
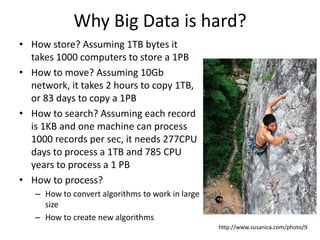
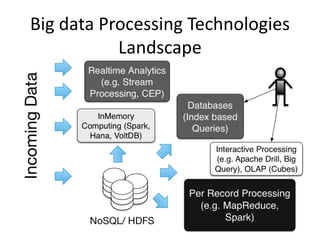
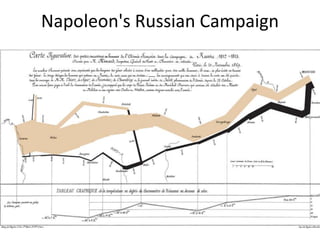
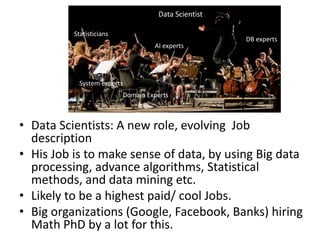
![Complex Event Processing (CEP)
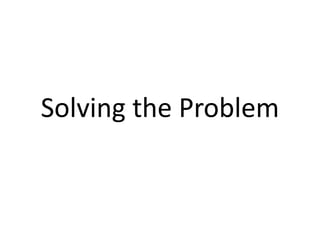
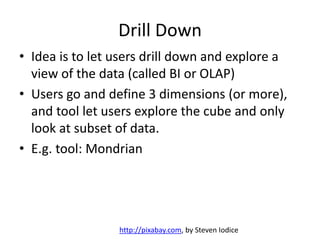
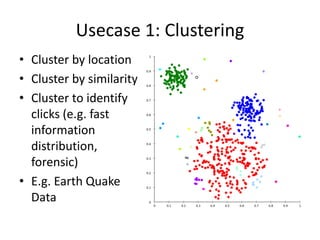
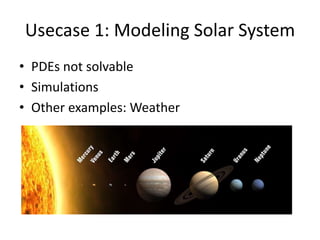
• Sees inputs as Event streams and queried with
SQL like language
• Supports Filters, Windows, Join, Patterns and
Sequences
from p=PINChangeEvents#win.time(3600) join
t=TransactionEvents[p.custid=custid][amount>1000
0] #win.time(3600)
return t.custid, t.amount;](https://image.slidesharecdn.com/unicombigdata-140322235315-phpapp01/85/Big-Data-Analysis-Deciphering-the-haystack-20-320.jpg)
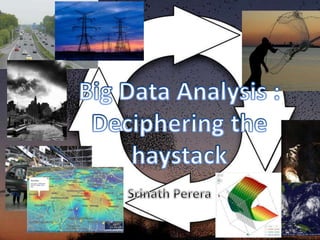
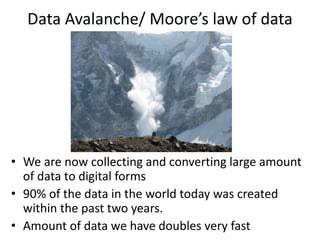
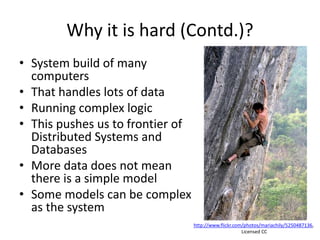
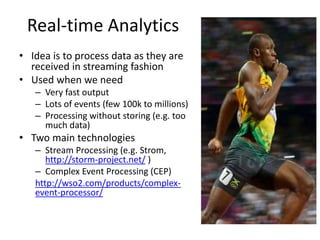
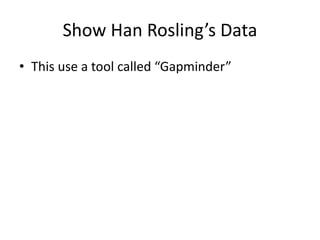
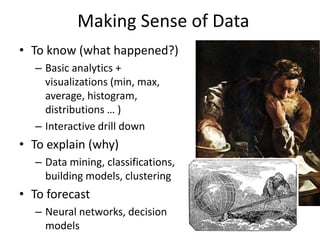
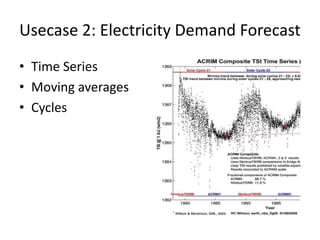
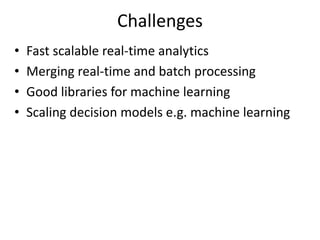
![Example: Detect ball Possession
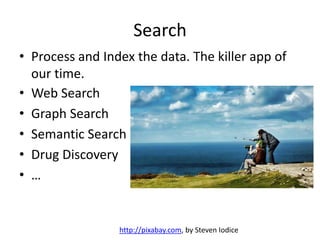
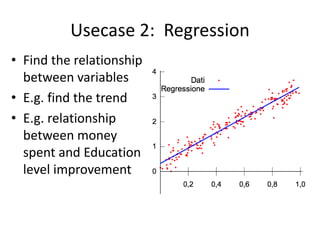
• Possession is time a
player hit the ball
until someone else
hits it or it goes out
of the ground
from Ball#window.length(1) as b join
Players#window.length(1) as p
unidirectional
on debs: getDistance(b.x,b.y,b.z,
p.x, p.y, p.z) < 1000
and b.a > 55
select ...
insert into hitStream
from old = hitStream ,
b = hitStream [old. pid != pid ],
n= hitStream[b.pid == pid]*,
( e1 = hitStream[b.pid != pid ]
or e2= ballLeavingHitStream)
select ...
insert into BallPossessionStream
http://www.flickr.com/photos/glennharper/146164820/](https://image.slidesharecdn.com/unicombigdata-140322235315-phpapp01/85/Big-Data-Analysis-Deciphering-the-haystack-22-320.jpg)


The document discusses big data, emphasizing its significance in optimizing decisions and the complexities of processing vast amounts of data. It covers various technologies like MapReduce and Hadoop, challenges in data storage and processing, and methods for real-time analytics. It concludes with the importance of data scientists and the interdisciplinary efforts required to harness big data effectively.


![[161] 데이터사이언스팀 빌딩](https://cdn.slidesharecdn.com/ss_thumbnails/161-150914054732-lva1-app6891-thumbnail.jpg?width=640&height=640&fit=bounds)