Downloaded 1,145 times
![Storing Data
• Historically we used databases
– Scale is a challenge: replication,
sharding
• Scalable options
– NoSQL (Cassandra, Hbase) [If
data is structured]
• Column families Gaining Ground
– Distributed file systems (e.g.
HDFS) [If data is unstructured]
• New SQL
– In Memory computing, VoltDB
• Specialized data structures
– Graph Databases, Data structure
servers http://www.flickr.com/photos/keso/3631339
67/](https://image.slidesharecdn.com/bigdata-130517055839-phpapp01/75/Introduction-to-Big-Data-22-2048.jpg)
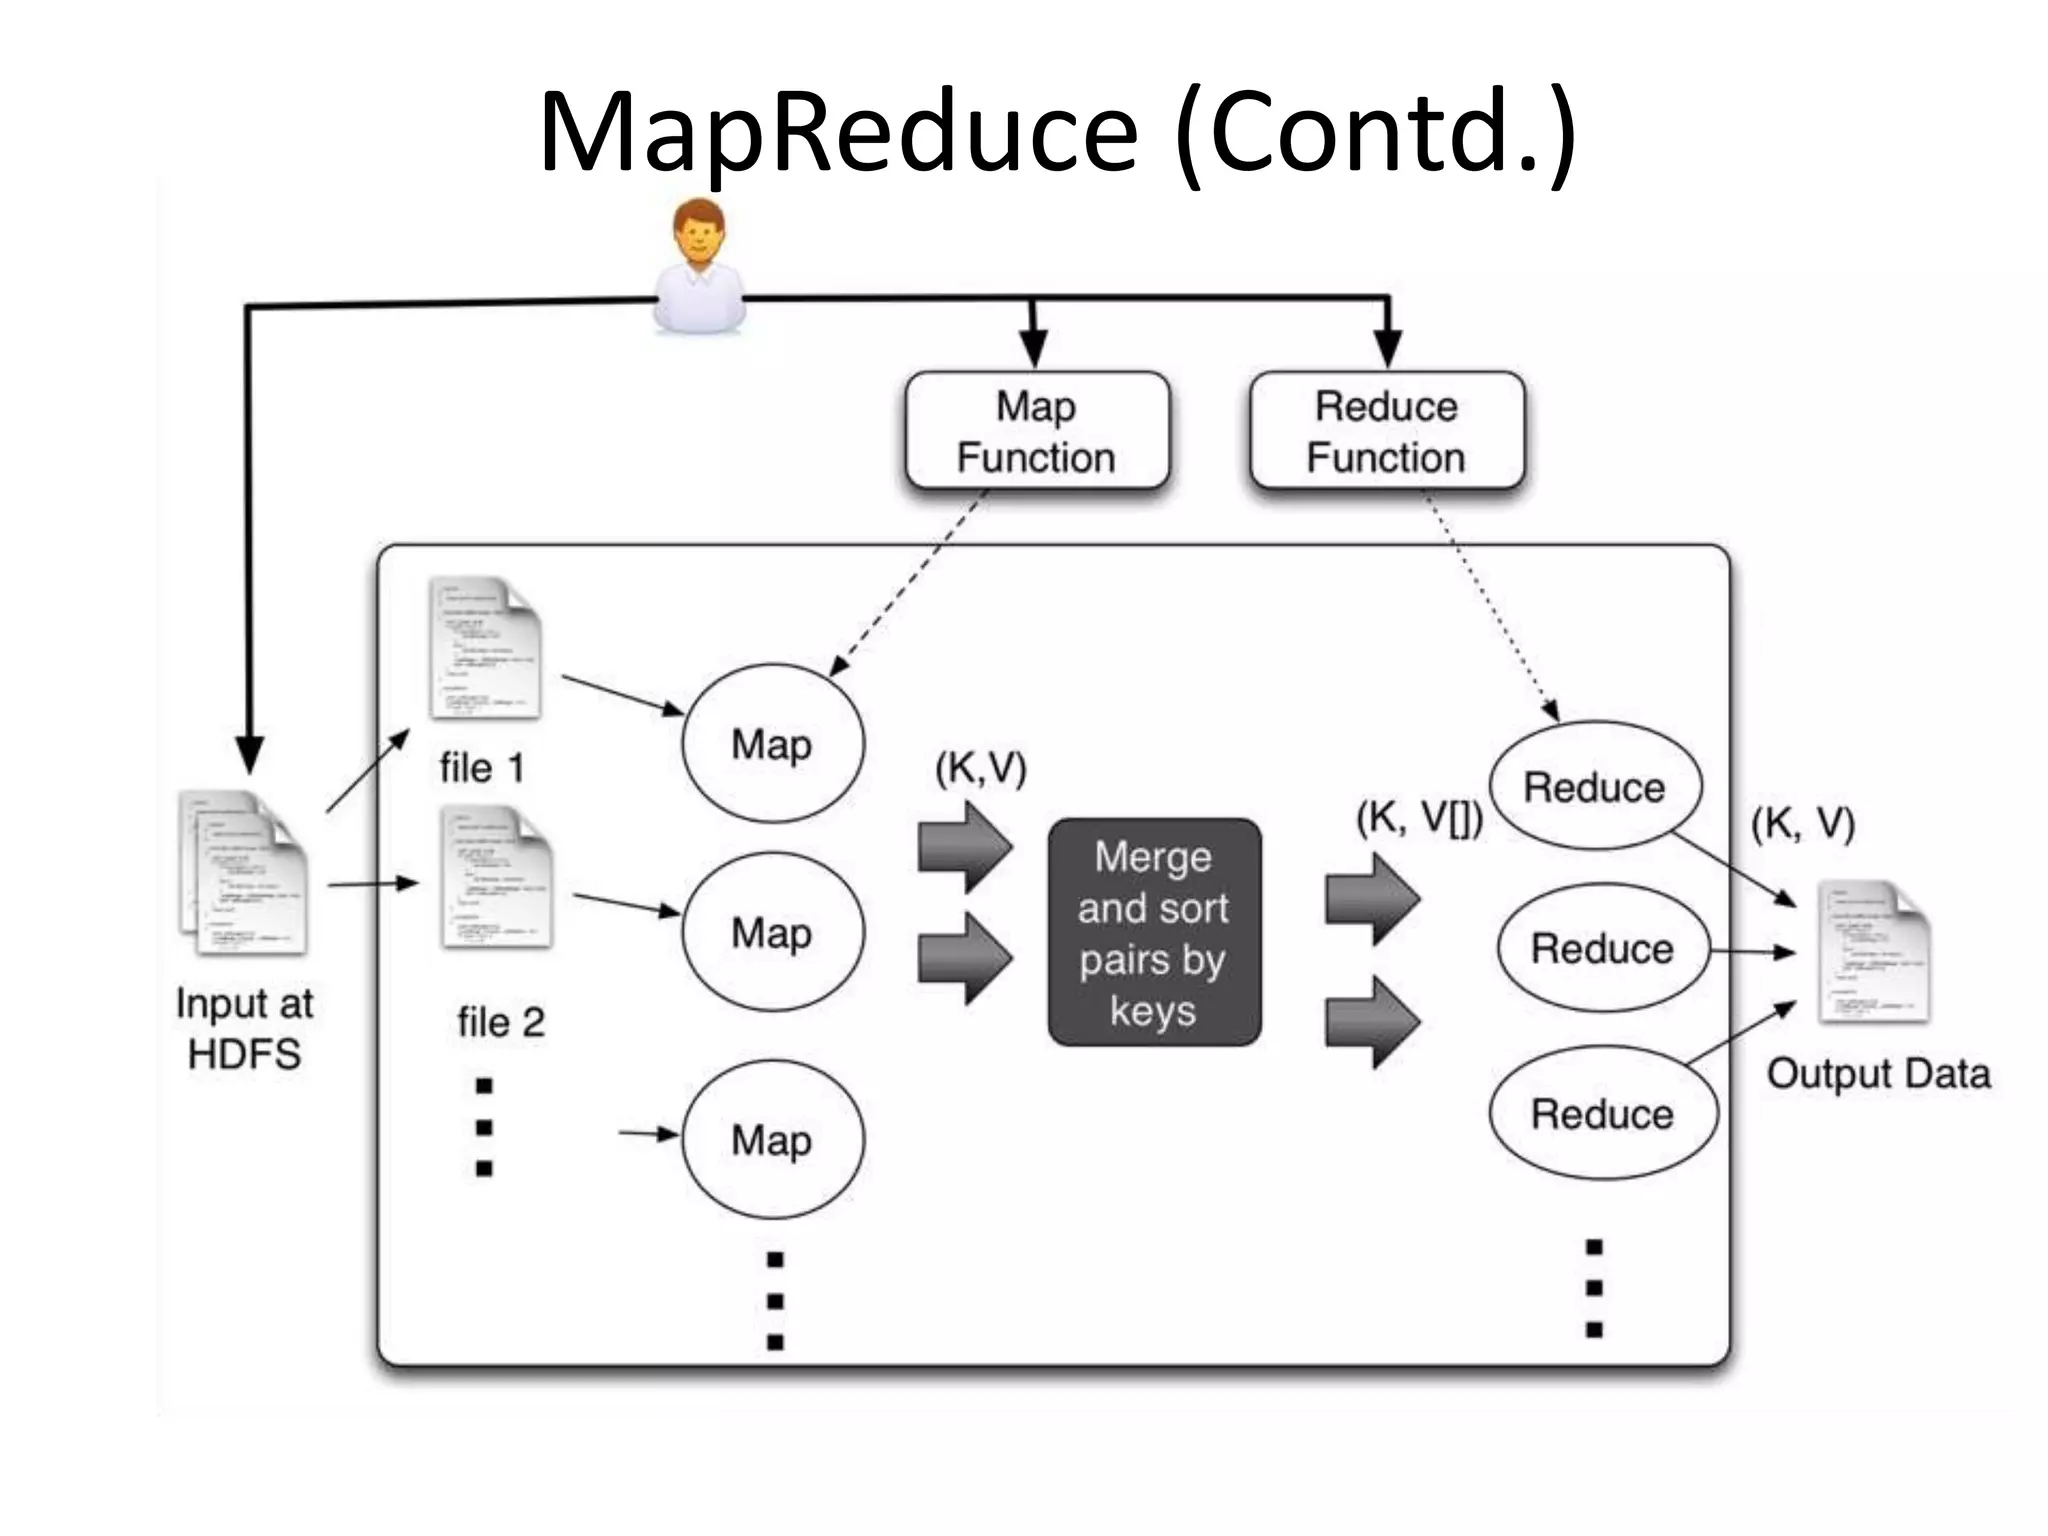
![MapReduce/ Hadoop
• First introduced by Google,
and used as the processing
model for their architecture
• Implemented by opensource
projects like Apache Hadoop
and Spark
• Users writes two functions:
map and reduce
• The framework handles the
details like distributed
processing, fault tolerance,
load balancing etc.
• Widely used, and the one of
the catalyst of Big data
void map(ctx, k, v){
tokens = v.split();
for t in tokens
ctx.emit(t,1)
}
void reduce(ctx, k, values[]){
count = 0;
for v in values
count = count + v;
ctx.emit(k,count);
}](https://image.slidesharecdn.com/bigdata-130517055839-phpapp01/75/Introduction-to-Big-Data-35-2048.jpg)
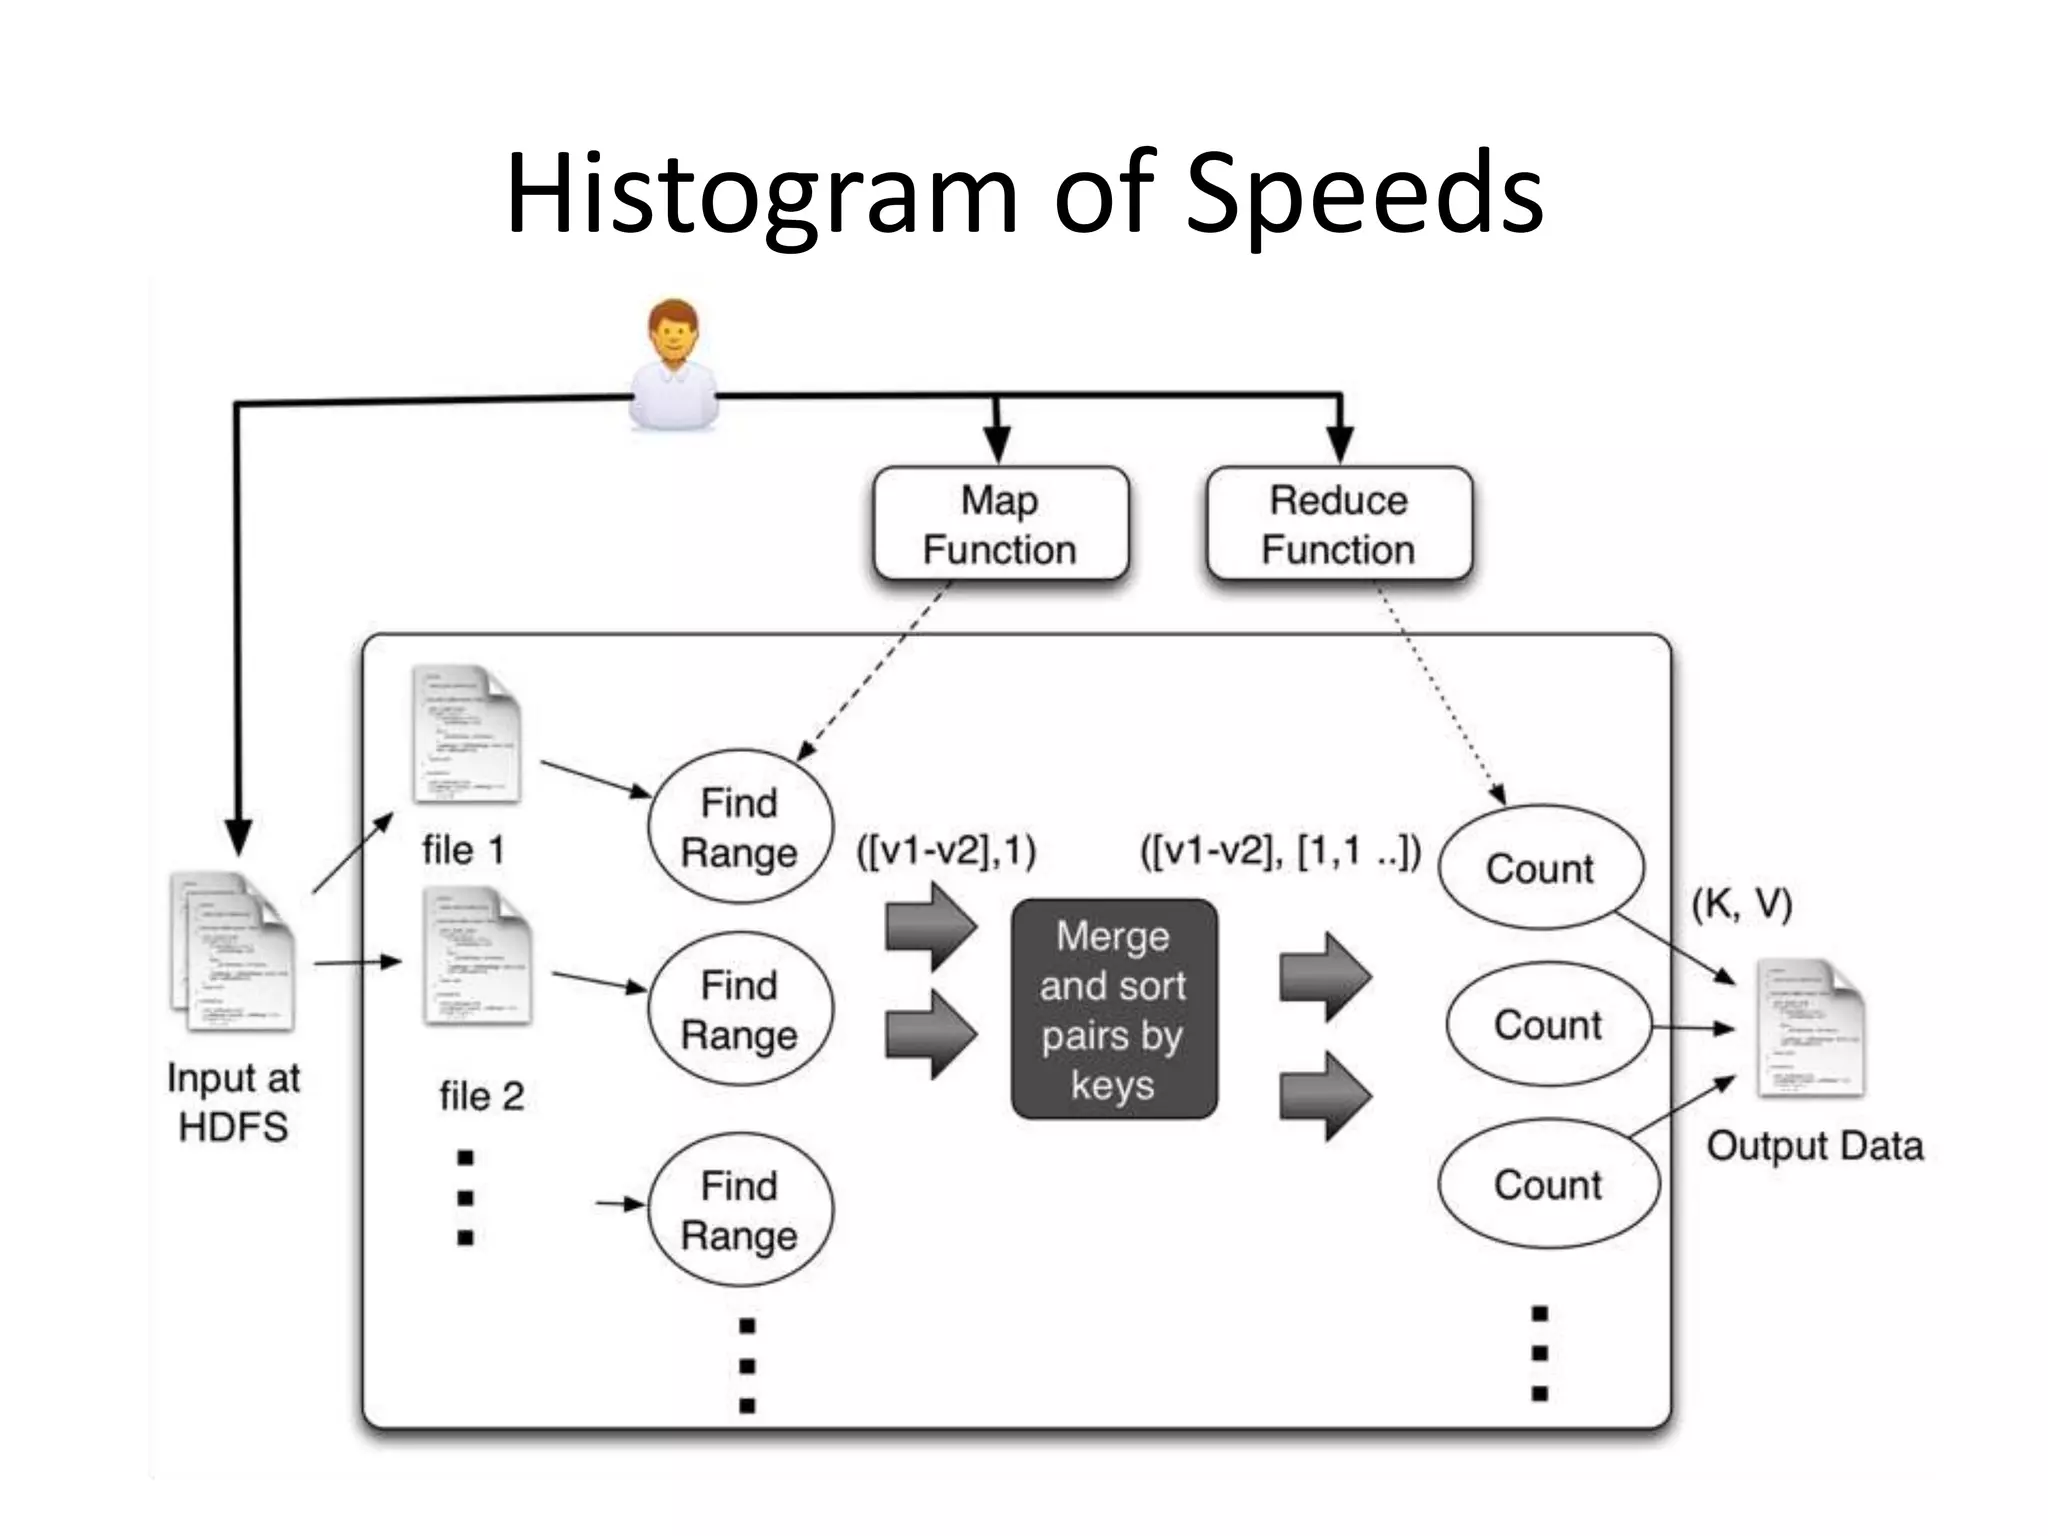
![Histogram of Speeds(Contd.)
void map(ctx, k, v){
event = parse(v);
range = calcuateRange(event.v);
ctx.emit(range,1)
}
void reduce(ctx, k, values[]){
count = 0;
for v in values
count = count + v;
ctx.emit(k,count);
}](https://image.slidesharecdn.com/bigdata-130517055839-phpapp01/75/Introduction-to-Big-Data-38-2048.jpg)
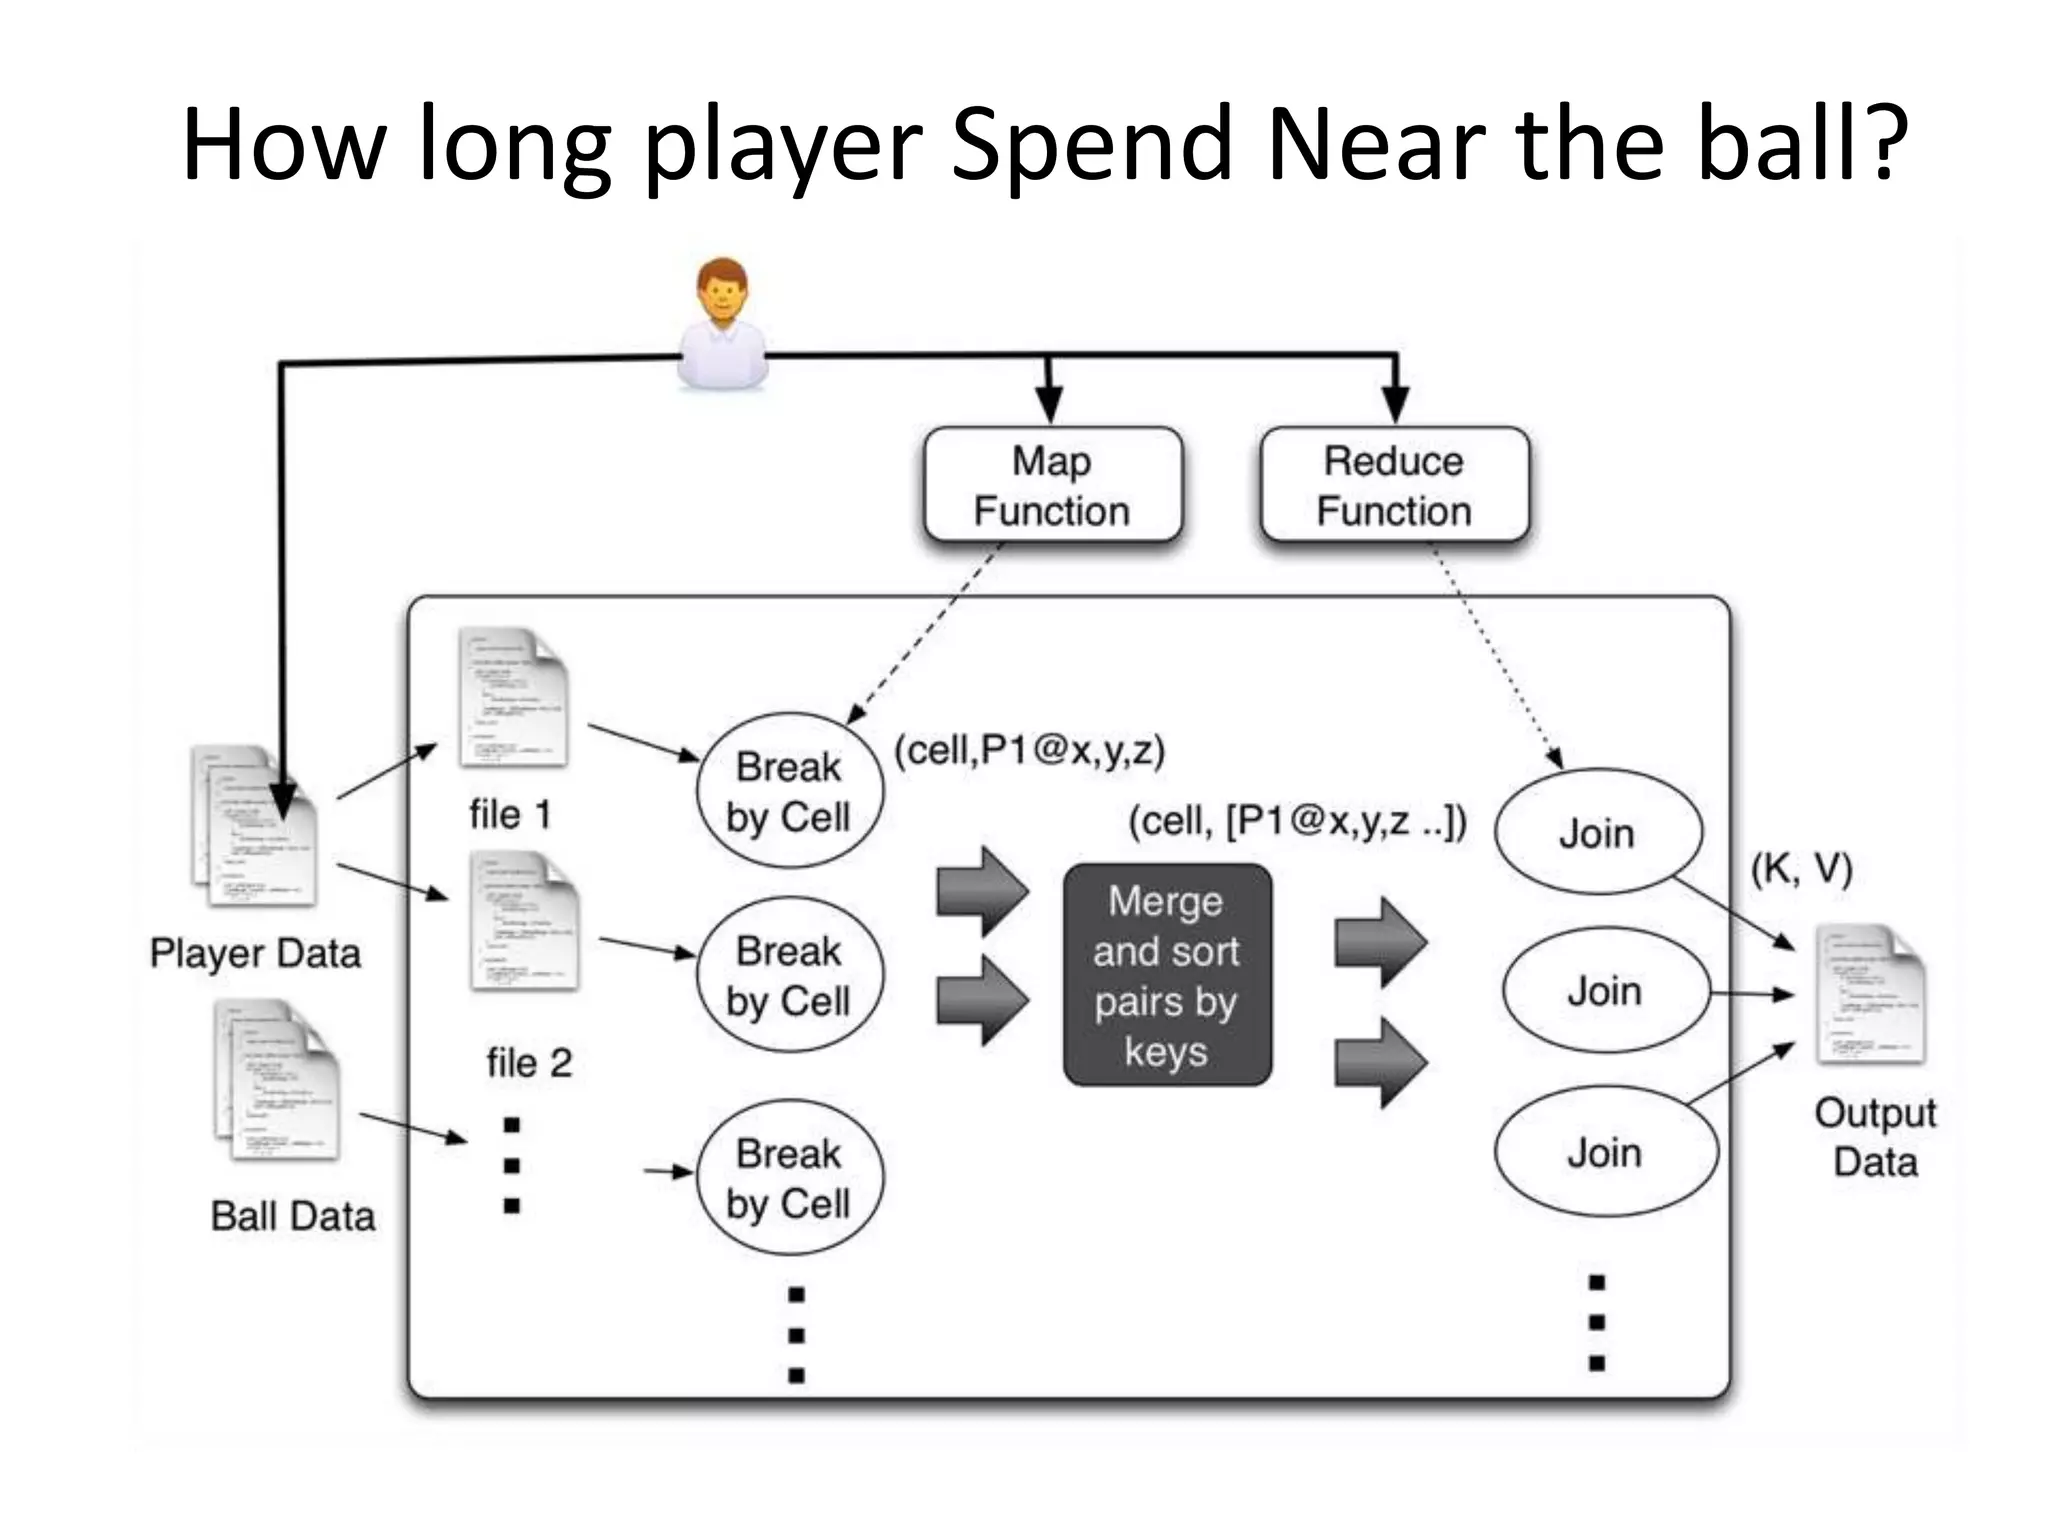
![How long player Spend Near the
ball?(Contd.)
void map(ctx, k, v){
event = parse(v);
cell = calcuateOverlappingCells(v.x,
v.y, v.z);
ctx.emit(cell,v.x, v.y, v.z);
}
Void reduce(ctx, k, values[]){
players = joinAndFindPlayersNearBall(values);
for p in players
ctx.emit(p,p);
}](https://image.slidesharecdn.com/bigdata-130517055839-phpapp01/75/Introduction-to-Big-Data-40-2048.jpg)
![Complex Event Processing (CEP)
• Sees inputs as Event streams and queried with
SQL like language
• Supports Filters, Windows, Join, Patterns and
Sequences
from p=PINChangeEvents#win.time(3600) join
t=TransactionEvents[p.custid=custid][amount>1000
0] #win.time(3600)
return t.custid, t.amount;](https://image.slidesharecdn.com/bigdata-130517055839-phpapp01/75/Introduction-to-Big-Data-44-2048.jpg)
![Example: Detect ball Possession
• Possession is time a
player hit the ball
until someone else
hits it or it goes out
of the ground
from Ball#window.length(1) as b join
Players#window.length(1) as p
unidirectional
on debs: getDistance(b.x,b.y,b.z,
p.x, p.y, p.z) < 1000
and b.a > 55
select ...
insert into hitStream
from old = hitStream ,
b = hitStream [old. pid != pid ],
n= hitStream[b.pid == pid]*,
( e1 = hitStream[b.pid != pid ]
or e2= ballLeavingHitStream)
select ...
insert into BallPossessionStream
http://www.flickr.com/photos/glennharper/146164820/](https://image.slidesharecdn.com/bigdata-130517055839-phpapp01/75/Introduction-to-Big-Data-45-2048.jpg)
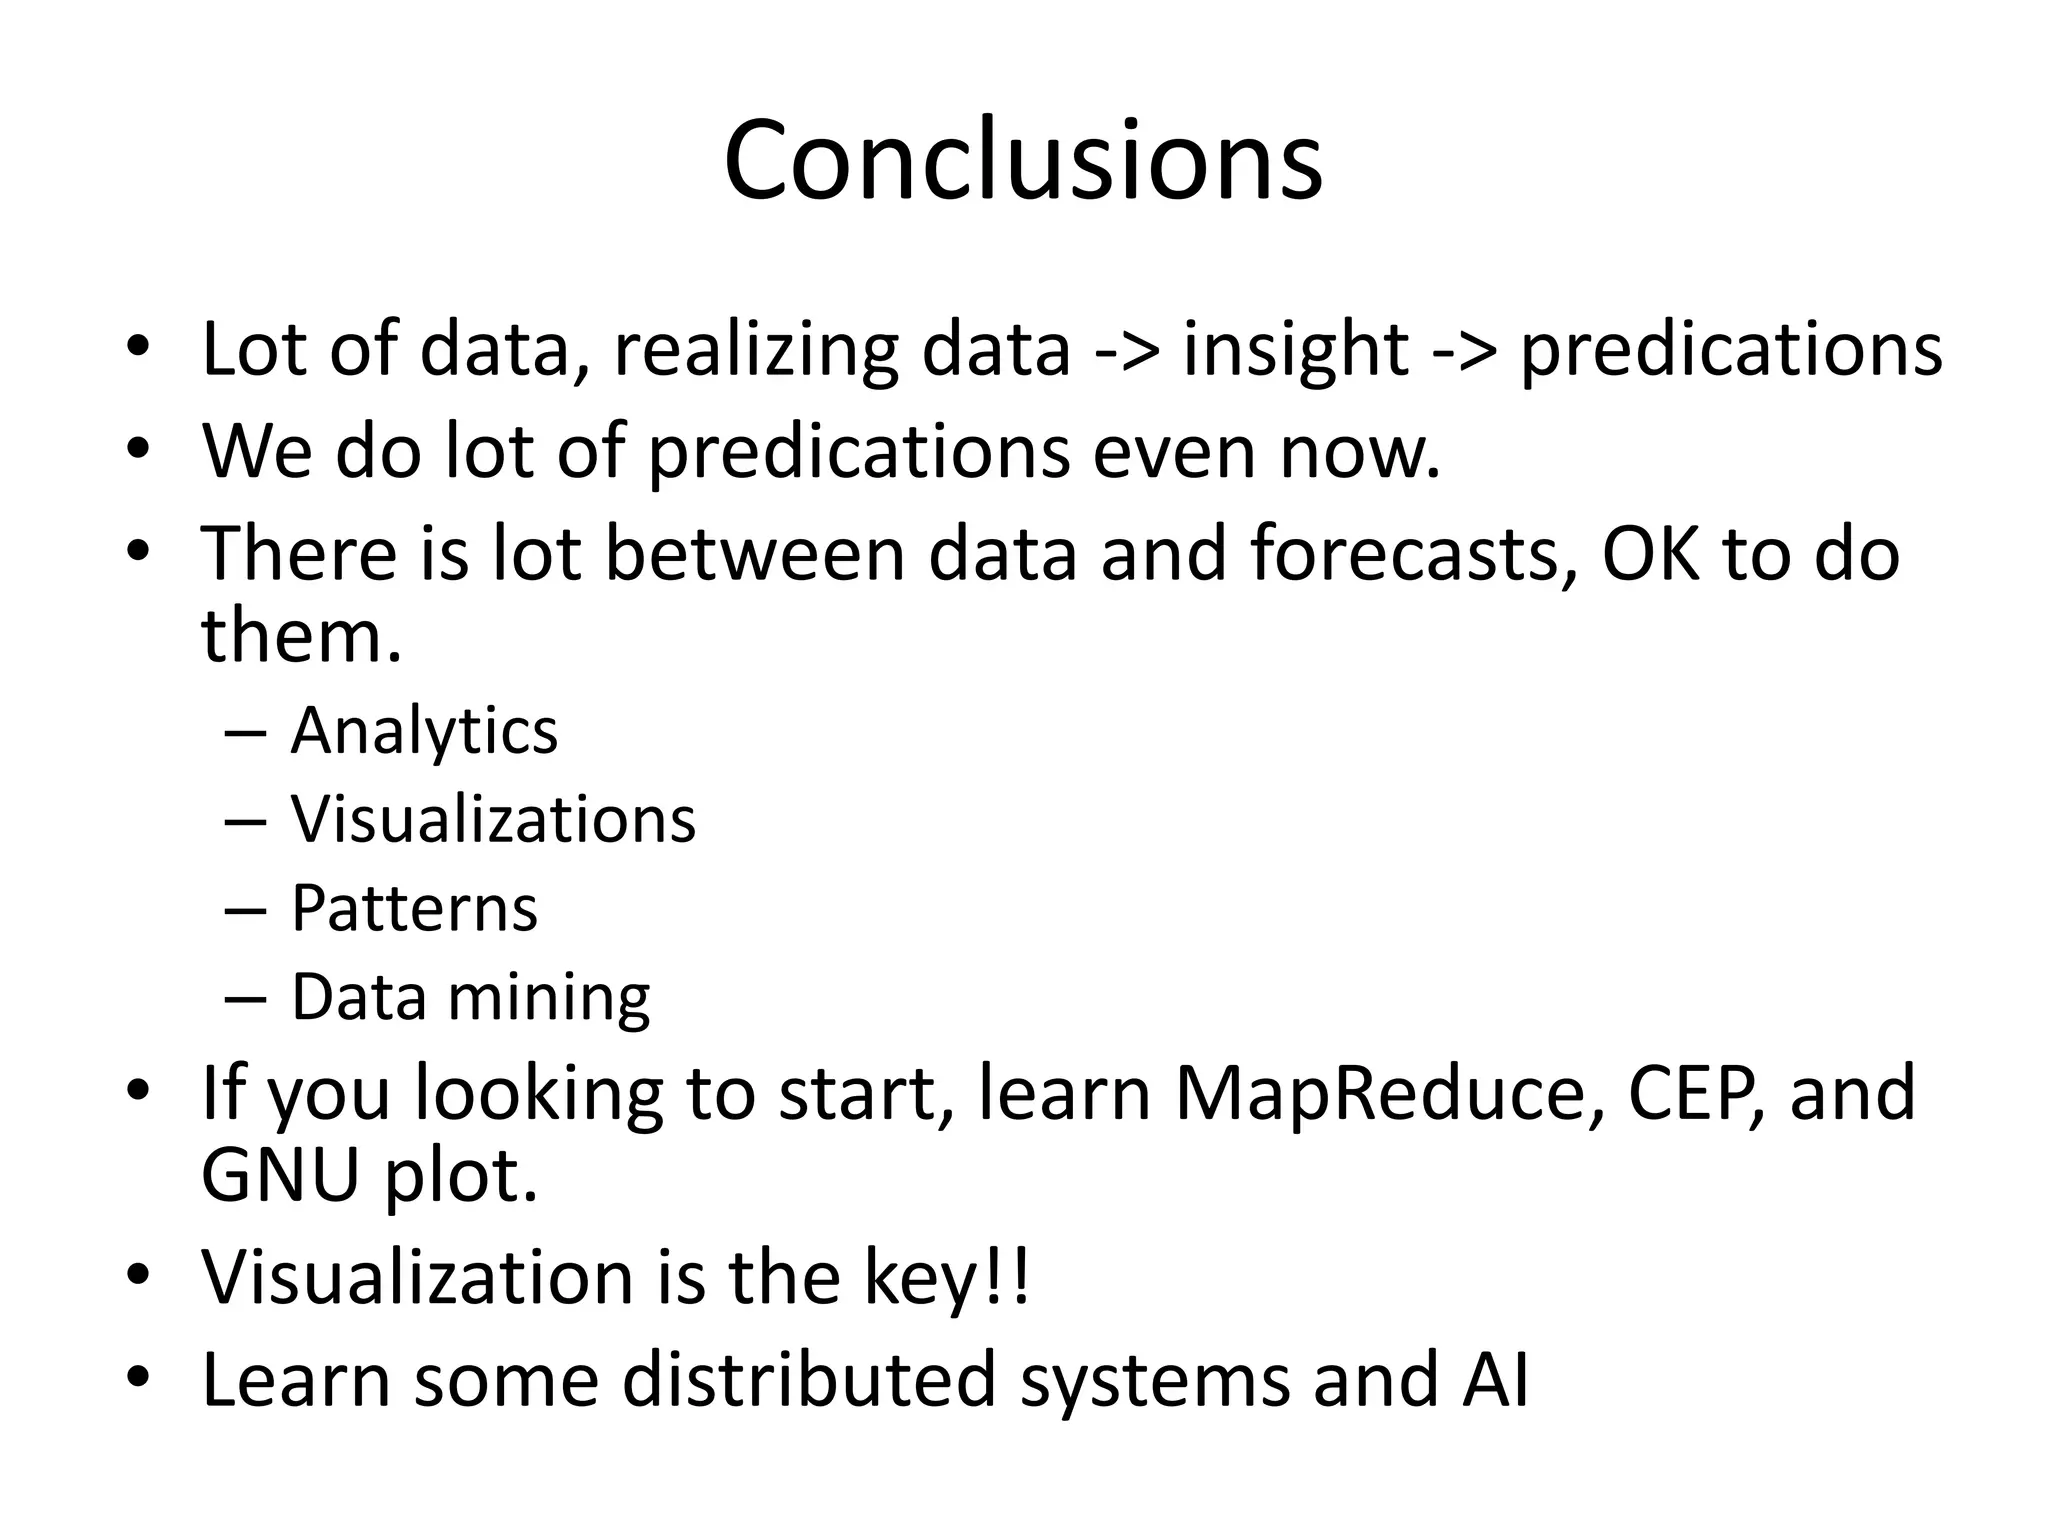


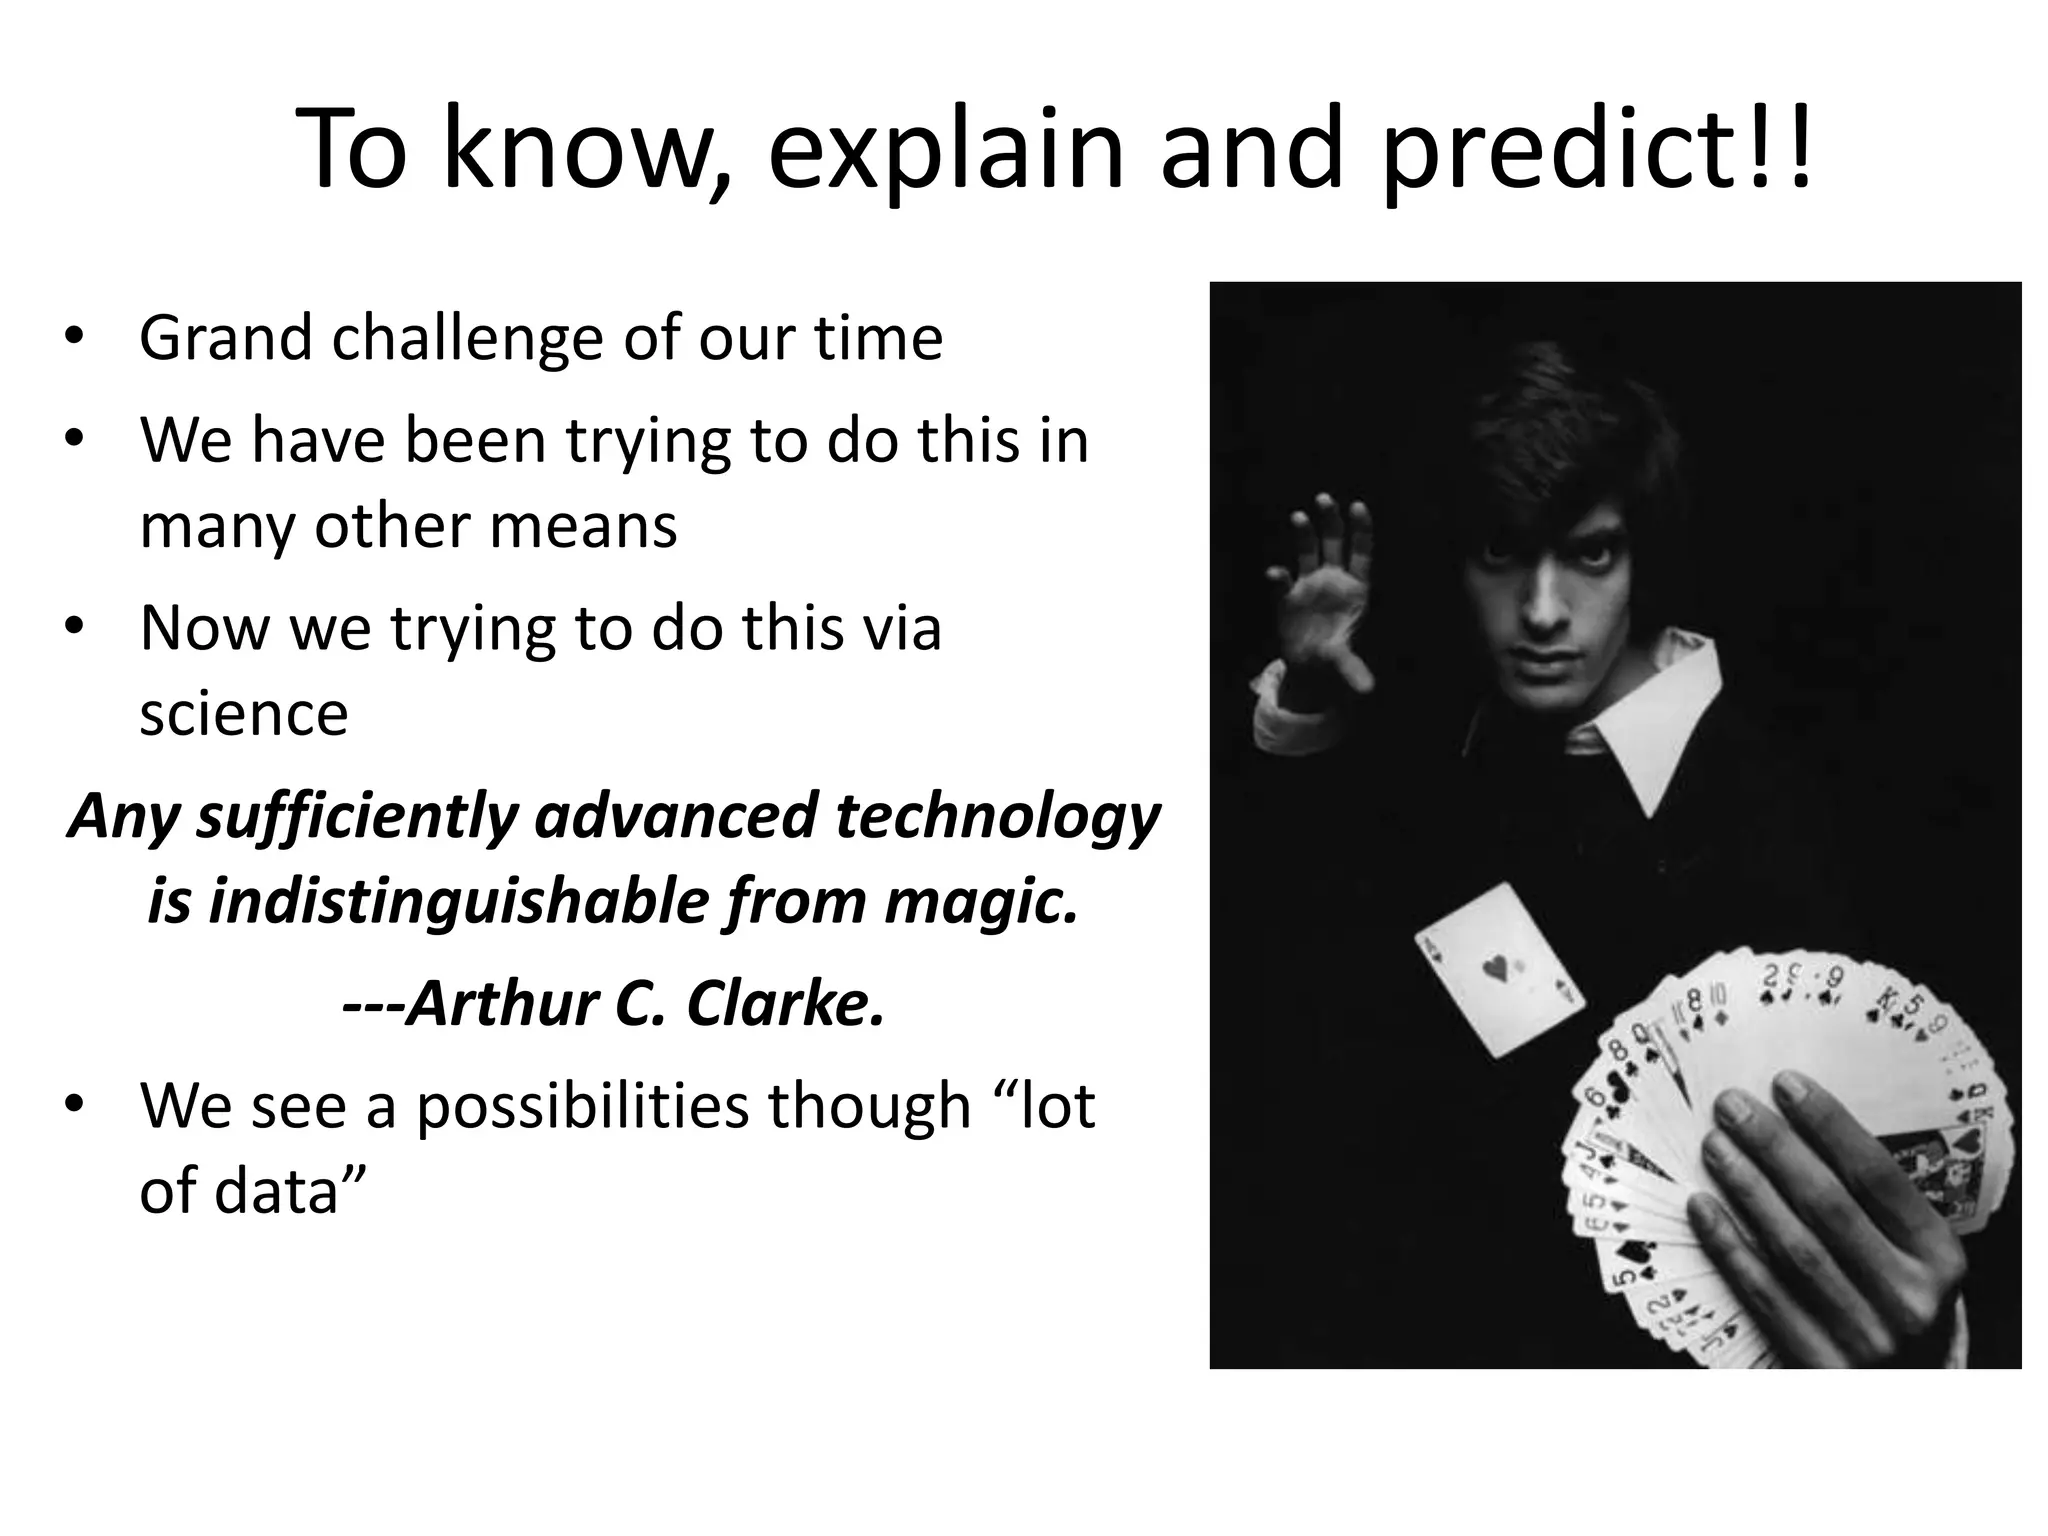
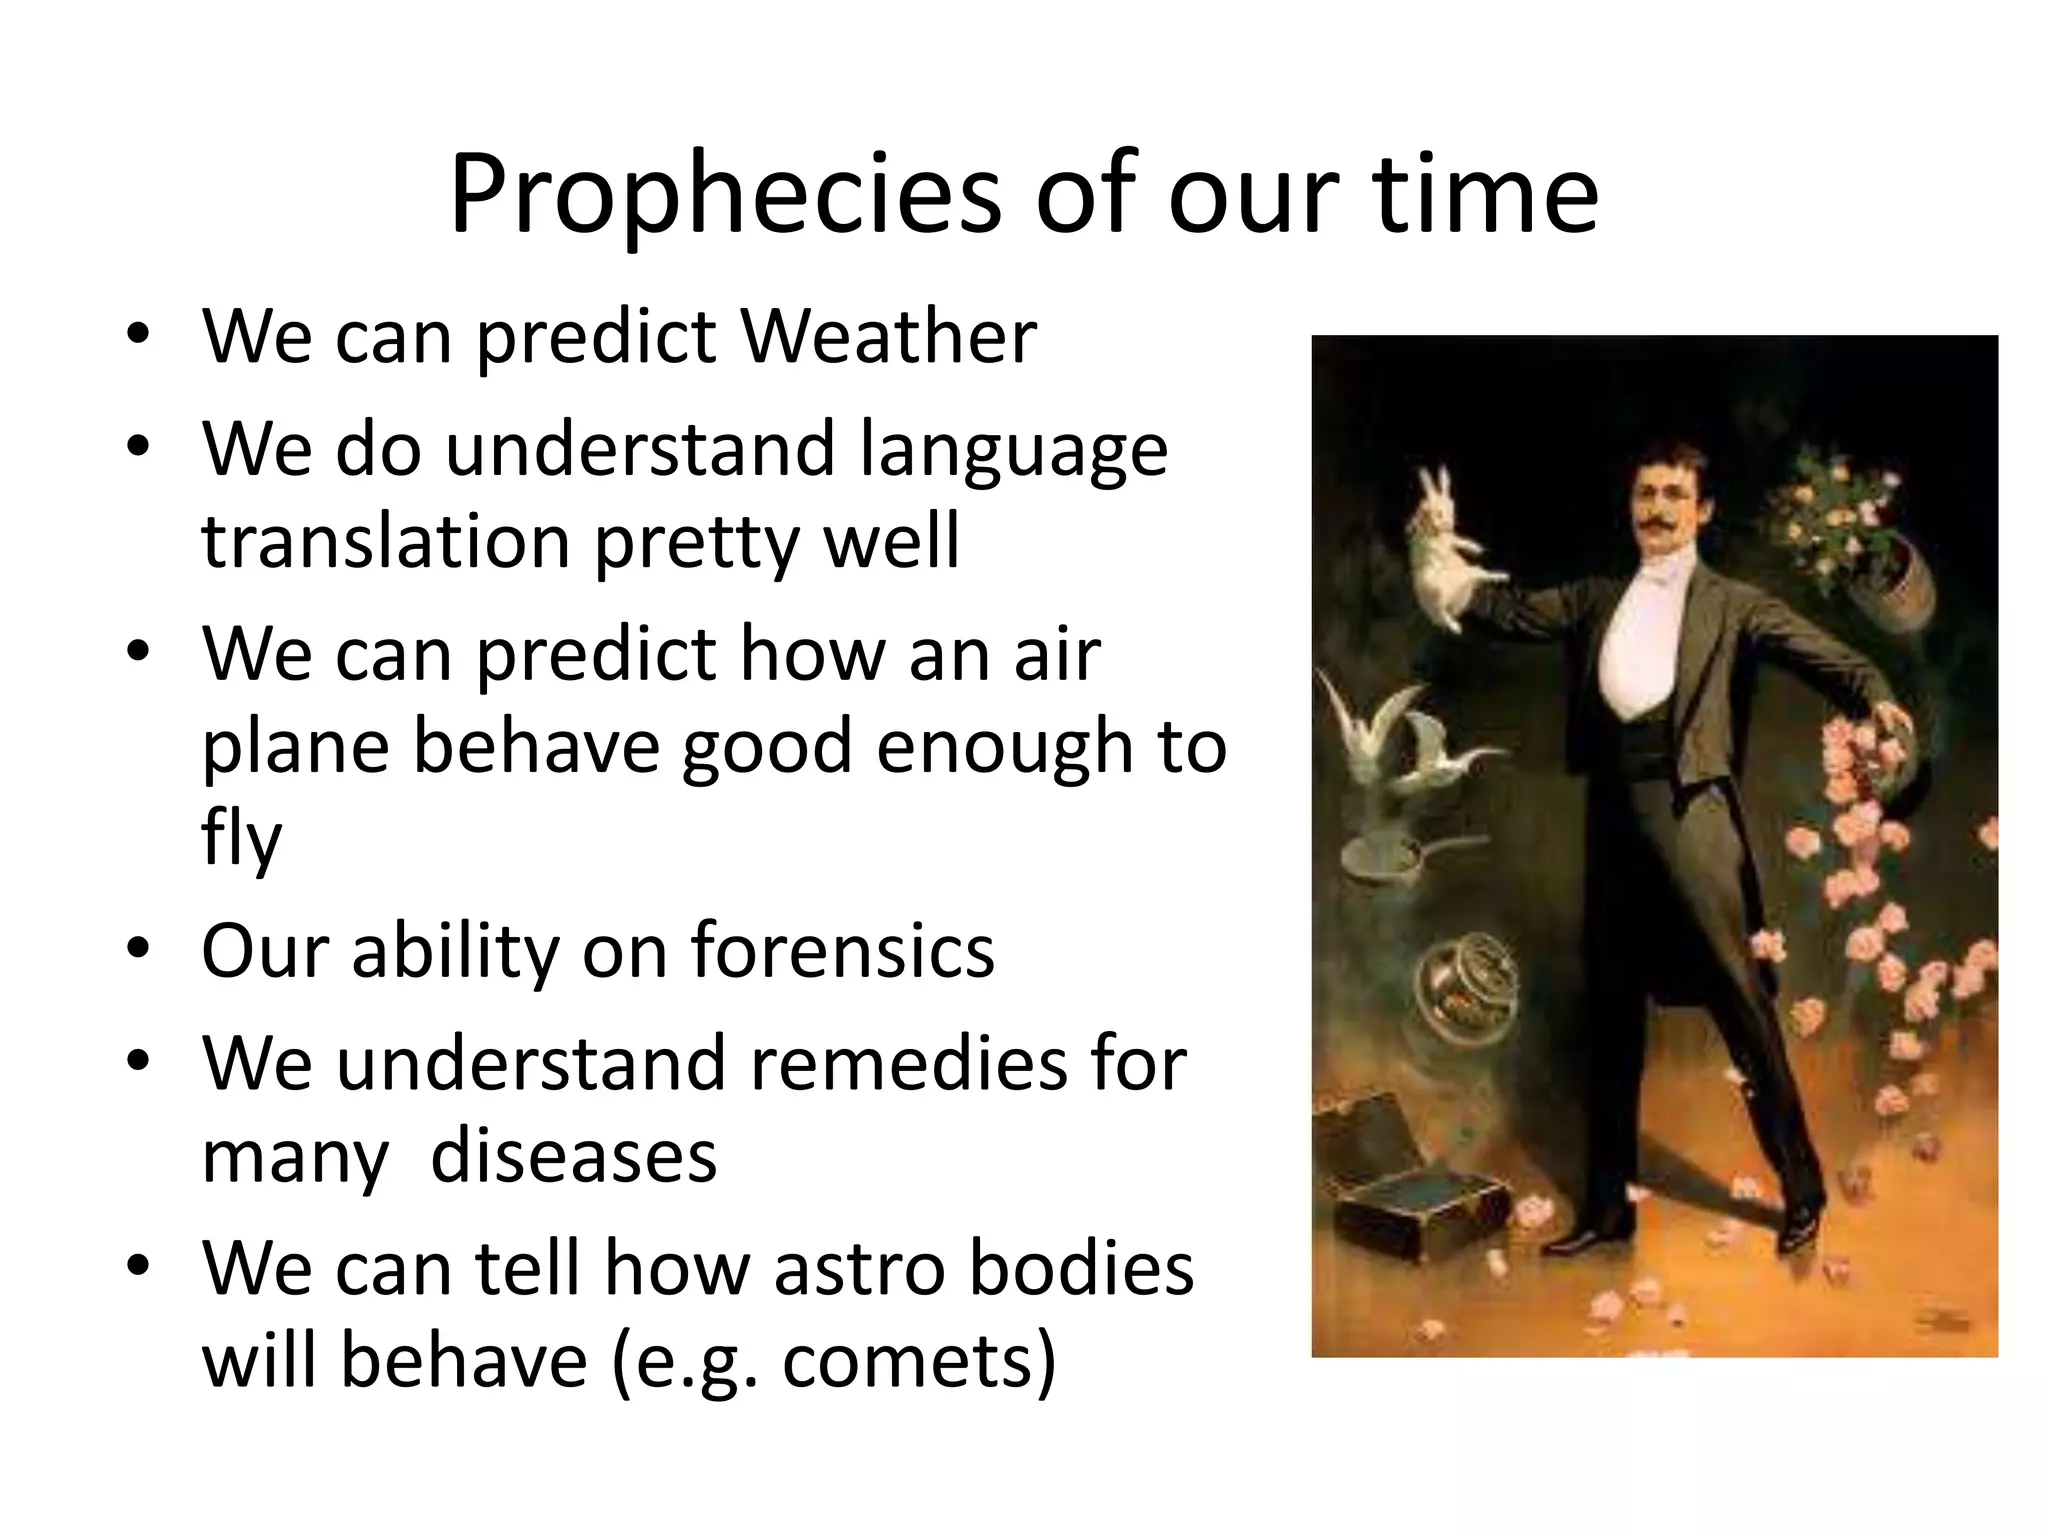
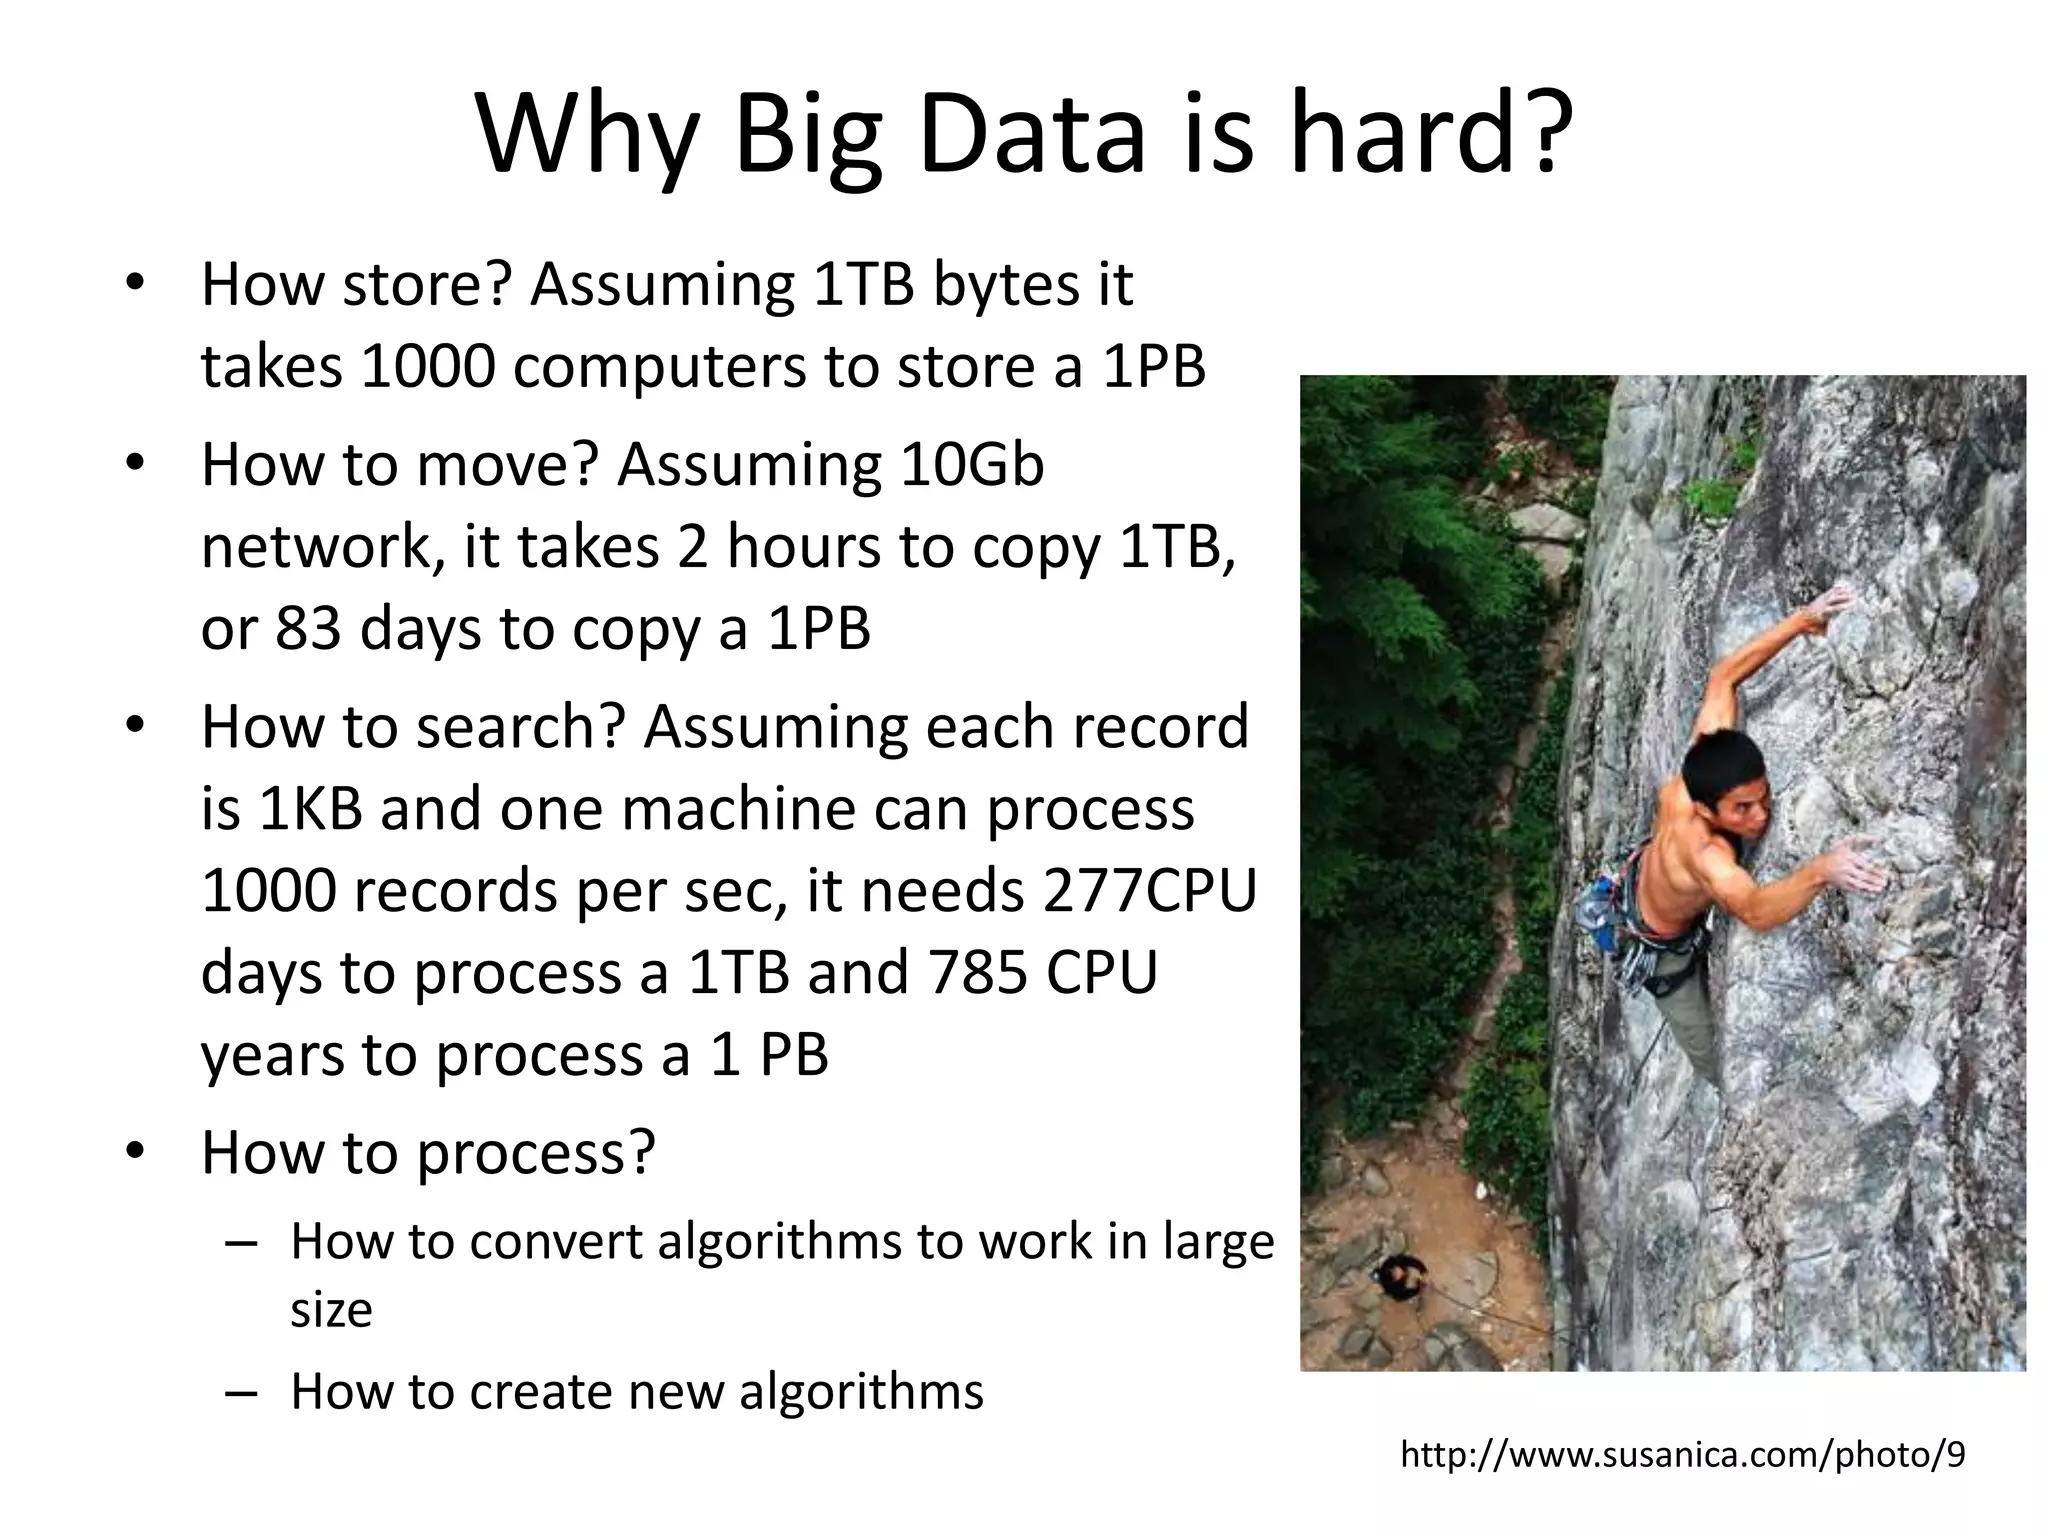
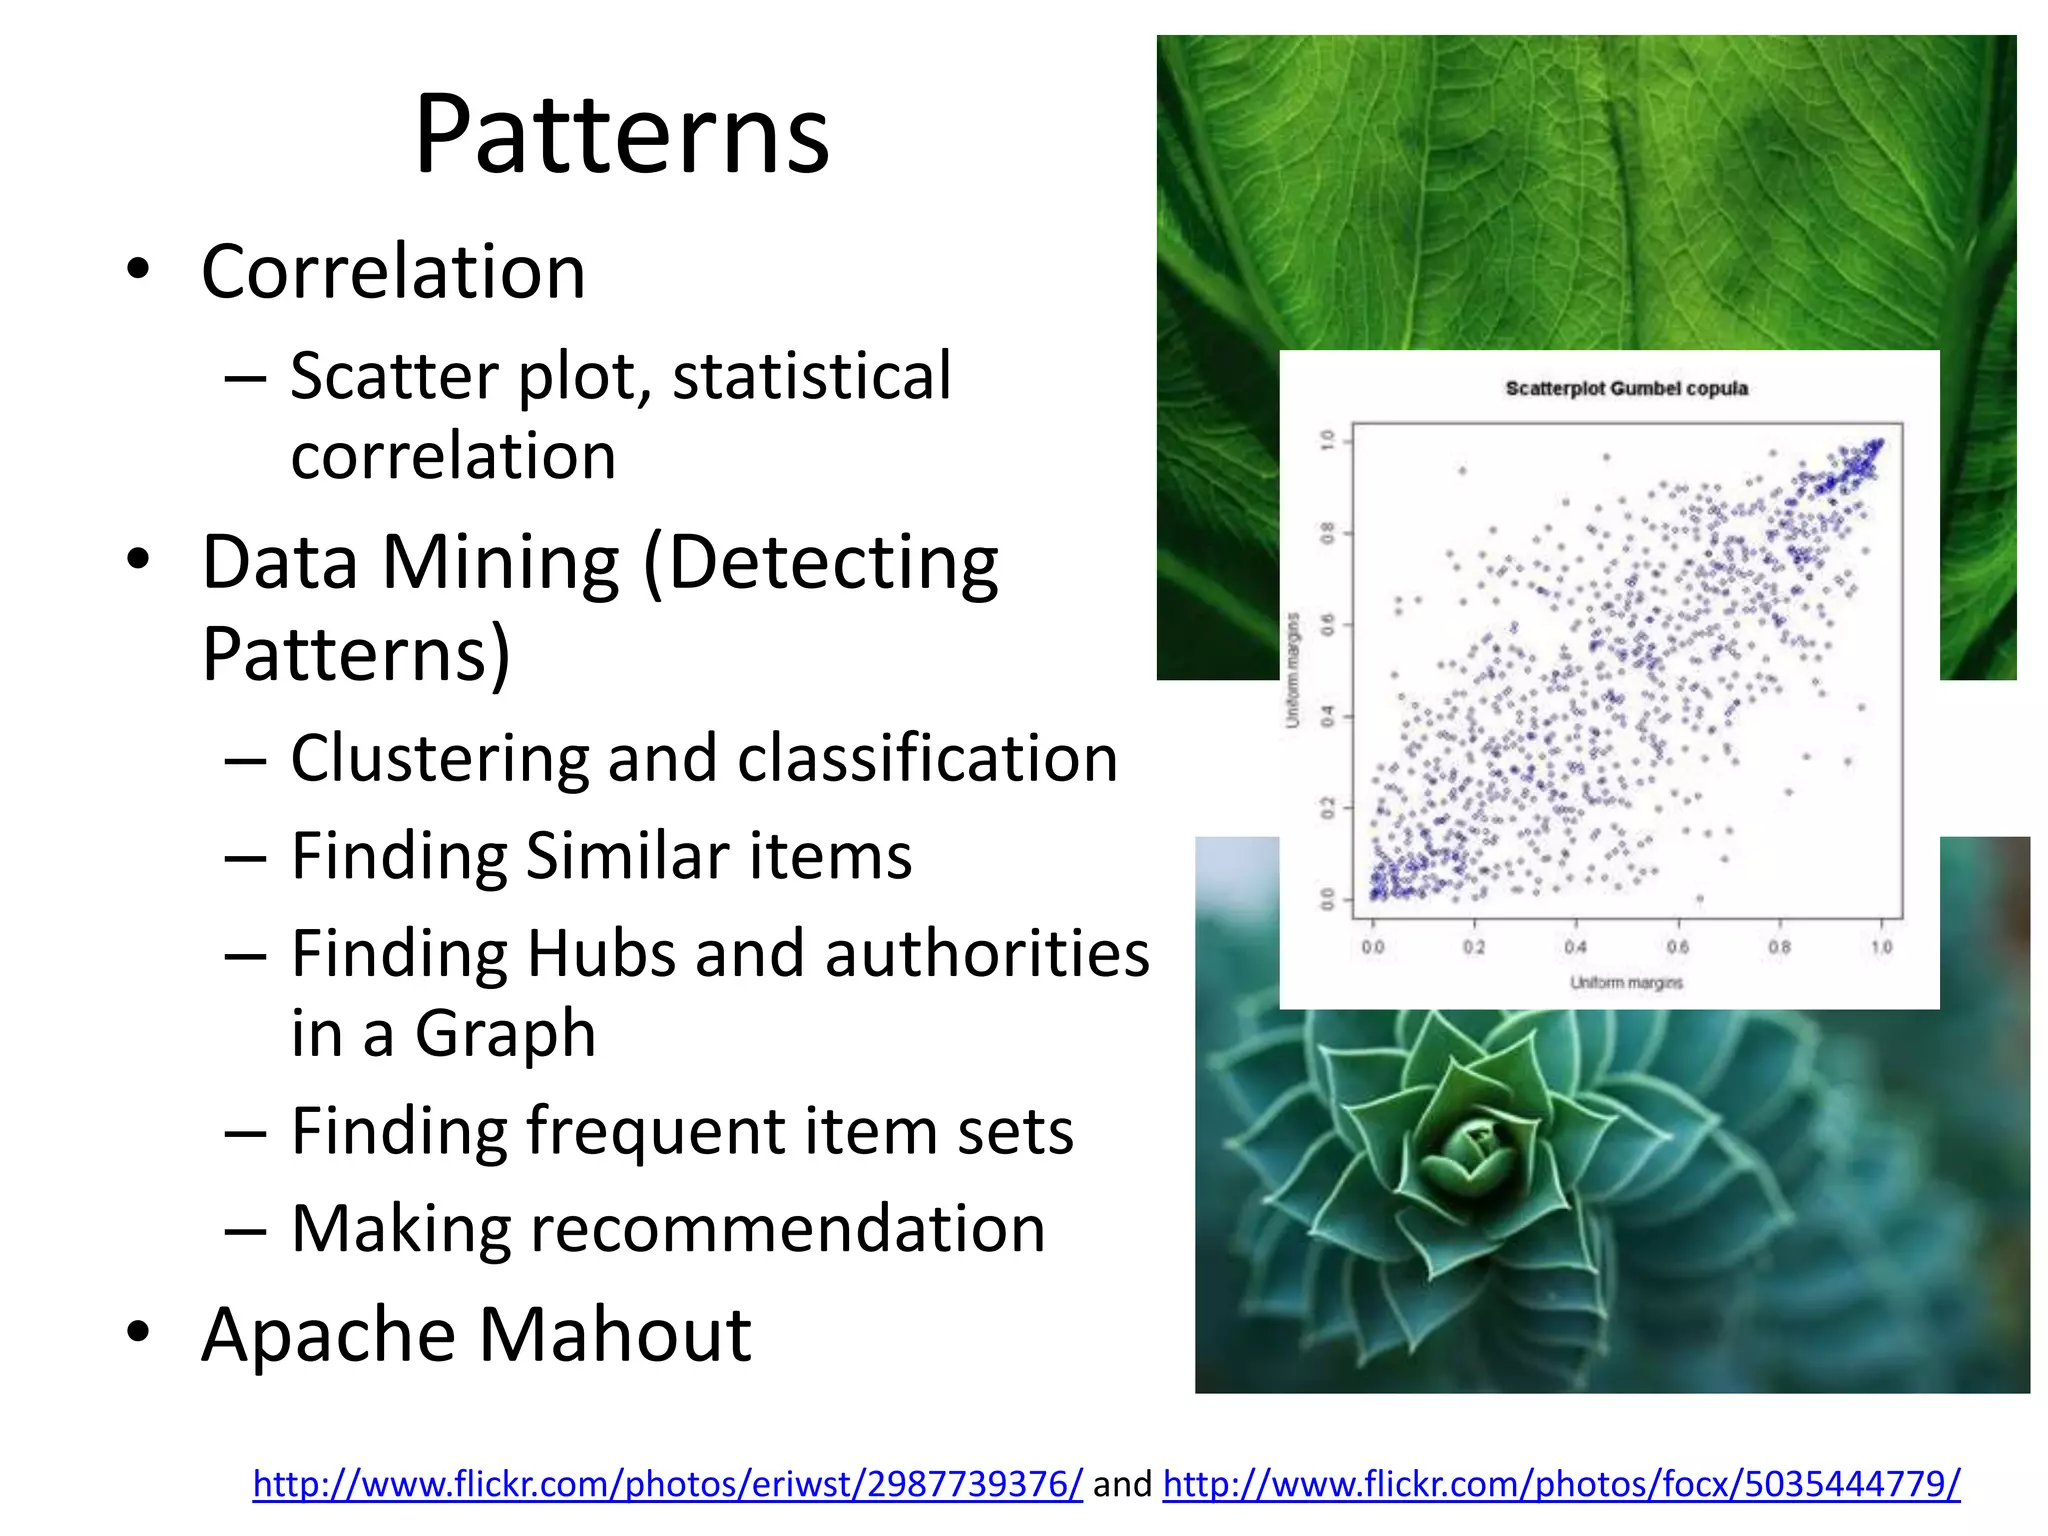
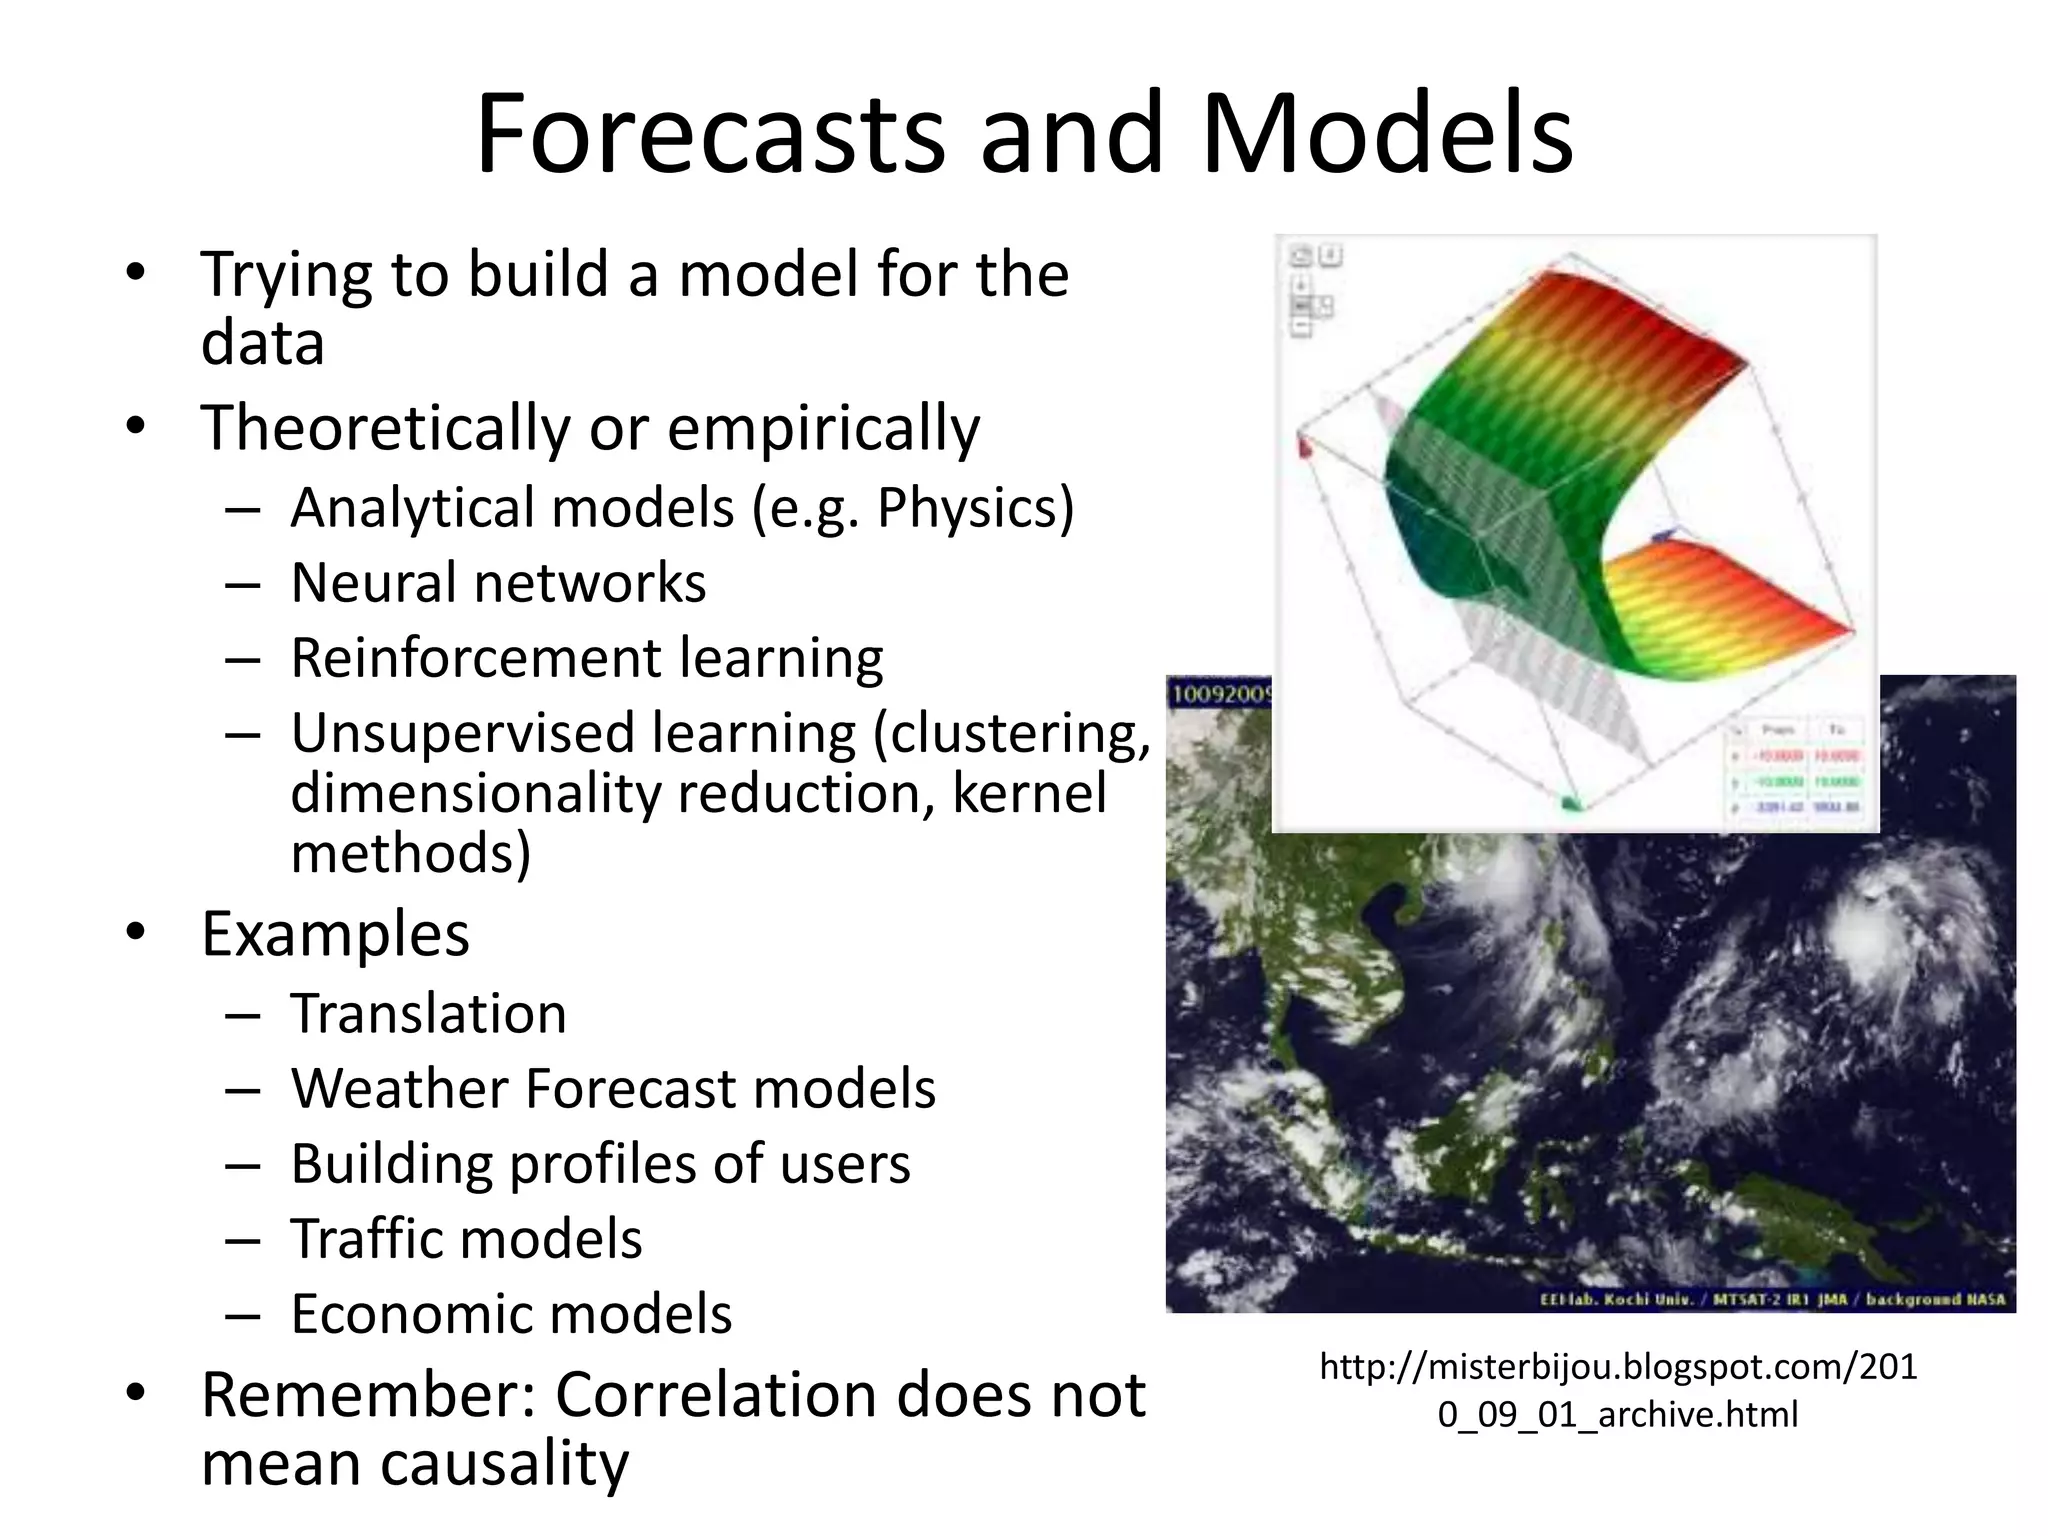
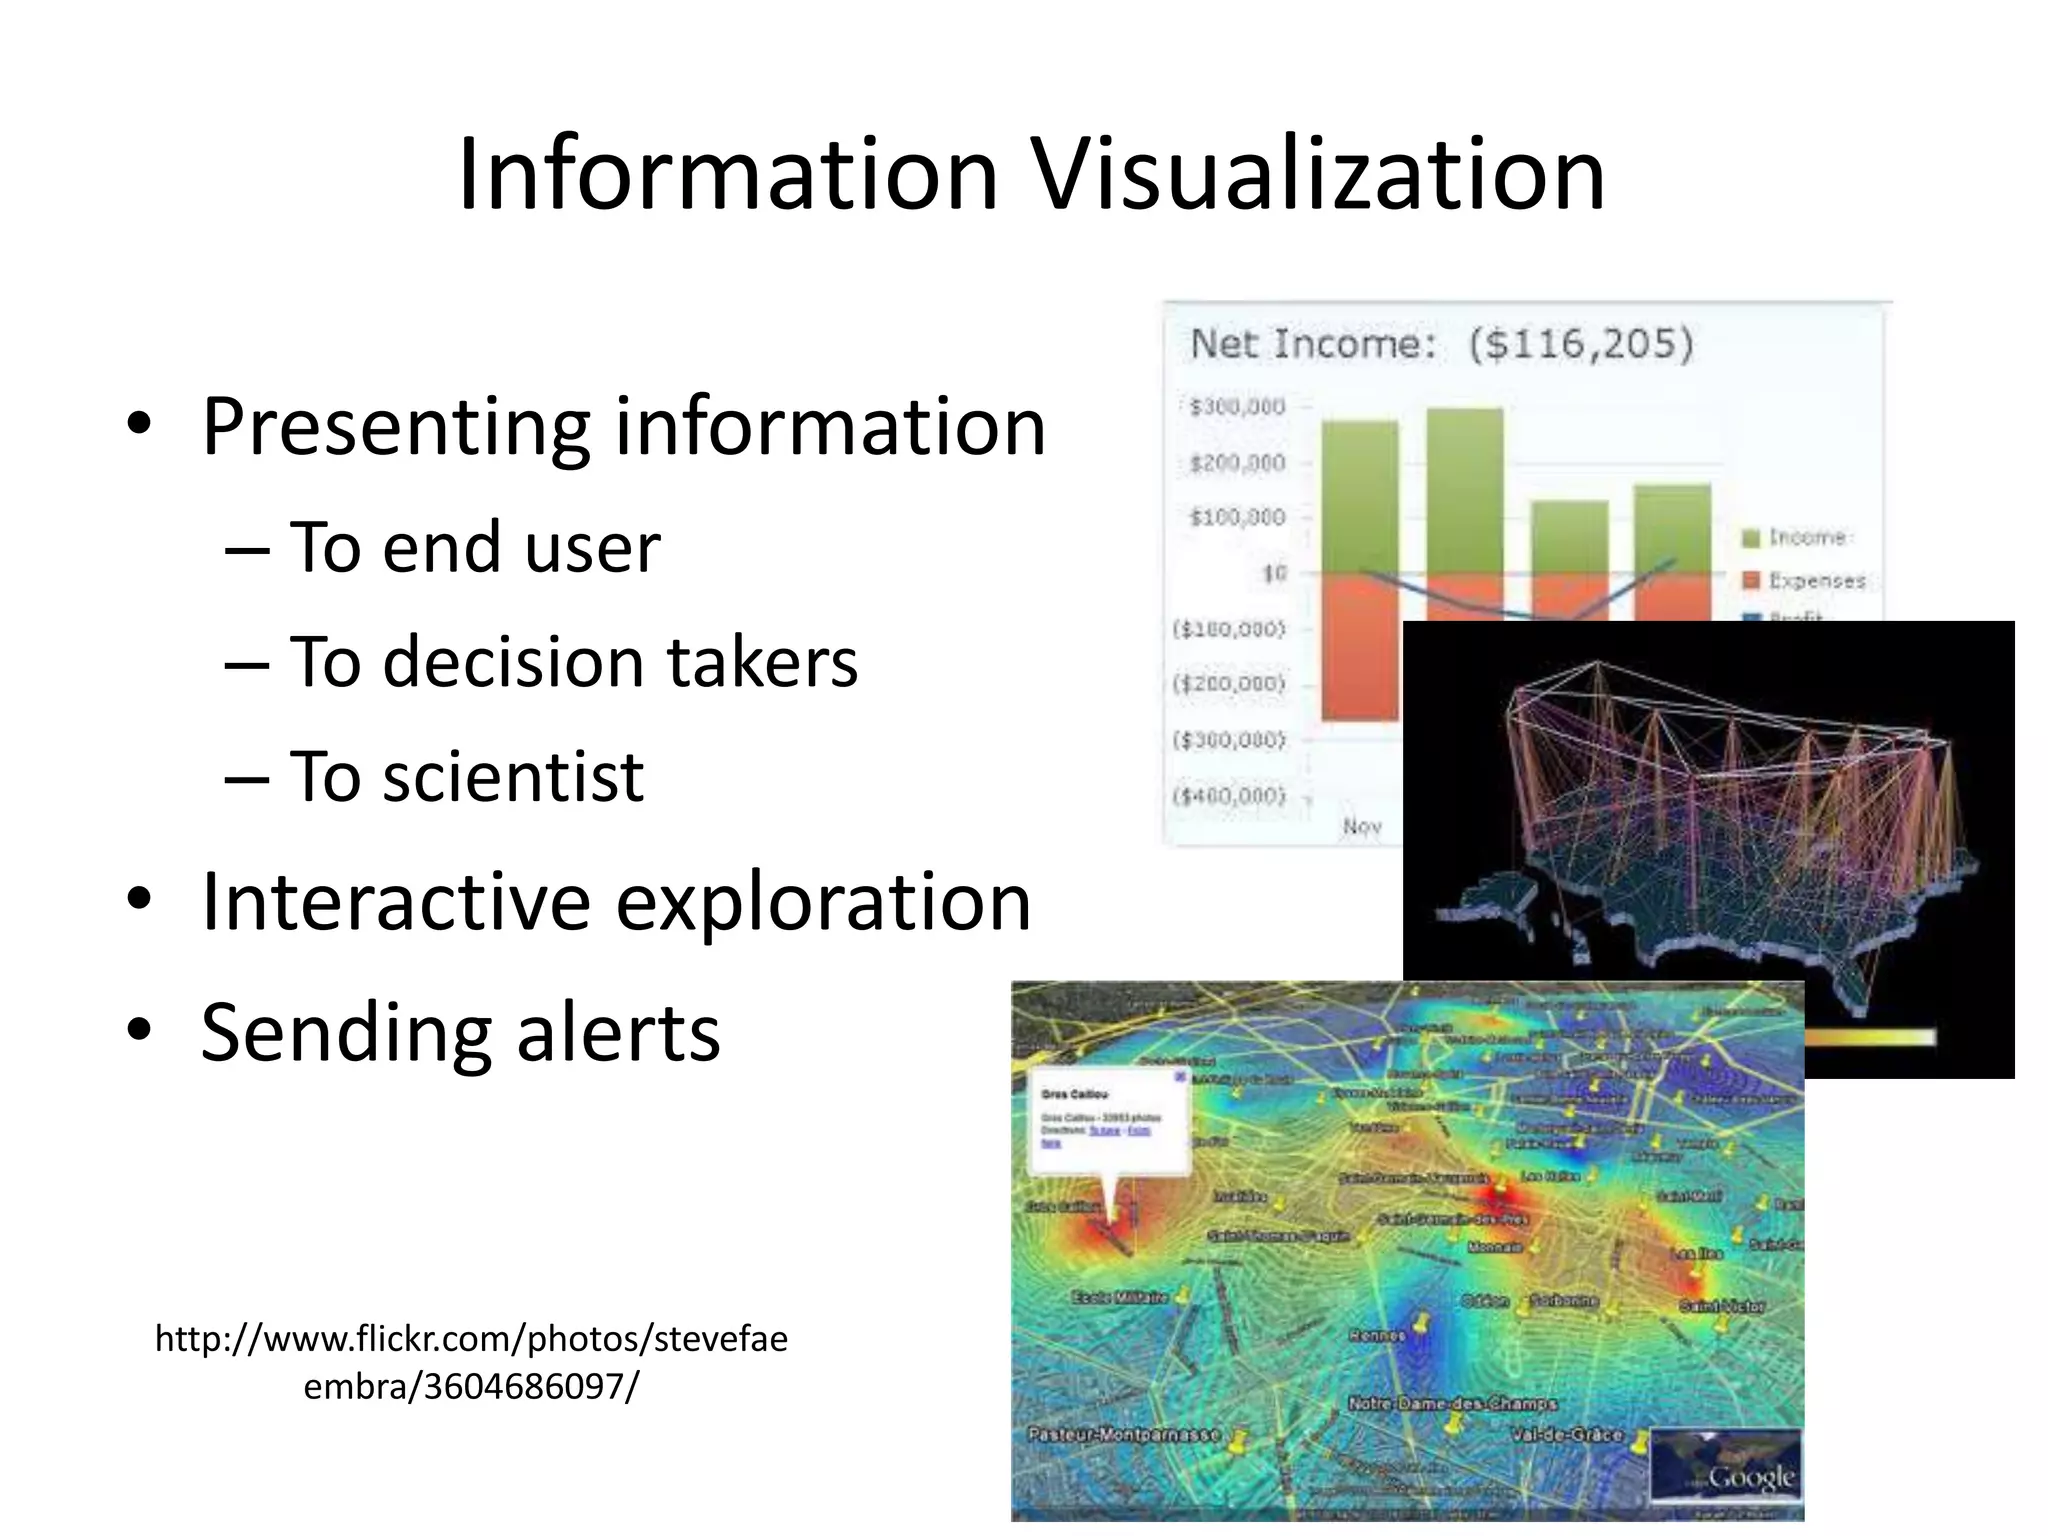
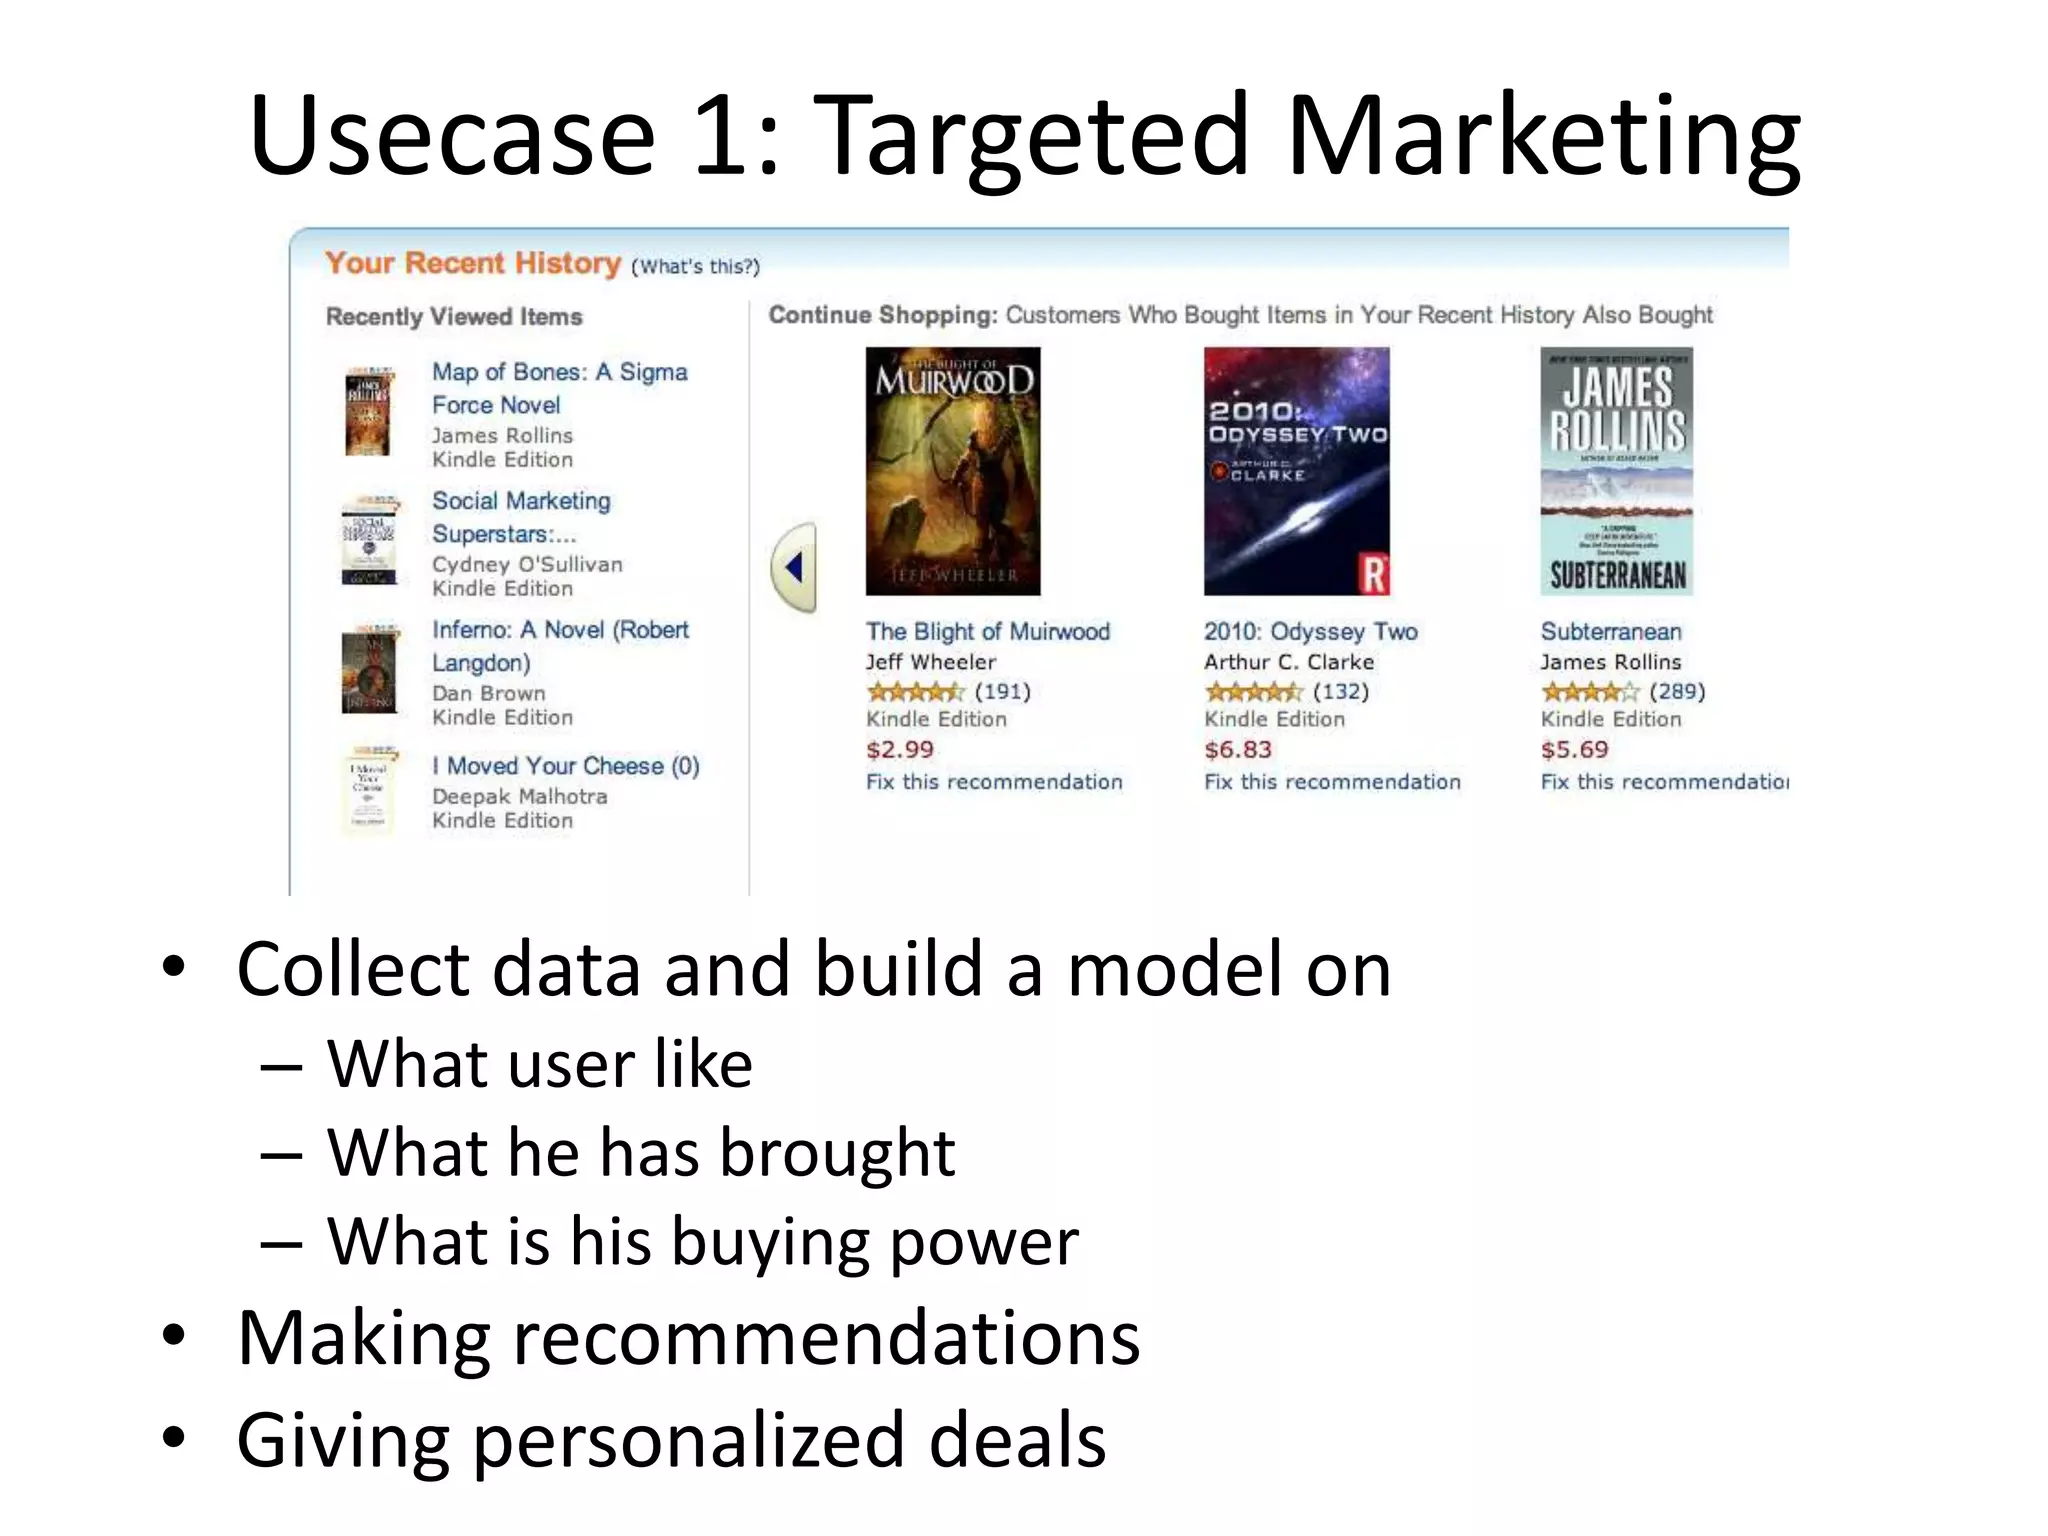
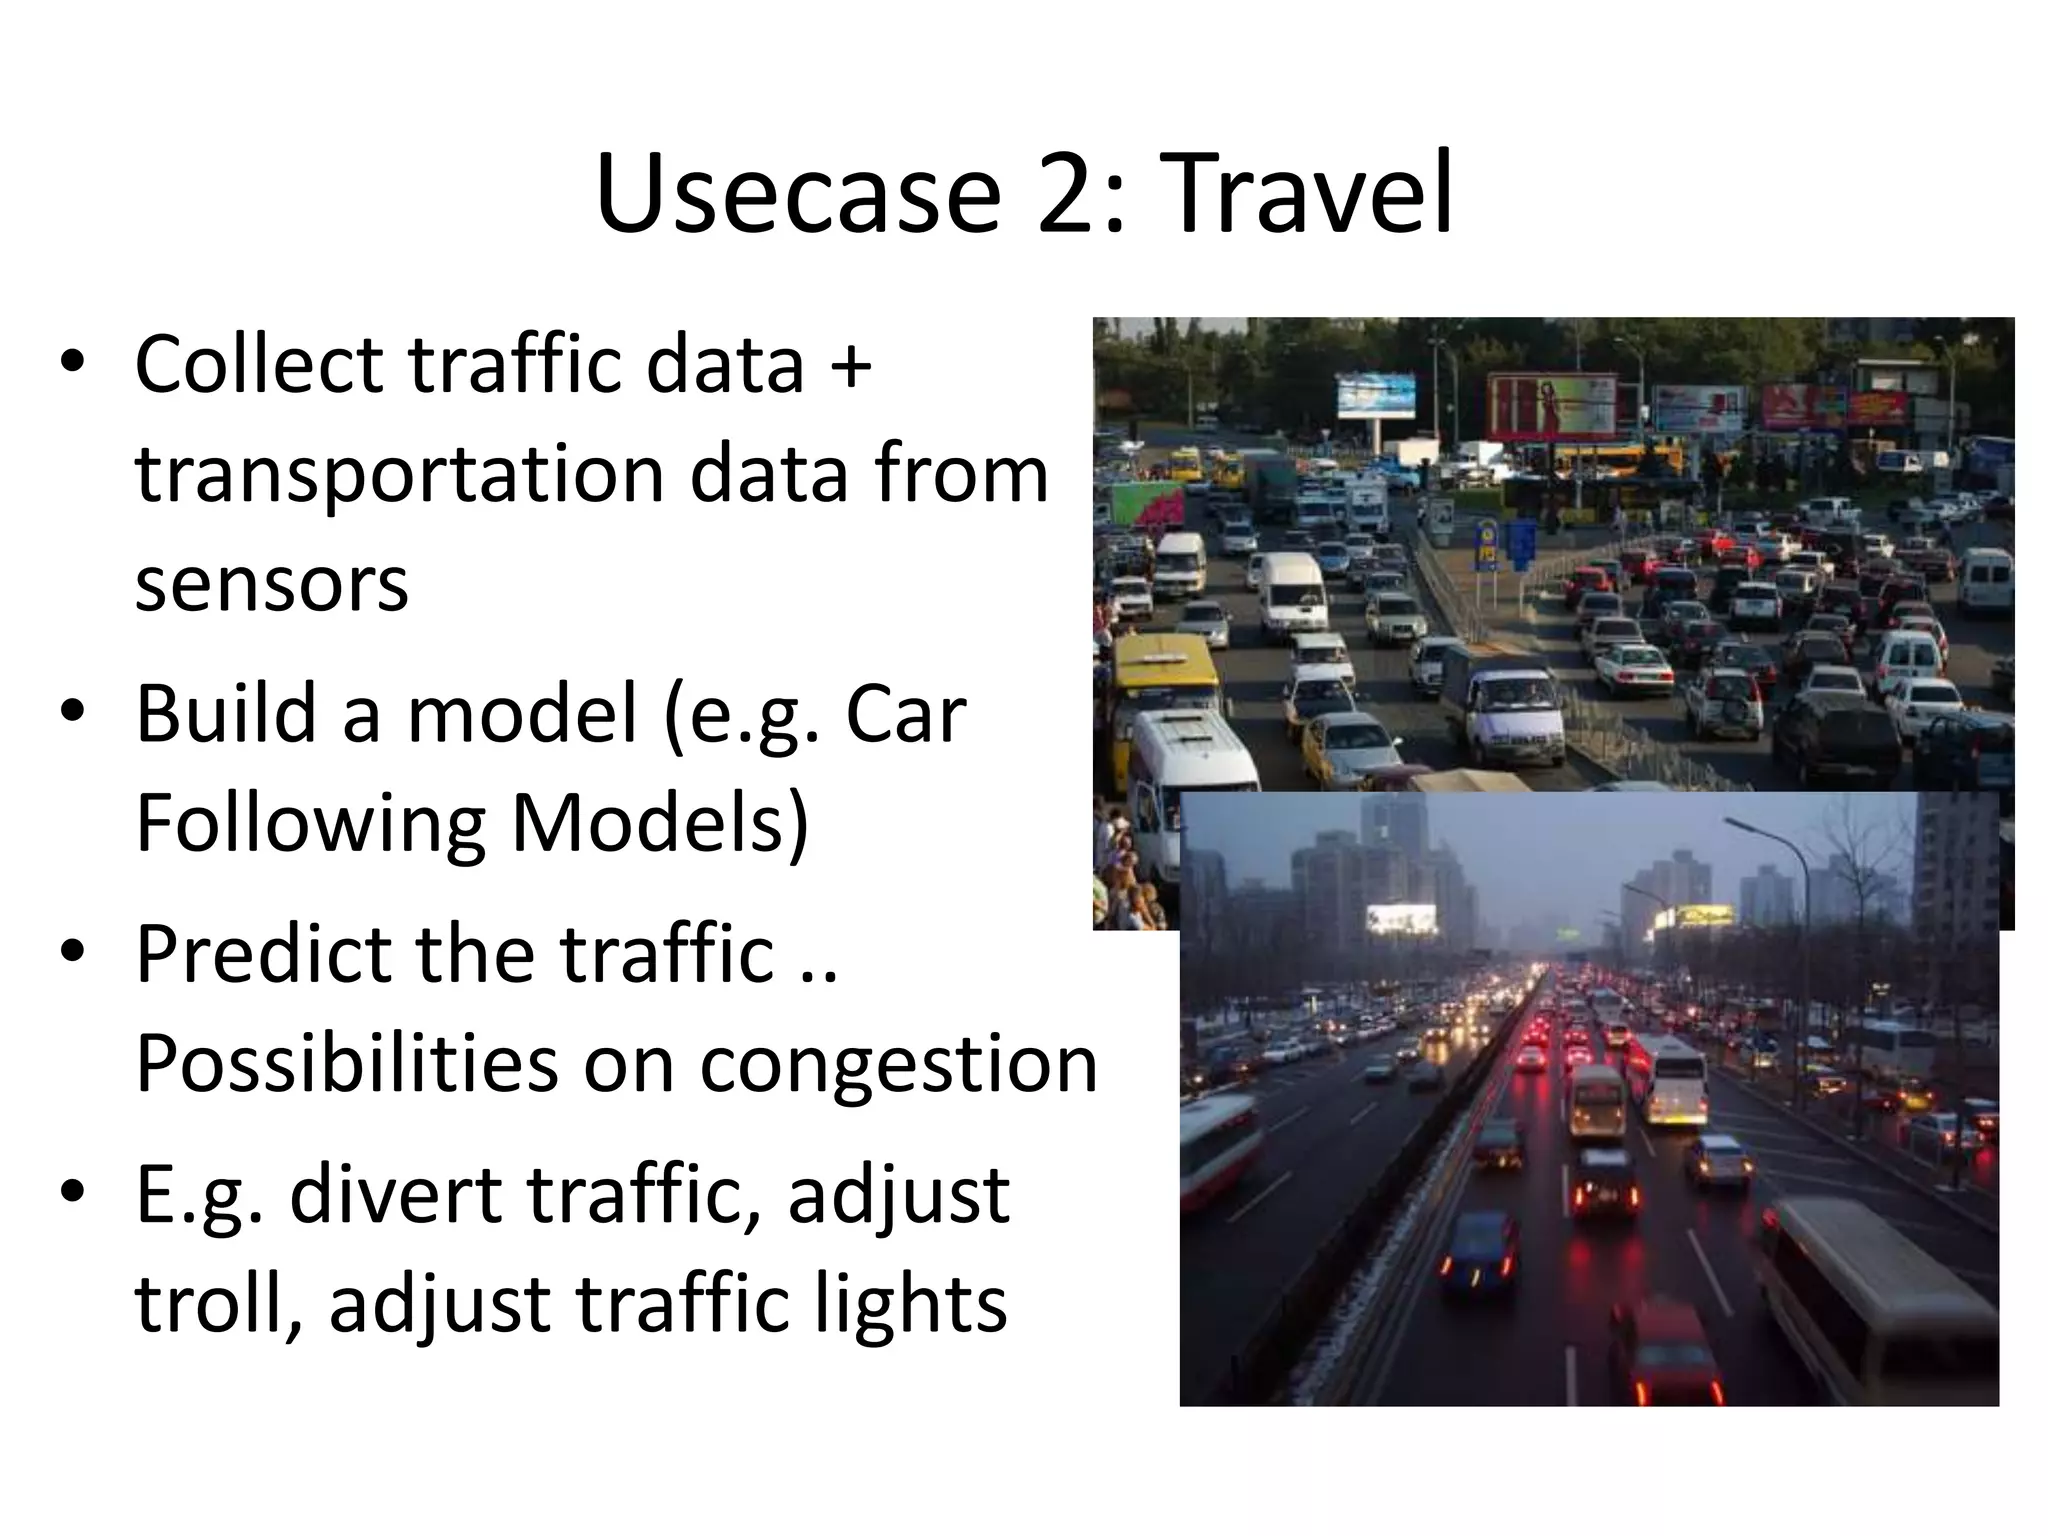
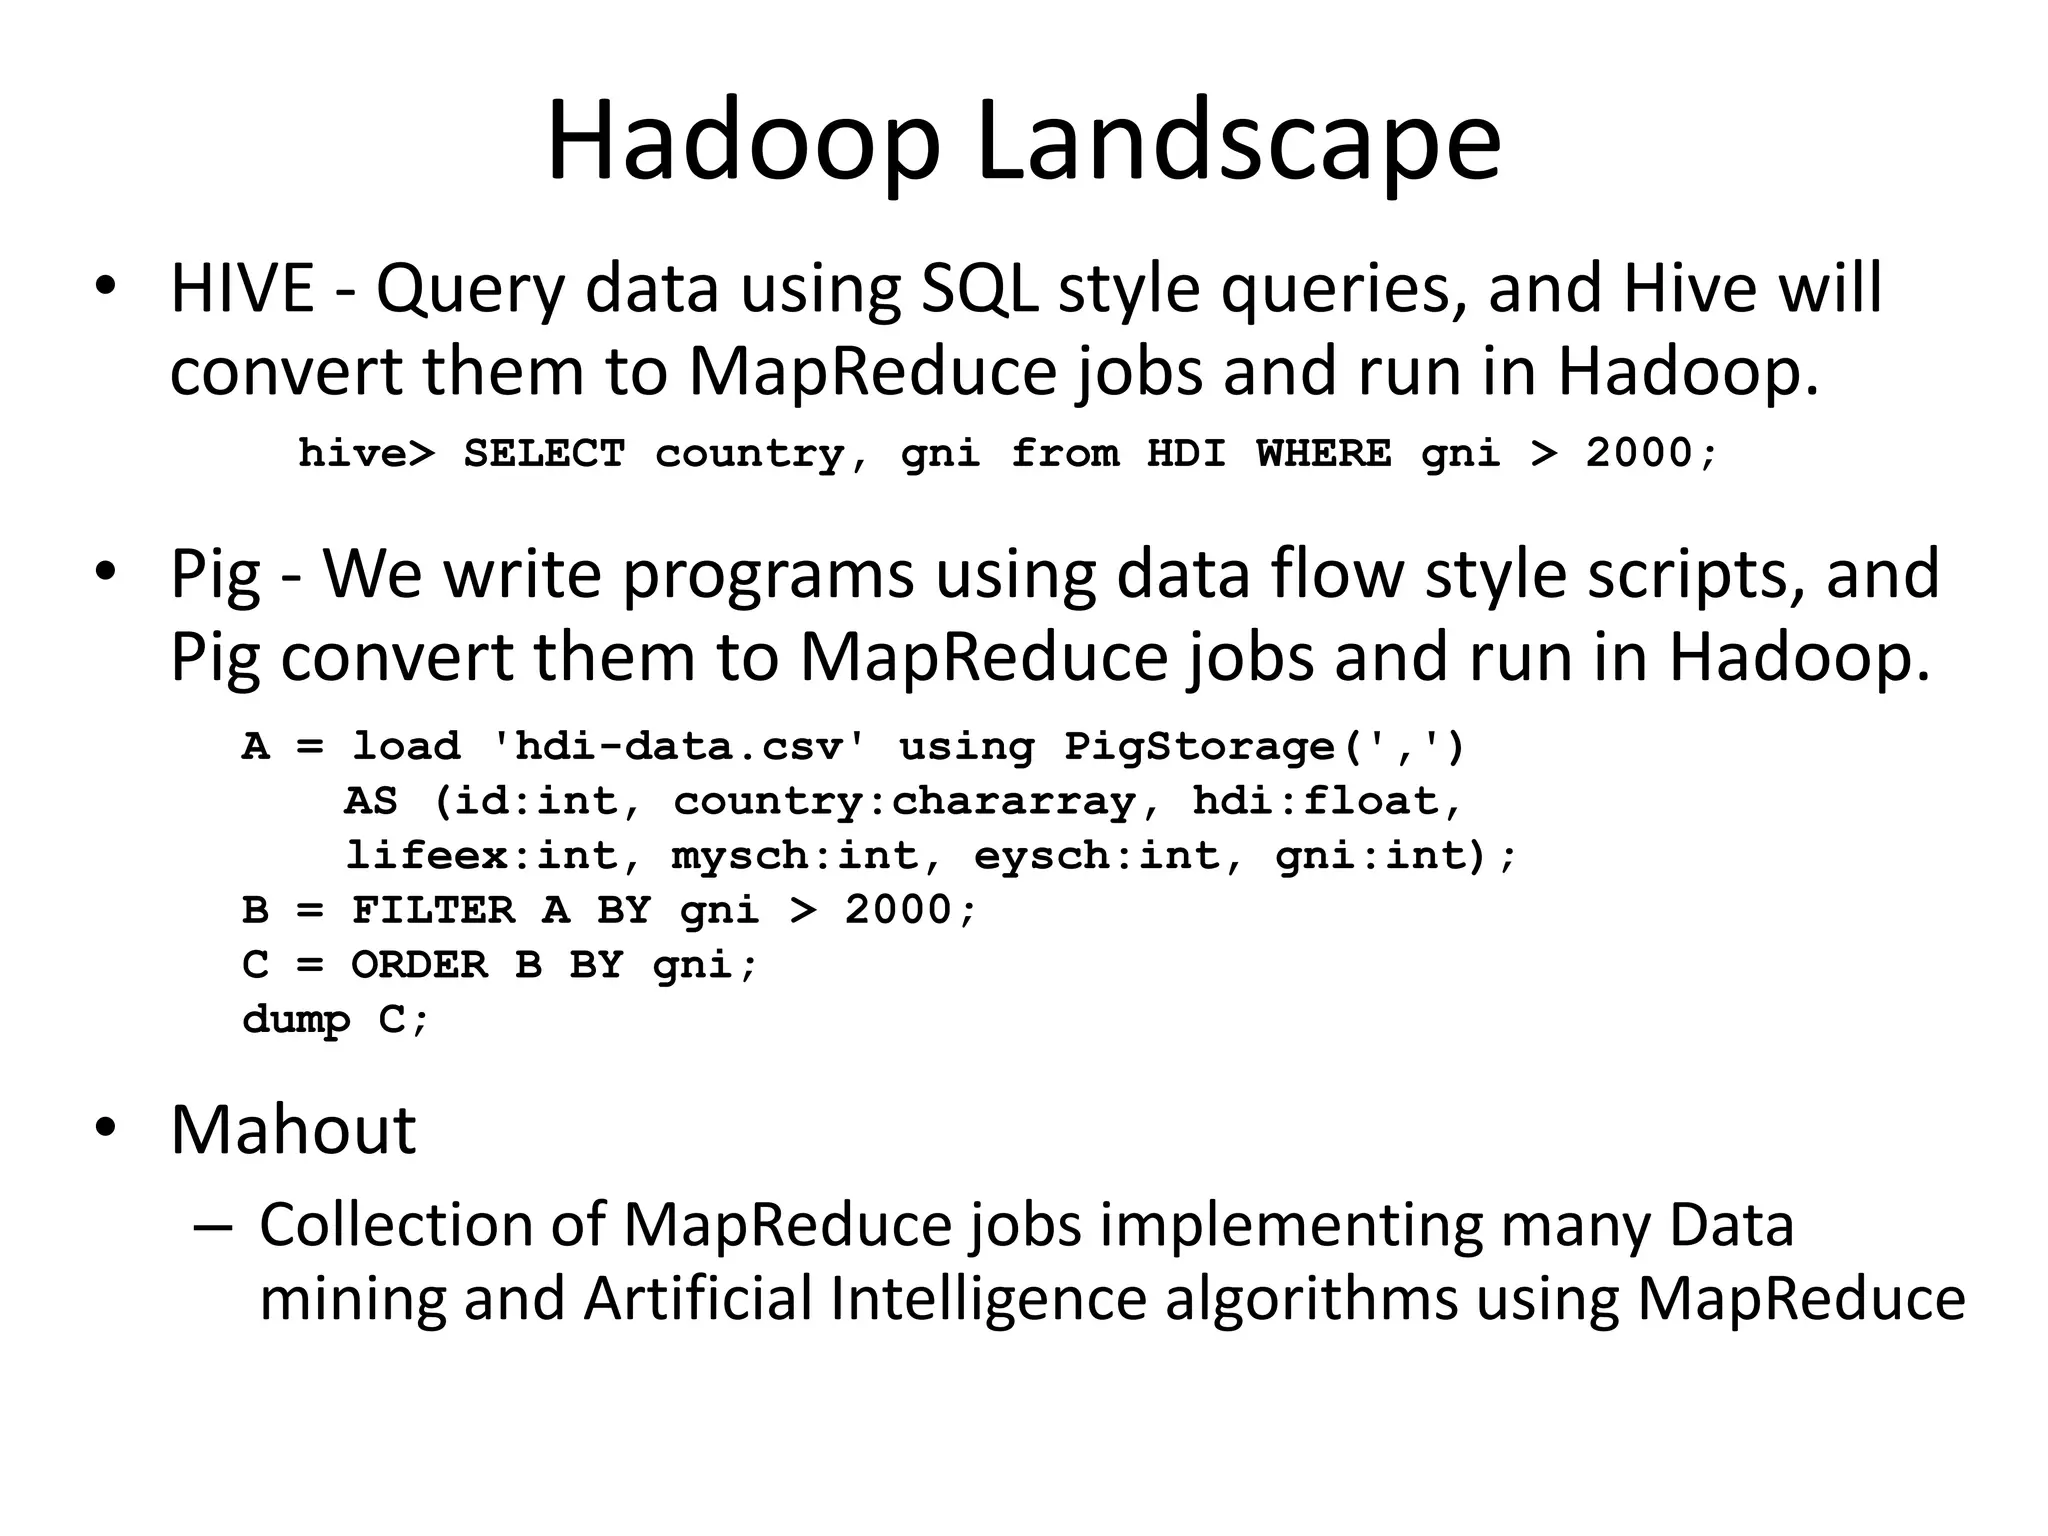
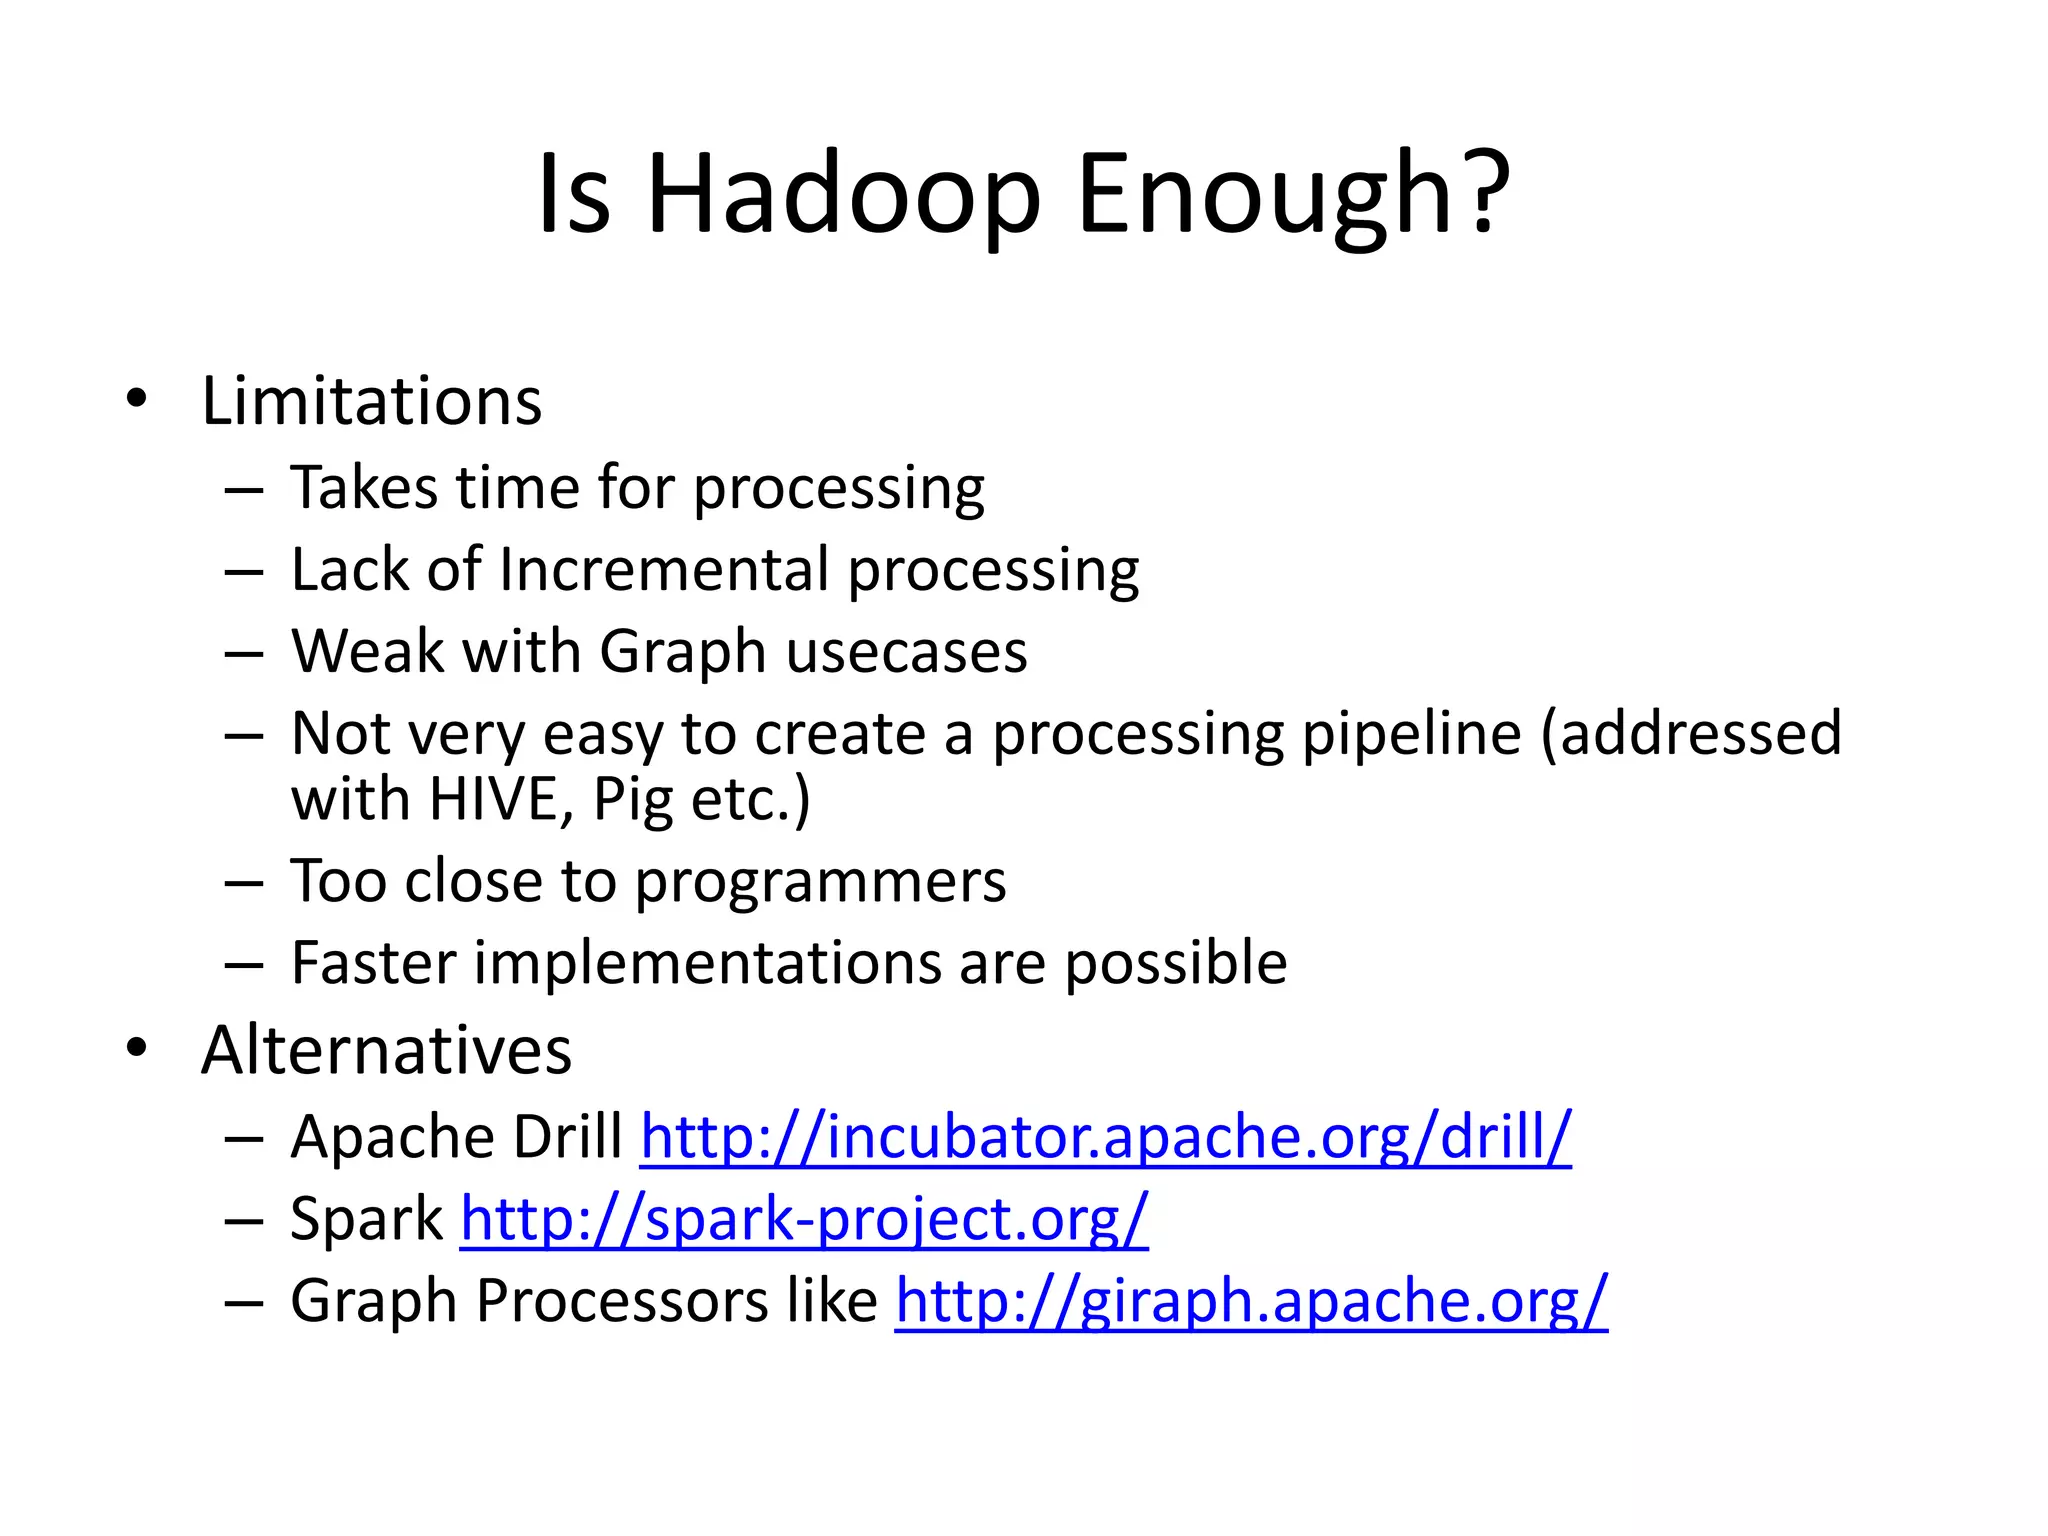
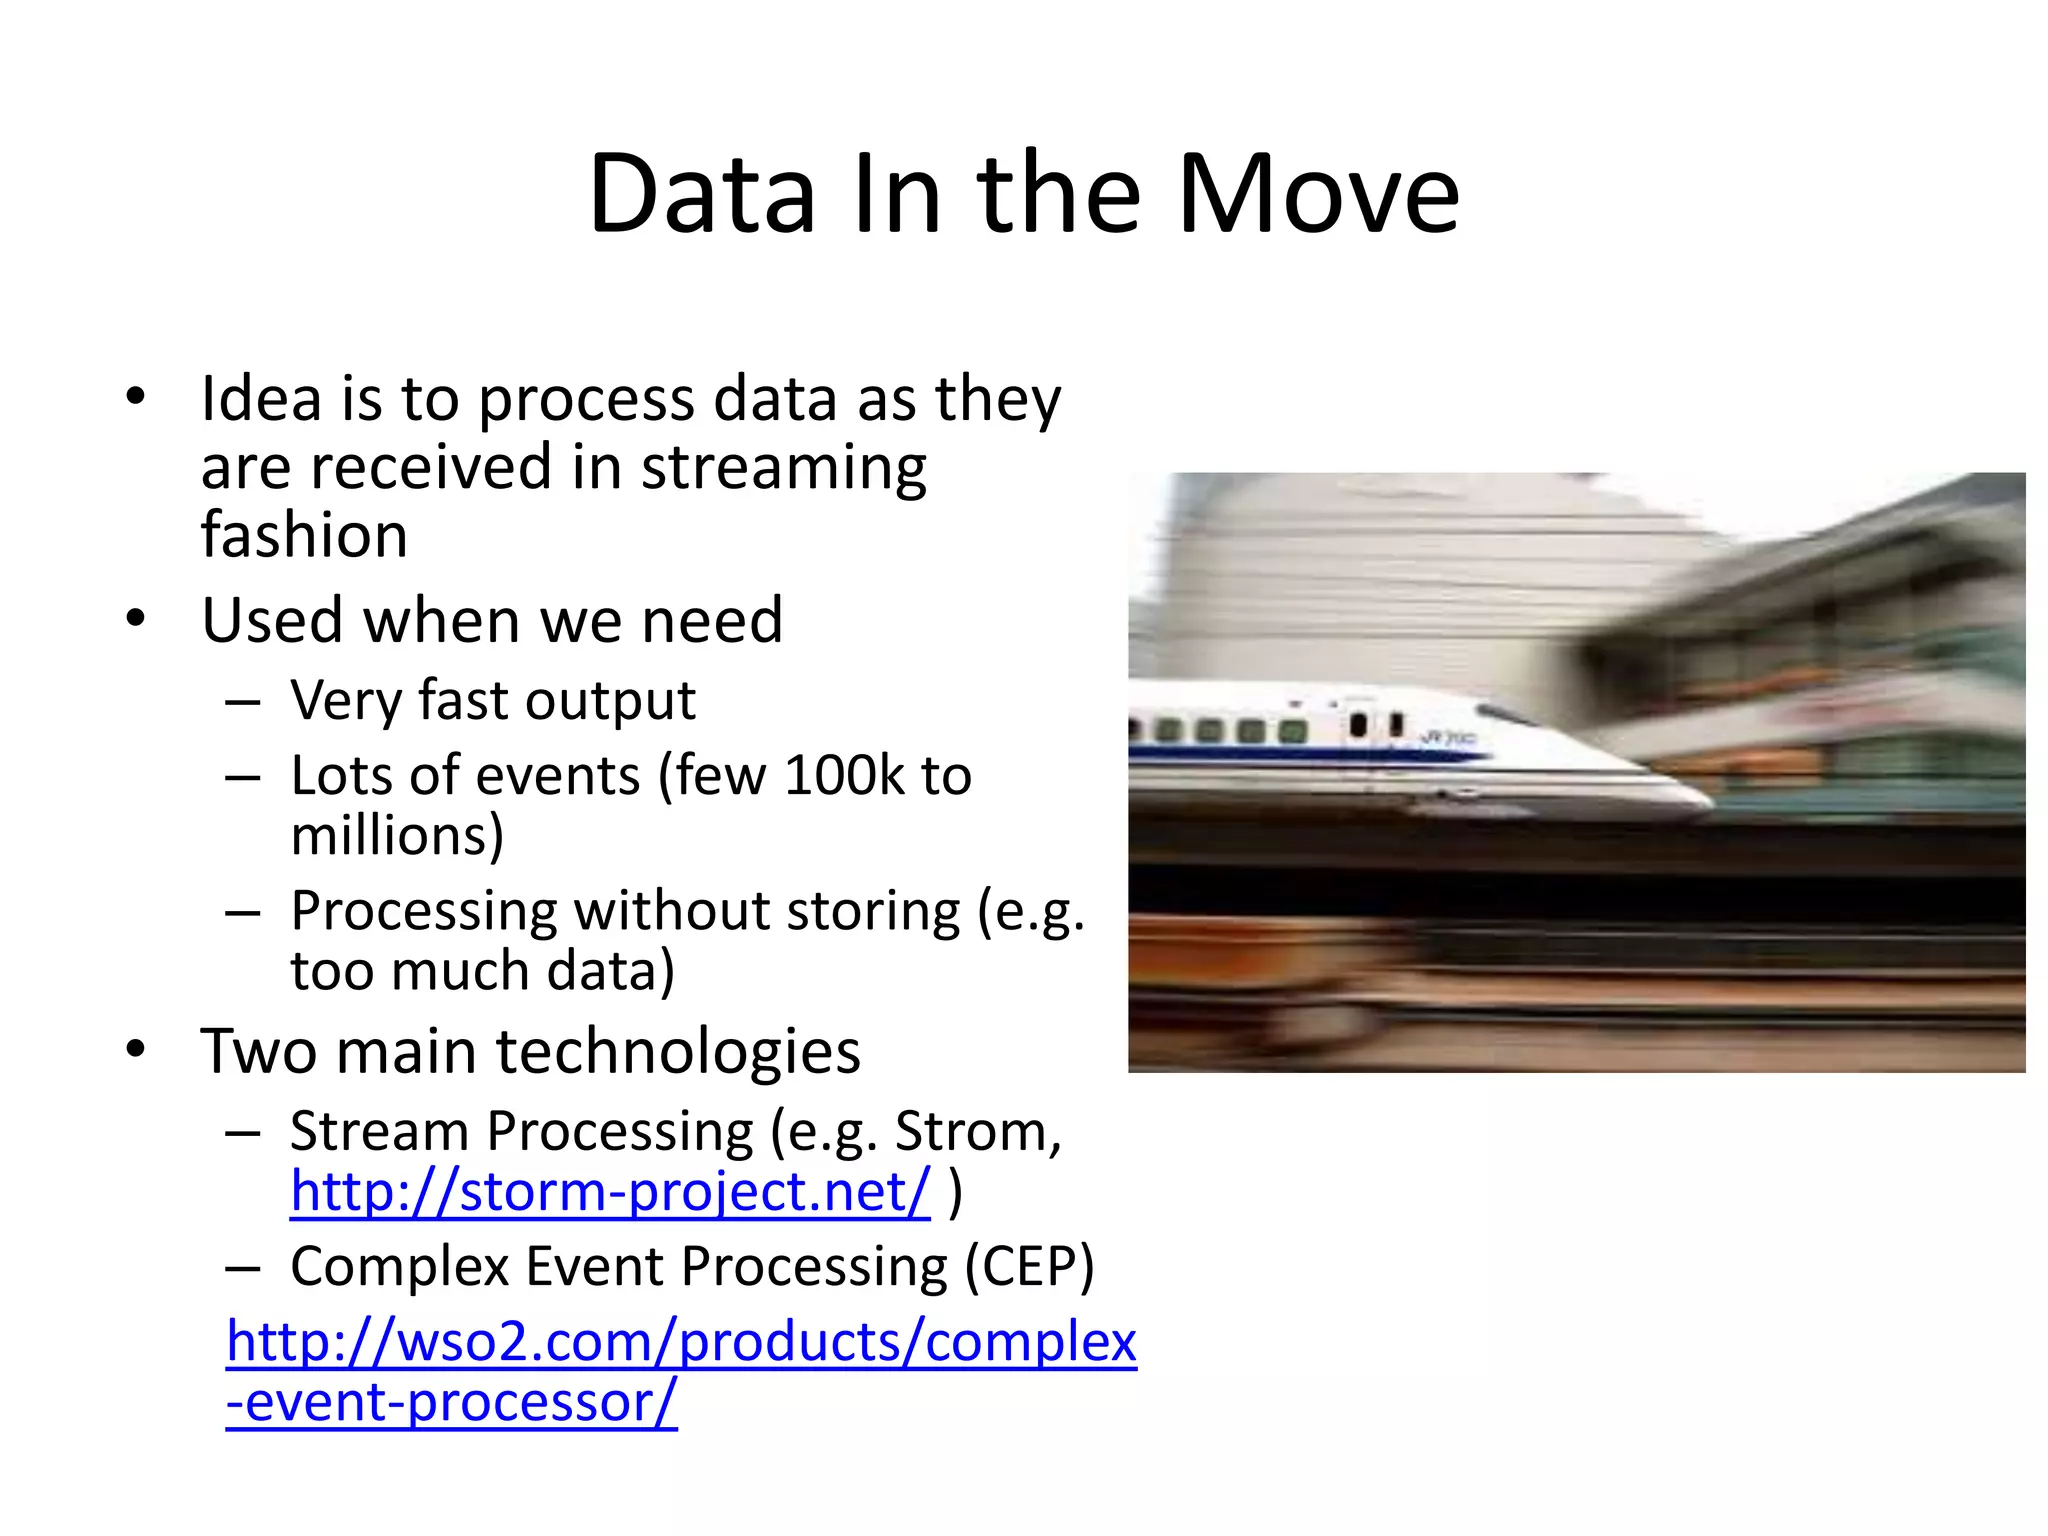
This document provides an overview of big data and how it can be used to forecast and predict outcomes. It discusses how large amounts of data are now being collected from various sources like the internet, sensors, and real-world transactions. This data is stored and processed using technologies like MapReduce, Hadoop, stream processing, and complex event processing to discover patterns, build models, and make predictions. Examples of current predictions include weather forecasts, traffic patterns, and targeted marketing recommendations. The document outlines challenges in big data like processing speed, security, and privacy, but argues that with the right techniques big data can help further human goals of understanding, explaining, and anticipating what will happen in the future.


![[DSC Europe 25] Jim Sterne - Adopting Generative AI Capabilities Into the Ent...](https://cdn.slidesharecdn.com/ss_thumbnails/sxhpofuorcagxsaulkmt-3-251204082258-7e66bc48-thumbnail.jpg?width=640&height=640&fit=bounds)


![[DSC Europe 25] Marija Vlajkovic & Andrea Radonjanin - Integration of AI tool...](https://cdn.slidesharecdn.com/ss_thumbnails/qf1jrglttoc3bm8s3aop-final-integration-of-ai-tools-251208151905-394f3a6a-thumbnail.jpg?width=640&height=640&fit=bounds)


![[DSC Europe 25] Andy Cotgreave - Nothing is new in analytics.pptx](https://cdn.slidesharecdn.com/ss_thumbnails/mba4vzcurvoh5lfrd5zw-6-251205194645-341bbbbe-thumbnail.jpg?width=640&height=640&fit=bounds)

![[DSC Europe 25] Dusan Jovicic - AI Story: From on-prem to cloud and back agai...](https://cdn.slidesharecdn.com/ss_thumbnails/8kp49m6uq22ifnbwhfnk-2-251205085715-964d11a6-thumbnail.jpg?width=640&height=640&fit=bounds)

![[DSC Europe 25] Goran Obradovic - The Rise of Sovereign AI: Building the Regi...](https://cdn.slidesharecdn.com/ss_thumbnails/7nw2xxixrxqdxvrb5wca-6-251205085714-ab09a2ac-thumbnail.jpg?width=640&height=640&fit=bounds)