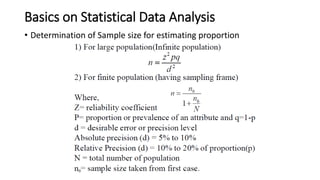
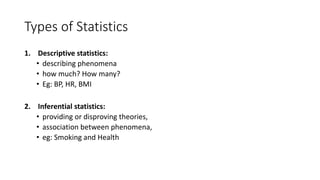
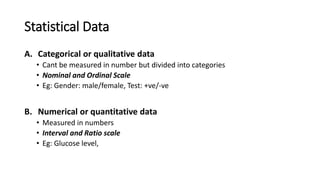
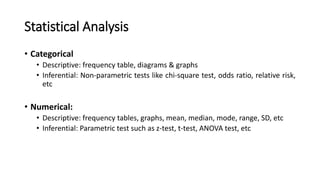
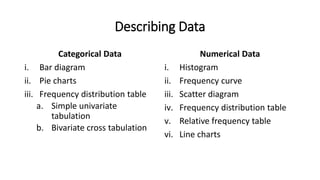
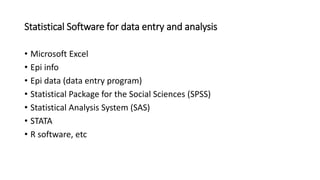
BASIC STATISTICS
Dipesh Tamrakar
MSc. Clin. Biochemistry
1
Basics on Statistical Data Analysis
• Determination of Sample size for estimating proportion
• Ex: Prevalence of DM of aged 30-50 yrs age according to DM Study
Nepal 2017 is 10% ; accepting only 5% error and CI 95%, the sample
size calculation:
n = z2pq/d2 (z = 1.96 for 95% CI)
n =138
• If population of 30-50 yrs is given 500, then
n = n0/(1 + n0/N)
n = 138/(1+ 138/500)
n = 109
Types of Statistics
1. Descriptive statistics:
• describing phenomena
• how much? How many?
• Eg: BP, HR, BMI
2. Inferential statistics:
• providing or disproving theories,
• association between phenomena,
• eg: Smoking and Health
Statistical Data
A. Categorical or qualitative data
• Cant be measured in number but divided into categories
• Nominal and Ordinal Scale
• Eg: Gender: male/female, Test: +ve/-ve
B. Numerical or quantitative data
• Measured in numbers
• Interval and Ratio scale
• Eg: Glucose level,
Statistical Analysis
• Categorical
• Descriptive: frequency table, diagrams & graphs
• Inferential: Non-parametric tests like chi-square test, odds ratio, relative risk,
etc
• Numerical:
• Descriptive: frequency tables, graphs, mean, median, mode, range, SD, etc
• Inferential: Parametric test such as z-test, t-test, ANOVA test, etc
Describing Data
Categorical Data
i. Bar diagram
ii. Pie charts
iii. Frequency distribution table
a. Simple univariate
tabulation
b. Bivariate cross tabulation
Numerical Data
i. Histogram
ii. Frequency curve
iii. Scatter diagram
iv. Frequency distribution table
v. Relative frequency table
vi. Line charts
Choice of test (test of significance)
 Independent test:
• Normal distribution: t-test
• Non-normal distribution: Mann Whitney U test
 Dependent test:
• Normal distribution: Paired t-test
• Non-normal distribution: Wilcoxon matched pairs signed rank test
 For more than two means: ANOVA test
 For association between 2 categorical variables: Chi-square test
 For relationship between 2 quantitative variables: Pearson correlation
coefficient
 For relationship between 2 ordinal variables: Spearman rank
correlation coefficient
 Test of normality: Kolmogorov Smirnov test
Nominal or Categorical Statistical Analysis (frequencies)
Sample characteristic Statistical test
One sample Chi-square
Two samples
Independent sample
Chi-square (large sample,n>50)
Fisher’s Exact test (small sample)
Dependent sample McNemar Change test
Multiple sample statistical test Chi-square
Measures of association Phi coefficient
Quantitative Statistical Analysis
Normal distribution (parametric test): test for mean
Sample characteristic Statistical test
One sample Z-test and t-test
Two samples
Independent Independent t-test (t unpaired test)
Dependent Dependent t-test or paired t-test
Multiple sample statistical test Analysis of Variance (ANOVA)
Measures of association
Pearson correlation
Multiple correlation
Simple and multiple regression
Quantitative Statistical Analysis
Non- Normal distribution (Non-parametric test): test for mean
Sample characteristic Statistical test
One sample Kolmgorov Smirnov test
Two sample
Independent Mann Whitney U test
Dependent
Wilcoxcon Matched Pairs Signed
Rank Test
Multiple sample
statistical test (> 2
sample sets
Independent
Kruskal Wali’s One Way ANOVA by
rank
Dependent Friedmann test (ANOVA)
Measures of association Spearman Rank correlation
Statistical Software for data entry and analysis
• Microsoft Excel
• Epi info
• Epi data (data entry program)
• Statistical Package for the Social Sciences (SPSS)
• Statistical Analysis System (SAS)
• STATA
• R software, etc
THANK YOU

Basics on statistical data analysis

  • 1.
  • 2.
    Basics on StatisticalData Analysis • Determination of Sample size for estimating proportion
  • 4.
    • Ex: Prevalenceof DM of aged 30-50 yrs age according to DM Study Nepal 2017 is 10% ; accepting only 5% error and CI 95%, the sample size calculation: n = z2pq/d2 (z = 1.96 for 95% CI) n =138 • If population of 30-50 yrs is given 500, then n = n0/(1 + n0/N) n = 138/(1+ 138/500) n = 109
  • 5.
    Types of Statistics 1.Descriptive statistics: • describing phenomena • how much? How many? • Eg: BP, HR, BMI 2. Inferential statistics: • providing or disproving theories, • association between phenomena, • eg: Smoking and Health
  • 6.
    Statistical Data A. Categoricalor qualitative data • Cant be measured in number but divided into categories • Nominal and Ordinal Scale • Eg: Gender: male/female, Test: +ve/-ve B. Numerical or quantitative data • Measured in numbers • Interval and Ratio scale • Eg: Glucose level,
  • 7.
    Statistical Analysis • Categorical •Descriptive: frequency table, diagrams & graphs • Inferential: Non-parametric tests like chi-square test, odds ratio, relative risk, etc • Numerical: • Descriptive: frequency tables, graphs, mean, median, mode, range, SD, etc • Inferential: Parametric test such as z-test, t-test, ANOVA test, etc
  • 8.
    Describing Data Categorical Data i.Bar diagram ii. Pie charts iii. Frequency distribution table a. Simple univariate tabulation b. Bivariate cross tabulation Numerical Data i. Histogram ii. Frequency curve iii. Scatter diagram iv. Frequency distribution table v. Relative frequency table vi. Line charts
  • 9.
    Choice of test(test of significance)  Independent test: • Normal distribution: t-test • Non-normal distribution: Mann Whitney U test  Dependent test: • Normal distribution: Paired t-test • Non-normal distribution: Wilcoxon matched pairs signed rank test  For more than two means: ANOVA test  For association between 2 categorical variables: Chi-square test  For relationship between 2 quantitative variables: Pearson correlation coefficient  For relationship between 2 ordinal variables: Spearman rank correlation coefficient  Test of normality: Kolmogorov Smirnov test
  • 10.
    Nominal or CategoricalStatistical Analysis (frequencies) Sample characteristic Statistical test One sample Chi-square Two samples Independent sample Chi-square (large sample,n>50) Fisher’s Exact test (small sample) Dependent sample McNemar Change test Multiple sample statistical test Chi-square Measures of association Phi coefficient
  • 11.
    Quantitative Statistical Analysis Normaldistribution (parametric test): test for mean Sample characteristic Statistical test One sample Z-test and t-test Two samples Independent Independent t-test (t unpaired test) Dependent Dependent t-test or paired t-test Multiple sample statistical test Analysis of Variance (ANOVA) Measures of association Pearson correlation Multiple correlation Simple and multiple regression
  • 12.
    Quantitative Statistical Analysis Non-Normal distribution (Non-parametric test): test for mean Sample characteristic Statistical test One sample Kolmgorov Smirnov test Two sample Independent Mann Whitney U test Dependent Wilcoxcon Matched Pairs Signed Rank Test Multiple sample statistical test (> 2 sample sets Independent Kruskal Wali’s One Way ANOVA by rank Dependent Friedmann test (ANOVA) Measures of association Spearman Rank correlation
  • 13.
    Statistical Software fordata entry and analysis • Microsoft Excel • Epi info • Epi data (data entry program) • Statistical Package for the Social Sciences (SPSS) • Statistical Analysis System (SAS) • STATA • R software, etc
  • 14.

Editor's Notes

  • #11 Independent: two outcomes from two different subjects Dependent: two outcomes from the same subjects
  • #12 Independent: two outcomes from two different subjects Dependent: two outcomes from the same subjects
  • #13 Independent: two outcomes from two different subjects Dependent: two outcomes from the same subjects