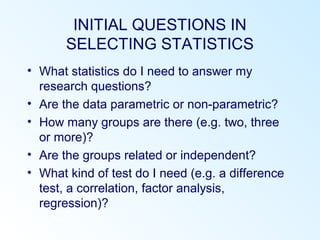
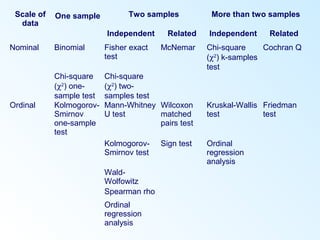
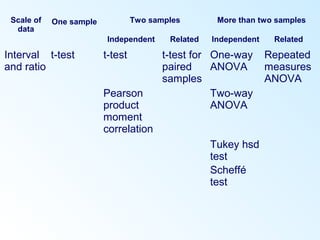
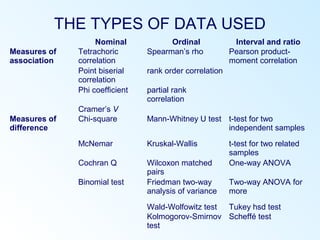
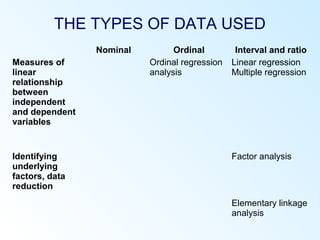
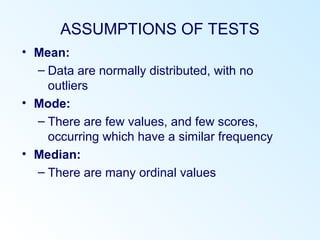
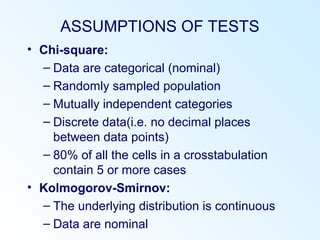
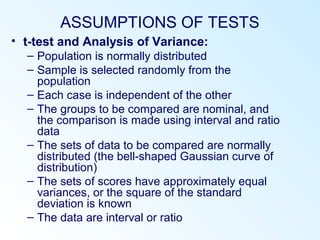
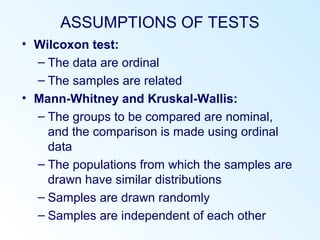
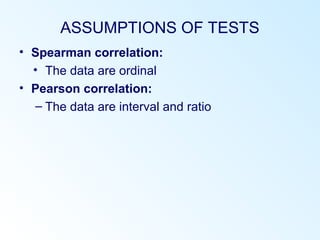
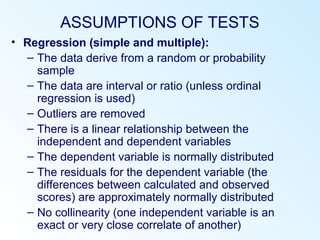
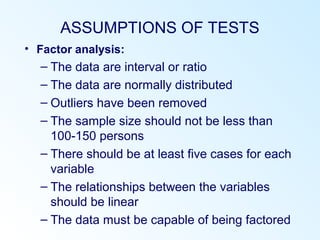
CHOOSING A STATISTICAL
TEST
© LOUIS COHEN, LAWRENCE
MANION & KEITH MORRISON
STRUCTURE OF THE CHAPTER
• How many samples?
• The types of data used
• Choosing the right statistic
• Assumptions of tests
• What statistics do I need to answer my
research questions?
• Are the data parametric or non-parametric?
• How many groups are there (e.g. two, three
or more)?
• Are the groups related or independent?
• What kind of test do I need (e.g. a difference
test, a correlation, factor analysis,
regression)?
INITIAL QUESTIONS IN
SELECTING STATISTICS
Scale of
data
One sample Two samples More than two samples
Independent Related Independent Related
Nominal Binomial Fisher exact
test
McNemar Chi-square
(χ2
) k-samples
test
Cochran Q
Chi-square
(χ2
) one-
sample test
Chi-square
(χ2
) two-
samples test
Ordinal Kolmogorov-
Smirnov
one-sample
test
Mann-Whitney
U test
Wilcoxon
matched
pairs test
Kruskal-Wallis
test
Friedman
test
Kolmogorov-
Smirnov test
Sign test Ordinal
regression
analysis
Wald-
Wolfowitz
Spearman rho
Ordinal
regression
analysis
Scale of
data
One sample Two samples More than two samples
Independent Related Independent Related
Interval
and ratio
t-test t-test t-test for
paired
samples
One-way
ANOVA
Repeated
measures
ANOVA
Pearson
product
moment
correlation
Two-way
ANOVA
Tukey hsd
test
Scheffé
test
THE TYPES OF DATA USED
Nominal Ordinal Interval and ratio
Measures of
association
Tetrachoric
correlation
Spearman’s rho Pearson product-
moment correlation
Point biserial
correlation
rank order correlation
Phi coefficient partial rank
correlation
Cramer’s V
Measures of
difference
Chi-square Mann-Whitney U test t-test for two
independent samples
McNemar Kruskal-Wallis t-test for two related
samples
Cochran Q Wilcoxon matched
pairs
One-way ANOVA
Binomial test Friedman two-way
analysis of variance
Two-way ANOVA for
more
Wald-Wolfowitz test Tukey hsd test
Kolmogorov-Smirnov
test
Scheffé test
THE TYPES OF DATA USED
Nominal Ordinal Interval and ratio
Measures of
linear
relationship
between
independent
and dependent
variables
Ordinal regression
analysis
Linear regression
Multiple regression
Identifying
underlying
factors, data
reduction
Factor analysis
Elementary linkage
analysis
ASSUMPTIONS OF TESTS
• Mean:
– Data are normally distributed, with no
outliers
• Mode:
– There are few values, and few scores,
occurring which have a similar frequency
• Median:
– There are many ordinal values
ASSUMPTIONS OF TESTS
• Chi-square:
– Data are categorical (nominal)
– Randomly sampled population
– Mutually independent categories
– Discrete data(i.e. no decimal places
between data points)
– 80% of all the cells in a crosstabulation
contain 5 or more cases
• Kolmogorov-Smirnov:
– The underlying distribution is continuous
– Data are nominal
ASSUMPTIONS OF TESTS
• t-test and Analysis of Variance:
– Population is normally distributed
– Sample is selected randomly from the
population
– Each case is independent of the other
– The groups to be compared are nominal, and
the comparison is made using interval and ratio
data
– The sets of data to be compared are normally
distributed (the bell-shaped Gaussian curve of
distribution)
– The sets of scores have approximately equal
variances, or the square of the standard
deviation is known
– The data are interval or ratio
ASSUMPTIONS OF TESTS
• Wilcoxon test:
– The data are ordinal
– The samples are related
• Mann-Whitney and Kruskal-Wallis:
– The groups to be compared are nominal,
and the comparison is made using ordinal
data
– The populations from which the samples are
drawn have similar distributions
– Samples are drawn randomly
– Samples are independent of each other
ASSUMPTIONS OF TESTS
• Spearman correlation:
• The data are ordinal
• Pearson correlation:
– The data are interval and ratio
ASSUMPTIONS OF TESTS
• Regression (simple and multiple):
– The data derive from a random or probability
sample
– The data are interval or ratio (unless ordinal
regression is used)
– Outliers are removed
– There is a linear relationship between the
independent and dependent variables
– The dependent variable is normally distributed
– The residuals for the dependent variable (the
differences between calculated and observed
scores) are approximately normally distributed
– No collinearity (one independent variable is an
exact or very close correlate of another)
ASSUMPTIONS OF TESTS
• Factor analysis:
– The data are interval or ratio
– The data are normally distributed
– Outliers have been removed
– The sample size should not be less than
100-150 persons
– There should be at least five cases for each
variable
– The relationships between the variables
should be linear
– The data must be capable of being factored

Chapter38

  • 1.
    CHOOSING A STATISTICAL TEST ©LOUIS COHEN, LAWRENCE MANION & KEITH MORRISON
  • 2.
    STRUCTURE OF THECHAPTER • How many samples? • The types of data used • Choosing the right statistic • Assumptions of tests
  • 3.
    • What statisticsdo I need to answer my research questions? • Are the data parametric or non-parametric? • How many groups are there (e.g. two, three or more)? • Are the groups related or independent? • What kind of test do I need (e.g. a difference test, a correlation, factor analysis, regression)? INITIAL QUESTIONS IN SELECTING STATISTICS
  • 4.
    Scale of data One sampleTwo samples More than two samples Independent Related Independent Related Nominal Binomial Fisher exact test McNemar Chi-square (χ2 ) k-samples test Cochran Q Chi-square (χ2 ) one- sample test Chi-square (χ2 ) two- samples test Ordinal Kolmogorov- Smirnov one-sample test Mann-Whitney U test Wilcoxon matched pairs test Kruskal-Wallis test Friedman test Kolmogorov- Smirnov test Sign test Ordinal regression analysis Wald- Wolfowitz Spearman rho Ordinal regression analysis
  • 5.
    Scale of data One sampleTwo samples More than two samples Independent Related Independent Related Interval and ratio t-test t-test t-test for paired samples One-way ANOVA Repeated measures ANOVA Pearson product moment correlation Two-way ANOVA Tukey hsd test Scheffé test
  • 6.
    THE TYPES OFDATA USED Nominal Ordinal Interval and ratio Measures of association Tetrachoric correlation Spearman’s rho Pearson product- moment correlation Point biserial correlation rank order correlation Phi coefficient partial rank correlation Cramer’s V Measures of difference Chi-square Mann-Whitney U test t-test for two independent samples McNemar Kruskal-Wallis t-test for two related samples Cochran Q Wilcoxon matched pairs One-way ANOVA Binomial test Friedman two-way analysis of variance Two-way ANOVA for more Wald-Wolfowitz test Tukey hsd test Kolmogorov-Smirnov test Scheffé test
  • 7.
    THE TYPES OFDATA USED Nominal Ordinal Interval and ratio Measures of linear relationship between independent and dependent variables Ordinal regression analysis Linear regression Multiple regression Identifying underlying factors, data reduction Factor analysis Elementary linkage analysis
  • 10.
    ASSUMPTIONS OF TESTS •Mean: – Data are normally distributed, with no outliers • Mode: – There are few values, and few scores, occurring which have a similar frequency • Median: – There are many ordinal values
  • 11.
    ASSUMPTIONS OF TESTS •Chi-square: – Data are categorical (nominal) – Randomly sampled population – Mutually independent categories – Discrete data(i.e. no decimal places between data points) – 80% of all the cells in a crosstabulation contain 5 or more cases • Kolmogorov-Smirnov: – The underlying distribution is continuous – Data are nominal
  • 12.
    ASSUMPTIONS OF TESTS •t-test and Analysis of Variance: – Population is normally distributed – Sample is selected randomly from the population – Each case is independent of the other – The groups to be compared are nominal, and the comparison is made using interval and ratio data – The sets of data to be compared are normally distributed (the bell-shaped Gaussian curve of distribution) – The sets of scores have approximately equal variances, or the square of the standard deviation is known – The data are interval or ratio
  • 13.
    ASSUMPTIONS OF TESTS •Wilcoxon test: – The data are ordinal – The samples are related • Mann-Whitney and Kruskal-Wallis: – The groups to be compared are nominal, and the comparison is made using ordinal data – The populations from which the samples are drawn have similar distributions – Samples are drawn randomly – Samples are independent of each other
  • 14.
    ASSUMPTIONS OF TESTS •Spearman correlation: • The data are ordinal • Pearson correlation: – The data are interval and ratio
  • 15.
    ASSUMPTIONS OF TESTS •Regression (simple and multiple): – The data derive from a random or probability sample – The data are interval or ratio (unless ordinal regression is used) – Outliers are removed – There is a linear relationship between the independent and dependent variables – The dependent variable is normally distributed – The residuals for the dependent variable (the differences between calculated and observed scores) are approximately normally distributed – No collinearity (one independent variable is an exact or very close correlate of another)
  • 16.
    ASSUMPTIONS OF TESTS •Factor analysis: – The data are interval or ratio – The data are normally distributed – Outliers have been removed – The sample size should not be less than 100-150 persons – There should be at least five cases for each variable – The relationships between the variables should be linear – The data must be capable of being factored