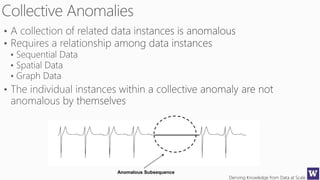
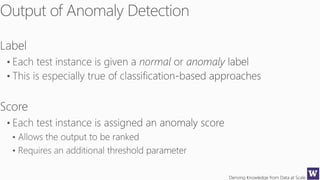
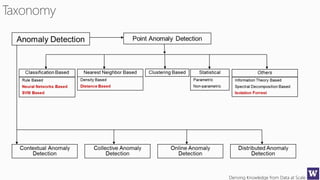
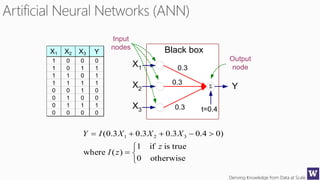
Download to read offline


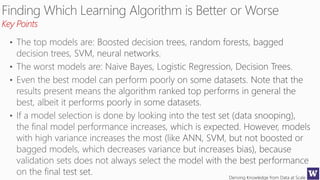
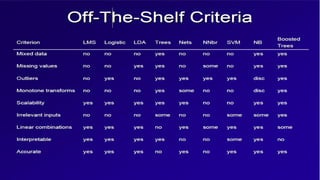


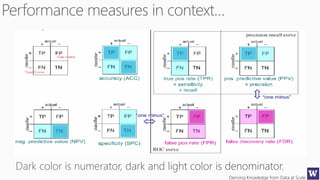
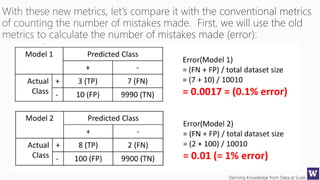
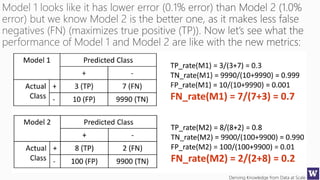


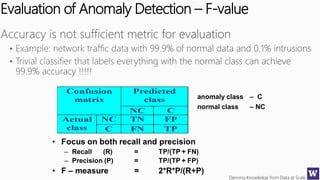


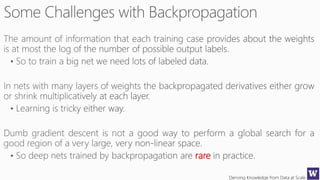
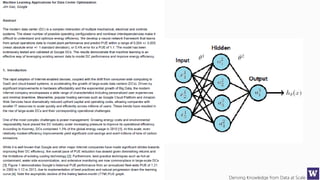


The document discusses various machine learning concepts like model overfitting, underfitting, missing values, stratification, feature selection, and incremental model building. It also discusses techniques for dealing with overfitting and underfitting like adding regularization. Feature engineering techniques like feature selection and creation are important preprocessing steps. Evaluation metrics like precision, recall, F1 score and NDCG are discussed for classification and ranking problems. The document emphasizes the importance of feature engineering and proper model evaluation.


![[ppt]](https://cdn.slidesharecdn.com/ss_thumbnails/ppt2931-thumbnail.jpg?width=640&height=640&fit=bounds)
![[ppt]](https://cdn.slidesharecdn.com/ss_thumbnails/ppt3441-thumbnail.jpg?width=640&height=640&fit=bounds)


![[DSC Europe 25] Danilo Djukanovic - From Vibes to KPIs: Turning Culture Into ...](https://cdn.slidesharecdn.com/ss_thumbnails/inqestws5wf0cik2glgv-3-danilo-djukanovic-from-vibes-to-kpis-presentation-260114111931-dacff81f-thumbnail.jpg?width=640&height=640&fit=bounds)
![[DSC Europe 25] Srba Markovic - From Pilot to Production: Overcoming AI Deplo...](https://cdn.slidesharecdn.com/ss_thumbnails/yjjmrtytmwbalxlba7px-4-srba-markovic-from-pilot-to-production-overcoming-ai-deployment-blockers-with-260114111931-4a892d44-thumbnail.jpg?width=640&height=640&fit=bounds)
![[DSC Europe 25] Stefan Brankovic - #ResumeIsDead. AI-Powered Interviews and C...](https://cdn.slidesharecdn.com/ss_thumbnails/qnmbsv0xq3uysdrq3sev-2-stefan-brankovic-job-bolt-260114111931-a065aa3d-thumbnail.jpg?width=640&height=640&fit=bounds)
![[DSC Europe 25] Ivan Lukovic & Marija Djukic - From Data to Value: Why Maturi...](https://cdn.slidesharecdn.com/ss_thumbnails/ahrfps8xr6knowwhacxh-1-ivan-marija-dsc-2025-ld-v1-presentation-260115093812-be21adfc-thumbnail.jpg?width=640&height=640&fit=bounds)


![[DSC Europe 25] Slobodan Dolinic - Smart and Intelligent Green Region.pptx](https://cdn.slidesharecdn.com/ss_thumbnails/0bribinjsp6ghwtvsvor-2-sigre-slobodan-dolinic-260115093812-c9c10e90-thumbnail.jpg?width=640&height=640&fit=bounds)


