Download to read offline
![© 2018, IRJET | Impact Factor value: 7.211 | ISO 9001:2008 Certified Journal | Page 1298
accuracy, precision, recall,f1-score and time on various
datasets.
2. Issues Regarding Classification
The following issues are important to be considered
during classification for data preprocessing and
comparing algorithm:
2.1 Processing Data Before Classification
[1] The following preprocessing steps are applied to the
data to achieve better ,accuracy,efficiency and scalability
of the classification process:-
1.) Data cleaning: This refers to the preprocessing of data
with the view of removing or reducing noise(applying
smoothing technique) ,and treatment of missing values(by
replacing missing value with most commonly occurring
value , or a probable value calculated from statistical
technique).
2.) Relevance analysis:The dataset may contain redundant
attributes. The techniques like correlation analysis can be
used to find out if any two attributes are statistically
related.As an example ,the high correlation between
attribute A1 and A2 ,would result in removal of one of the
attribute.Another relevance analysis is Attribute subset
selection that finds a reduced set of attributes , such that
the attained probability distribution of data classes is as
near as possible to the original probability distribution
using all attributes. This is how we detect attributes that
do not contribute to classification. In theory ,the time
spent consumed on relevance analysis ,when added to the
time consumed on learning from the derived reduced set
of attributes, should be less than the time consumed in
learning from original set of attributes. Hence this step can
improve upon classification efficiency and scalability.
3.) Data Transformation and Reduction: Sometimes the
dataset ,may be required to be transformed by
normalization, especially when algorithm like "back
propagation of neural network" is used which requires
numerical values to be provided into input layer ,or
algorithm like "K-NN" which requires distance measure.
Normalization is done by scaling all values of an attribute
under consideration , so that they lie within a specified
range, such as -1.0 to 1.0 or 0.0 to 1.0.This prevents
attributes that are initially large range like "salary" from
outweighing the effect of small range binary attributes.
Generalizing the data to a higher level concept is also a
way of transforming data. To do it we apply knowledge of
concept hierarchy. Let us take an example of continuous
valued attribute like “salary” that has numeric values,
these numeric values can be generalized to discrete ranges
, such as below average ,average and above average. In a
similar manner attribute like street can be generalized to a
higher level like city. Since generalization is compressing
data, a small number of input/output operations are
involved during learning.
2.2 Criteria of Comparing Classification
[1]1.) Accuracy: The accuracy of a classifier refers to the
ability of a given classifier to correctly predict the class
label of unseen data.
2.) Speed: This refers to to the computational cost in
involved building model,and using it.
3.) Robustness: This is the ability of the classifier to make
correct prediction, even it the data is noisy, and have
missing value.
4.) Scalability: Its is the ability to construct the
classification model efficiently, given large amount of data.
5.) Interpretability: It refers to the ease or extent of
understanding provided by the classifier.
3. Classification Algorithms
3.1 Naïve Bayes
Naive bayes classification algorithm is based on baye's
theorem of posterior probability. This algorithm works by
predicting probability that a given data instance belongs to
a particular class. Data instance is represented by a vector
X=(x1,x2,x3,......,xn) where x1,x2,....,xn are the values of
attributes A1,A2,A3,.....,An in a dataset .The probability that a
given data vector will belong to class C, is called posterior
probability and is denoted by P(C|X) ,probability of C
conditioned on X, similarly the probability that a given
data instance X is known to be in class C is called
likelihood and is denoted by P(X|C), probability of X
conditioned on C, the prior probability of class C is
denoted by P(C),and the prior probability of X is denoted
by P(X).The computation of P(X|C) is done as below from
the assumption of conditional independence between
attributes:
(1)
In the above equation of computing likelihood the term
P(xi|C) denotes the probability that a data instance in
training set has value of attribute Ai=xi and belongs to
class C.
Now by bayes theorem the posterior probability,
probability that a given data instance belongs to class C is
give as:
International Research Journal of Engineering and Technology (IRJET) e-ISSN: 2395-0056
Volume: 05 Issue: 08 | Aug 2018 www.irjet.net p-ISSN: 2395-0072](https://image.slidesharecdn.com/irjet-v5i8223-180919091232/85/IRJET-Study-and-Evaluation-of-Classification-Algorithms-in-Data-Mining-2-320.jpg)
![© 2018, IRJET | Impact Factor value: 7.211 | ISO 9001:2008 Certified Journal | Page 1299
(2)
So, if there are m classes , we find
P(C1|X),P(C2|X),……….,P(Cm|X) and then we classify X into
class Ci such that P(Ci|X) > P(Cj|X) for all jϵ{1,2,3…m} and
j≠i. Since P(X) is constant we have to work with P(X|C)P(C)
in our calculation.
So final formula is Y =Ci for some i as under:
(3)
This is also called maximum posteriori hypothesis.
In case of categorical attribute say Aj the value of P (xj|Ci) is
simply calculated by counting number of tuples that has
value of attribute Aj as xj and belongs to class Ci, divided by
number of tuples of class Ci in D.
In case of continuous valued attribute we apply Gaussian
distribution.
(4)
Many studies have shown that Naive Bayes is comparable
to Decision Tree and Neural network. In theory bayesian
classifier should have minimum error rate but this is not
in practice as some inaccuracies might be crept in due to
assumption of conditional independence between
attributes. It is used in text categorization with
multinomial distribution.
3.2 Multilayer Neural Network classifier based on
Backpropagation Algorithm
[2]Neural network is a set of connected nodes that is an
input/output units, and each connection has a weight
associated with it .The network learns by adjusting its
weight according to training data vectors .The networks
adjusts its weight so as to minimize the mean squared
error between predicted class label and actual class label,
for this it employs gradient descent method. Neural
network learning is also called connectionist learning due
to connections between nodes.
The input layer nodes simply transfer the received input
to output port of that node, where as nodes of hidden
layers and output layers apply sigmoid functions f(x)=
to the received input inj=∑ and outputs value
aj=f(inj).
Fig-1: Diagram of Multilayer Neural network for dataset
with five attributes and three classes
We use sigmoid function as is a non-linear and
differentiable function .It can be shown that f'(x)=f(x)(1-
f(x)) .The weights are updated according to gradient
descent rule with learning rate denoted by Ƞ.
(5) Let
us derive the formula for updating weight connecting
hidden layer with output layer and weight connecting
input layer with hidden layer. Consider the squared error
E which is sum of squared differences between actual class
label and predicted label of nodes in output layer.
(6)
(7)
Similarly
International Research Journal of Engineering and Technology (IRJET) e-ISSN: 2395-0056
Volume: 05 Issue: 08 | Aug 2018 www.irjet.net p-ISSN: 2395-0072](https://image.slidesharecdn.com/irjet-v5i8223-180919091232/85/IRJET-Study-and-Evaluation-of-Classification-Algorithms-in-Data-Mining-3-320.jpg)
![© 2018, IRJET | Impact Factor value: 7.211 | ISO 9001:2008 Certified Journal | Page 1300
(8)
Once we have computed
ijW
E
,
and
jkW
E
,
we update the
weight as under:
(9)
(10)
From the above derivation it is clear that the neural
network adjusts its weight by back propagating a part of
error computed form outer layer to the inner layers, as
that is computed from outer layer is used in computation
of of inner layer.
In the above diagram we have shown a neural network
that can classify data instance in three classes. The input
training data instances is simply feeded into the input
layer in the form of numerical values [a1,a2,a3,a4,a5].If the
data instance belongs to class c1 then out layer should emit
[1,0,0],similarly if it belongs to class c2 it should emits
[0,1,0],and similarly if it belongs to class c3 it should emits
[0,0,1],this is how we label training data instances.
If a neural network has |DS| tuples and Nw number of
weights then time complexity is O(|DS|×Nw).
[3]Neural network has the ability to handle noisy data. It
works well with continuous numeric valued attributes. It
also has ability to classify unknown patterns.
3.3 Decision Tree Classifier
[1]Decision tree learning algorithm is a top-down ,
recursive divide and conquer, greedy algorithm. Decision
tree is a tree like structure in which internal nodes are
labeled by attributes and outgoing edges denotes outcome
of test condition on that attribute while leaf node denotes
classes. Nodes with attributes divides the training dataset
into two or more subsets based on value of attribute, as an
example if we have a node labeled by an attribute age, that
has three values low, medium and high ,then this node will
split the training dataset into three subsets , tuples with
age=low, then tuples with age=medium, next tuple with
age=high ,these test condition are kept on the outgoing
edges. The attribute selection at each stage is done by an
attribute selection measure , that is an heuristic guiding
the splitting criteria, that divides the training dataset best.
The three attribute selection measure are: (Information
gain used in ID3),(Gain ratio used in C 4.5) and (Gini index
used in CART).Then decision tree algorithm works
recursively on remaining subsets of data on outgoing
edges. The algorithm terminates until we get all tuples in
same class in which we label leaf by that class, or other
termination criteria that we get is attribute list empty in
which we label leaf by majority class of tuples in that
subset. The time complexity of decision tree algorithm for
data set with n attributes and |DS| tuples is
O(n×|DS|×log(|DS|)).
Fig-2: Diagram representing Decision Tree[9]
Now we discuss attribute selection measure:
1.) ID3 (Information Gain)Information gain is an attribute
selection measure. It is based on concept of entropy.
Entropy is a measure of surprise or randomness in a
dataset. It also signifies the amount of information
contained in a datasets to classify a tuple. If we are certain
about the event with probability p=1 than entropy will be
zero means no surprise. As an example of all tuples
belongs to same class then entropy is zero. The formula for
calculating entropy in dataset DS that has |C| class:
(11)
,where pi is the probability that an arbitrary tuple belongs
to a class Ci.
So the idea behind this approach is to find attribute that
has more information gain. Information gain is the
measure of the difference between entropy before and
after the dataset DS is split on an attribute A, in more
simple language it measures how much uncertainty is
reduced by splitting. Now equations for computing
information Gain by attribute A that has v distinct values
is as under:
(12)
International Research Journal of Engineering and Technology (IRJET) e-ISSN: 2395-0056
Volume: 05 Issue: 08 | Aug 2018 www.irjet.net p-ISSN: 2395-0072](https://image.slidesharecdn.com/irjet-v5i8223-180919091232/85/IRJET-Study-and-Evaluation-of-Classification-Algorithms-in-Data-Mining-4-320.jpg)
![© 2018, IRJET | Impact Factor value: 7.211 | ISO 9001:2008 Certified Journal | Page 1301
It should be noted that |DS| denotes number of tuples in
dataset DS,while |DSj| refers to number of tuples that has
value of attribute A=Avalj
We choose the attribute with maximum Gain(A)
2.) C.4.5(Gain Ratio)
[1]From above it is quite clear that information Gain is
biased towards selecting attribute with many outcomes.
Some time this can be useless of we have a primary key
like attribute in out training dataset. So C 4.5 is developed
as an extension of ID3.
The equations for calculation to Gain ratio of an attribute
A is as under:
(13)
(14)
We select the attribute with maximum GainRatio(A).
Although gain ratio adjusts for biases, it tends to prefer
unbalanced splits in which one partition is much smaller
than others.
3.)CART(Gini Index)
[19]Gini impurity is a measure of how often a randomly
chosen instance from the dataset would be assigned a
class incorrectly if it was randomly assigned a class
according to the distribution of classes in the dataset.
The Gini impurity can be computed by taking summation
over the probability pi of an data item with class label i
being chosen times the probability ∑ of
assigning incorrect class to that data item.
So to compute gini index of a dataset DS that has |C|
classes, we compute:
(15)
For each attribute A a binary split is considered , for
example if attribute A had three values {a,b,c} that it
subsets are φ ,{a},{b},{c},{a,b},{b,c},{a,c},{a,b,c} out of
which φ and {a,b,c} are not considered so there are 2v-2
ways for binary split that partitions the dataset DS into
two datasets DS1 and DS2,and gini index of DS for a given
partitioning is computed as:
(16)
Next we compute reduction in impurity.
(17)
The attribute that maximizes the reduction in impurity is
selected for splitting.
[1]Gini index is biased towards multivalued attributes. It
has problem when number of class is large. It has a
tendency to favor tests that produces equal-sized
partitions with purity in both partitions.
3.4 Random Forest Classifier
[4]Random forests or random decision forests are an
ensemble learning method for classification, that operate
by constructing a number of decision trees at training time
and outputting the class that is the majority of the classes
outputted from individual trees. Random decision forests
correct for decision tree’s problem of overfitting to their
training data sets. The random trees are created by
random selection of tuples and random selection of
attributes from training datasets.
The algorithm for random decision forests was created by
Tin Kam Ho, using the random subspace method for
attribute selection combined with Breiman's "bagging"
idea.
The training algorithm for random forests applies the
general technique of bootstrap aggregating, or bagging, to
tree learners. Given a training set attribute vector say X =
x1, ,xn with classes Y =c1, ..., cn, bagging repeatedly (m
times) selects a random sample with replacement of the
training set and construct trees from these samples:
For i = 1 to m:
1.) Sample, with replacement, n training tuples from X, Y;
call these Xi, Yi.
2.) Build a classification tree say Ti from Xi, Yi.
After training, predictions for unknown tuples x' can be
made by taking the majority vote.
The above method explains the actual bagging algorithm
for trees, but random forest uses one more approach, at
International Research Journal of Engineering and Technology (IRJET) e-ISSN: 2395-0056
Volume: 05 Issue: 08 | Aug 2018 www.irjet.net p-ISSN: 2395-0072](https://image.slidesharecdn.com/irjet-v5i8223-180919091232/85/IRJET-Study-and-Evaluation-of-Classification-Algorithms-in-Data-Mining-5-320.jpg)
![© 2018, IRJET | Impact Factor value: 7.211 | ISO 9001:2008 Certified Journal | Page 1302
each split in process of learning, it selects random subset
of features, also known as “feature bagging”. This is done
to remove correlation between trees if one of the feature is
strong predictor of class.
An analysis shows that bagging and random subspace
method improves accuracy under various conditions given
by Ho.
A classification problem, dataset that has p features, nearly
p features are used in each split.
3.5 Support Vector Machine
[10]Support vector machine SVM is a supervised learning
based, non-probabilistic algorithm for classification.
A support vector machine constructs a hyperplane which
can be used for classification. This algorithm can also work
on non-linear classification by mapping data points to a
higher dimension by kernel technique. New data instance
is then mapped into that same space and predicted to
belong to a class based on which side of the gap they fall.
Any hyperplane can be written as the set of points x
satisfying, 0. 0 wwx
, where w
is the weight vector.
w
is normal vector to hyperlane. Samples on the margin
are called the support vectors.SVM is trained using
samples from both classes. The points are classified
according to following equations:
0. 0 wwx
for points above hyperplane (18)
0. 0 wwx
for points below hyperplane (19)
Fig-3: Diagram representing hyperplane in SVM
The weights can be adjusted so that the hyperplanes
defining the "sides" of the margin can written as:
1.:1 0 wwxH i
for yi =+1 (20)
1.:2 0 wwxH i
for yi =-1 (21)
Any data tuple that falls on hyperplanes H1 and H2 are
called support vectors. The combined inequality can be
written as
1).( 0 ii ywwx
(22)
Finally optimization technique is used for maximizing
||||
2
w
that is distance between H1and H2, this equation can
be written in constrained(convex) quadratic optimization
problem. Hyperplane with larger margin is found to be
more accurate than hyperplane with lower margin.
Note that ||w||= wwT
Since maximizing
||||
2
w
is same is minimizing
2
wwT
the
quadratic programming problem in primal form becomes:
(23)
For solving this problem we do following with αi as
lagranges multiplier where αi≥0 for all iϵ{1,2,…n}:
(24)
Now we solve 0
w
L
and 0
0
w
L
which gives
(25)
(26)
The same quadratic programming problem in dual form
can be obtained by substituting value of w in L and can be
written as :
(27)
Once αi has been calculated, the formula for classification
is
(28)
In the above equation l denotes number of support
vectors.
How to handle linearly inseparable data?
This involves to main steps:
International Research Journal of Engineering and Technology (IRJET) e-ISSN: 2395-0056
Volume: 05 Issue: 08 | Aug 2018 www.irjet.net p-ISSN: 2395-0072](https://image.slidesharecdn.com/irjet-v5i8223-180919091232/85/IRJET-Study-and-Evaluation-of-Classification-Algorithms-in-Data-Mining-6-320.jpg)
![© 2018, IRJET | Impact Factor value: 7.211 | ISO 9001:2008 Certified Journal | Page 1303
1.)The original input data points is transformed to a
higher dimension space using a non-linear mapping.
2.)Once the data is transformed the algorithm searches for
a linear separating hyperplane in that new space.
Now the decision hyperplane becomes d(Z) =WZ+W0,
which is linear. As we have seen that in solving quadratic
programming optimization problem, the training tuples
appear only in form of dot products, ,where
is a nonlinear mapping function applied to
transform the training tuples.
It is mathematically equivalent to applying kernel function
K(Xi,Xj),to the original input data.
(29)
So is replaced with K(Xi,Xj) in our calculation,
in this way all calculation are done in original input space
which is of potentially of less dimension. Some kernel
function are:
Polynomial Kernel of degree h
(30)
Gaussian radial basis function kernel
(31)
Sigmoid Kernel
(32)
Now the quadratic programming problem in dual form is:
(33)
And formula for classification becomes:
(34)
Now let us consider SVM with soft margin also called as
imperfect classification.
To handle this we attach a non-negative slack variable in
the equation:
1.:1 0wwxH i
ξi for yi =1 (35)
1.:2 0wwxH i
ξi for yi =-1 (36)
1).( 0 ii ywwx
ξi (37)
If C denoted the penalty between datapoints then
quadratic optimization problem becomes:
(38)
And finally this equation is also solved in similar manner.
Complexity of learned Support Vector machine classifier
depends on number of support vectors rather than
number of attributes in a dataset.
SVM has applications in hand written digit recognition,
identification of speaker, object recognition and text
classification.
WEKA uses SMO(Sequential Minimal Optimization)
technique for optimization.
3.6 K-Nearest Neighbor
[18]K-nearest neighbor (K-NN) predicts the class label of
unknown data instance by taking majority of the classes
labels of K-nearest data instances, the nearness is
measured by distance measure formula. K-NN is a type of
instance-based learning , or lazy learning, where and all
computation are done only when test tuple is presented
for classification.
(39)
Fig-4: [15]Diagram representing K-NN for k=3 and k=6
International Research Journal of Engineering and Technology (IRJET) e-ISSN: 2395-0056
Volume: 05 Issue: 08 | Aug 2018 www.irjet.net p-ISSN: 2395-0072](https://image.slidesharecdn.com/irjet-v5i8223-180919091232/85/IRJET-Study-and-Evaluation-of-Classification-Algorithms-in-Data-Mining-7-320.jpg)
![© 2018, IRJET | Impact Factor value: 7.211 | ISO 9001:2008 Certified Journal | Page 1304
K-NN is based on learning by analogy , it compares test
tuples with training tuples that is similar to it. These
tuples are described by n attributes. All training tuples are
stored in n-dimensional space. When we are given a test
tuple the algorithm searches for k training tuples that are
close to the test tuple, these k tuples are called nearest
neighbors. We also normalize value of each attribute , so
that large value attribute do not outweights small weight
attribute. This is done by min-max normalization.
(40)
This normalization equation transforms the value v or
attribute A to v' in range[0,1].
Now we see how to handle distance computation case for
attribute value that is not numeric but categorical ,such as
color ,in this case we take distance between different color
to be 1 and same color to be 0.Another issue is how do we
handle missing values, in this case if one value is v' and the
other is missing then we take difference as max(|1-v'|,|0-
v'|).
The value of k is determined practically beginning from
k=1 and finally incrementing k. The value of k that gives
minimum error rate is selected. Since distance
computation has assign equal weight to each attribute ,
this algorithm has poor accuracy when provided with
noisy or useless attributes.
So input data is transformed to a set of feature by feature
extraction and then K-NN algorithm is applied on
transformed feature space. It is used in face recognition.
4. Evaluation Metrics
[1][16]For evaluation we split the data set into two sets,
training dataset and test dataset. We use training data set
to build the classifier and then we use this classifier on test
data set for prediction. This splitting is normally 80%
training dataset and 20% test dataset.
Confusion Matrix
ActualPredicted C ¬C
C TP FN
¬C FP TN
TP: True Positive, FN: False Negative, FP: False Positive
TN: True Negative
The evaluation metrics are, Accuracy, Precision, Recall, F-
Score
Accuracy: It is percentage of test tuples that are correctly
classified.
(41)
Precision: It is the measure of exactness, which is the
percentage of tuples in test dataset that are labeled as
positive, are actually positive.
(42)
Recall: It is the measure of exactness, which is the
percentage of positive tuples in test dataset that the
classifier labeled as positive.
(43)
F-Score: It is the harmonic mean of precision and recall.
(44)
Time: Time taken in building model and prediction.
Algorithm that has high accuracy, precision ,recall,f1-
score, and takes least time is considered to be better than
others.
5. WEKA
[5][17]Waikato Environment for Knowledge Analysis
(WEKA) is a machine learning tool written in Java,
developed at the University of Waikato. It is free software
licensed under the GNU General Public License.
WEKA provides many data mining algorithms and
visualization tools for data analysis and predictive
modeling, with graphical user interfaces that helps user to
easily run these algorithms on datasets. Weka supports
several standard data mining tasks, that are, data
preprocessing , feature selection, classification, regression
,clustering, and visualization. The classification algorithms
that we will evaluate here are: Decision Tree (C 4.5) by
J48,Naive Bayes, Random Forest, Multilayer Neural
Network by Multilayer Perceptron, SVM by
SMO(PolyKernel,Normalized PolyKernel),K-Nearest
neighbor by Instance based learning(IBk).
WEKA outputs accuracy, precision,recall,f1-score of all
classes separately and combined weighted average
precision, weighted average recall, weighted average F1-
score of all classes. The input datasets are provided in
ARFF file format. ARFF stands for Attribute-Relation File
Format.
6. Datasets to be evaluated
1.) [11]Iris Dataset: This dataset has 4 attributes and 3
classes,150 instances ,attributes are: sepallength REAL,
sepalwidth REAL, petallength REAL,petalwidth REAL, and
classes are :Iris-setosa,Iris-versicolor,Iris-virginica.
International Research Journal of Engineering and Technology (IRJET) e-ISSN: 2395-0056
Volume: 05 Issue: 08 | Aug 2018 www.irjet.net p-ISSN: 2395-0072](https://image.slidesharecdn.com/irjet-v5i8223-180919091232/85/IRJET-Study-and-Evaluation-of-Classification-Algorithms-in-Data-Mining-8-320.jpg)
![© 2018, IRJET | Impact Factor value: 7.211 | ISO 9001:2008 Certified Journal | Page 1305
2.)[12]Ionosphere Dataset:This dataset has 34 attributes
and 2 classes,351 instances.Attributes are: a01 numeric,
a02 numeric,…, a34 numeric,and classes are b,g.
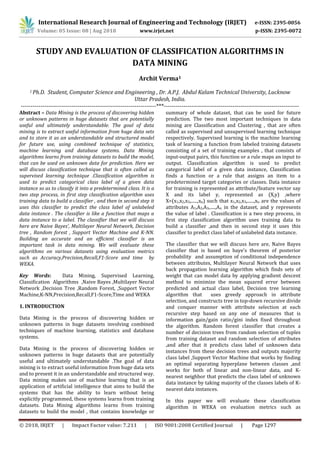
3.)[13]Soybean disease dataset:This dataset has 35
attributes ,and 19 classes,683 instances.Attributes
are:date,plant-stand,precip,temp,hail,crop-hist,area-
damaged,severity ,seed-tmt,germination,plant-growth
,leaves.leafspots-halo ,leafspots-marg,leafspot-size,leaf-
shread ,leaf-malf ,leaf-mild ,stem ,lodging ,stem-cankers
,canker-lesion ,fruiting-bodies ,external-decay ,mycelium
int-discolor ,sclerotia ,fruit-pods,fruit-spots,seed ,mold-
growth ,seed-discolor,seed-size ,shriveling ,roots and
classes are: diaporthe-stem-canker, charcoal-rot,
rhizoctonia-root-rot, phytophthora-rot, brown-stem-rot,
powdery-mildew, downy-mildew, brown-spot, bacterial-
blight, bacterial-pustule, purple-seed-stain, anthracnose,
phyllosticta-leaf-spot, alternarialeaf-spot, frog-eye-leaf-
spot, diaporthe-pod-&-stem-blight, cyst-nematode, 2-4-d-
injury, herbicide-injury
4.)[14]Labor Dataset:This dataset has 16 attributes and 2
classes,57 instances.Attributes are duration
numeric,wage-increase-first-year numeric,wage-increase-
second-year numeric,wage-increase-third-year
numeric,cost-of-living-adjustment string, working-hours
numeric,pension string,standby-pay numeric,shift-
differential numeric,education-allowance string,statutory-
holidays numeric,vacation string,longterm-disability-
assistance string,contribution-to-dental-plan
string,bereavement-assistance string,contribution-to-
health-plan string,and classes are: bad,good
7. Result of Evaluation
Iris Dataset
Chart-1:Iris dataset accuracy
Chart-2: Iris dataset weighted average precision,
weighted average recall, and weighted average f-score
Chart-3: Iris dataset time
Ionosphere Dataset
Chart-4: Ionsophere dataset accuracy
International Research Journal of Engineering and Technology (IRJET) e-ISSN: 2395-0056
Volume: 05 Issue: 08 | Aug 2018 www.irjet.net p-ISSN: 2395-0072](https://image.slidesharecdn.com/irjet-v5i8223-180919091232/85/IRJET-Study-and-Evaluation-of-Classification-Algorithms-in-Data-Mining-9-320.jpg)
![© 2018, IRJET | Impact Factor value: 7.211 | ISO 9001:2008 Certified Journal | Page 1307
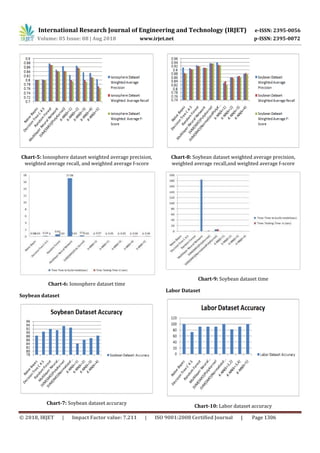
Chart-11: Labor dataset weighted average precision,
weighted average recall,and weighted average f-score
Chart-12: Labor dataset time
5. Discussion of Result
1.) From result of evaluation of Iris dataset we see that
Decision Tree C 4.5 has better accuracy precision,recall,f1-
score,compared to others.Chart-1,Chart-2
2.) From result of evaluation of ionosphere dataset we see
that Random Forest has better accuracy,
precision,recall,f1-score compared to others.Chart-
3,Chart-4
3.) From result of evaluation of soybean dataset we see
that SVM(SMO)with PolyKernel has better accuracy,
precision, recall,f1-score compared to others.Chart-
5,Chart-6.
4.) From result of evaluation of labor dataset we see that
Naive Bayes,SVM(SMO)with Normalized PolyKernel,K-NN
with k=5 has better accuracy,precision,recall,f1-score
compared to others.Chart-7,Chart-8
5.) From Chart-3,Chart-6,Chart-9,Chart-12 we see that
neural network takes the most time in each case.
8. Conclusion
From this paper we have seen that classification algorithm
has a wide use case from lot of available dataset. It is a
supervised learning technique. Each algorithm has its own
pros and cons. Naive Baye’s performs well if there is a
conditional independence between attributes, which is not
always the case, and takes less time. Multilayer neural
network works well with numeric data and is robust
towards noisy data, but takes most time. Decision tree
provides understandability in representing classification
model and takes less time. Random forest improves
accuracy of decision tree by correcting decision tree
problem of overfitting to their training datasets. Support
vector machine takes considerably less prediction time
even if number of attributes are large, it also give better
accuracy, and works for linearly inseparable data as well,
the complexity of learned SVM classifier depends on
number of support vectors. K-nearest neighbor is a lazy
learner and gives poor accuracy in case it is provided with
noisy or useless attributes, its accuracy can be improved
by feature extraction.
REFERENCES
[1] Jiawei Han,Michelin Kambar “Data Mining Concepts
and Techniques” , Second Edition
[2] Stuart J. Russel and Peter Norvig , “Artificial
Intelligence ,A Modern Approach”, Third Edition
[3] Margaret H Dunham, “Data Mining: Introductory and
Advanced Topics”
[4] https://en.wikipedia.org/wiki/Random_forest
[5] https://en.wikipedia.org/wiki/Weka_(machine_learni
ng)
[6] N. Chandra Sekhar Reddy, K. Sai Prasad and A.
Mounika,Classification Algorithms in Datamining: A
study,Internation Journal of Computational
Intelligence Research,2017
[7] Mr.Sudhir, M.Gorade ,Prof. Ankit Deo ,Prof. Preetesh
Purohit, A study of some Data Mining Classification
Techniques, International Research Journal of
Engineering and Technology, IRJET 2017
[8] Nikhil.N Salvithal ,Dr.RB Kulkarni, Evaluating
Performance of Data Mining classification Algorithm
in WEKA, International Journal of Application or
Innovation in Engineering and Management(IJAIEM)
2013
[9] https://www.tutorialspoint.com/data_mining/dm_dti.
htm
International Research Journal of Engineering and Technology (IRJET) e-ISSN: 2395-0056
Volume: 05 Issue: 08 | Aug 2018 www.irjet.net p-ISSN: 2395-0072](https://image.slidesharecdn.com/irjet-v5i8223-180919091232/85/IRJET-Study-and-Evaluation-of-Classification-Algorithms-in-Data-Mining-11-320.jpg)
![© 2018, IRJET | Impact Factor value: 7.211 | ISO 9001:2008 Certified Journal | Page 1308
[10] http://web.cs.iastate.edu/~honavar/smo-svm.pdf
[11] https://archive.ics.uci.edu/ml/datasets/iris
[12] https://archive.ics.uci.edu/ml/datasets/ionosphere
[13] https://archive.ics.uci.edu/ml/datasets/Soybean+(La
rge)
[14] https://archive.ics.uci.edu/ml/datasets/Labor+Relati
ons
[15] http://adataanalyst.com/machine-learning/knn/
[16] https://en.wikipedia.org/wiki/Precision_and_recall
[17] https://www.cs.waikato.ac.nz/ml/weka/arff.html
[18] https://en.wikipedia.org/wiki/K-
nearest_neighbors_algorithm
I am Ph.D. Computer Science and
Engineering (C.S.E.) student in
Dr. A.P.J. Abdul Kalam Technical
University, Lucknow. I am UGC-
NET qualified in Computer
Science and Applications in
January 2018. M.Tech(C.S.E.)
from United College of
Engineering and Research
(U.C.E.R.) , Allahabad, affiliated to
Dr. A.P.J. Abdul Kalam Technical
University, Lucknow. B.Tech
(C.S.E.) from Institute of
Engineering and Rural
Technology(I.E.R.T.) , Allahabad,
affiliated to Dr. A.P.J. Abdul Kalam
Technical University, Lucknow.
My area of interest includes Data
Mining, Artificial Intelligence,
Distributed Systems and Big Data
Analytics.
International Research Journal of Engineering and Technology (IRJET) e-ISSN: 2395-0056
Volume: 05 Issue: 08 | Aug 2018 www.irjet.net p-ISSN: 2395-0072
Archit Verma
[19] https://en.wikipedia.org/wiki/Decision_tree_learning
BIOGRAPHIE](https://image.slidesharecdn.com/irjet-v5i8223-180919091232/85/IRJET-Study-and-Evaluation-of-Classification-Algorithms-in-Data-Mining-12-320.jpg)

The document discusses classification algorithms in data mining. It describes classification as a supervised learning technique that predicts categorical class labels. Six classification algorithms are evaluated: Naive Bayes, neural networks, decision trees, random forests, support vector machines, and K-nearest neighbors. The algorithms are evaluated using metrics like accuracy, precision, recall, F1-score and time using the WEKA tool on various datasets. Building accurate and efficient classifiers is an important task in data mining.