Download as PDF, PPTX


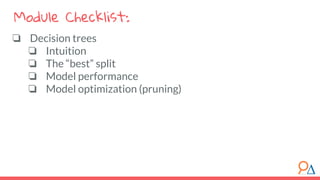

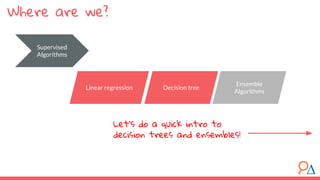
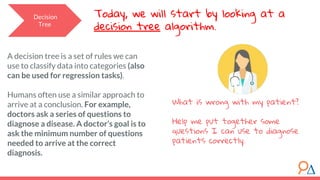
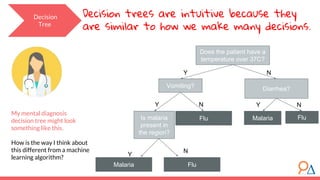
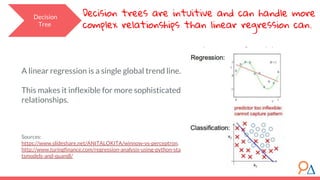
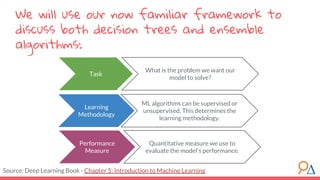
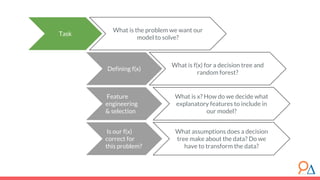
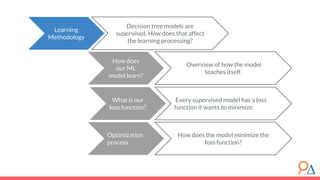

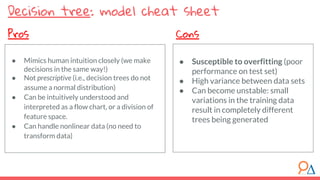


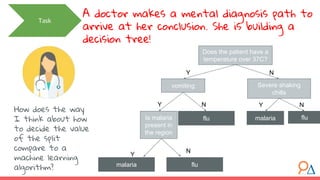
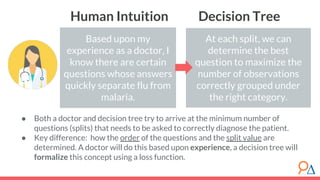

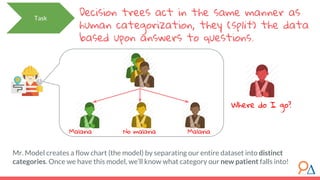


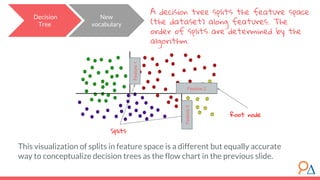
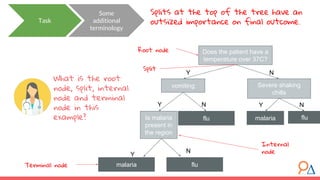
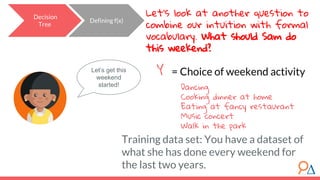
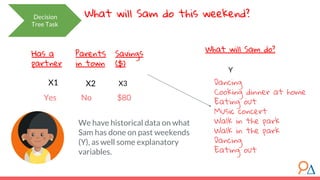
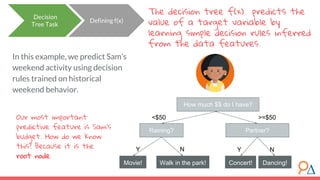
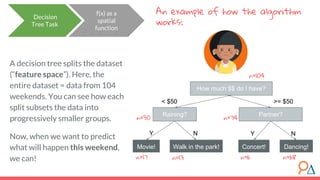
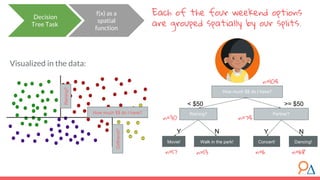
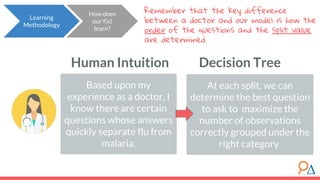
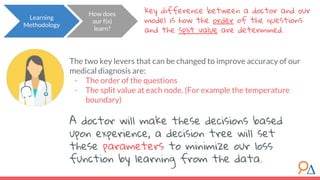
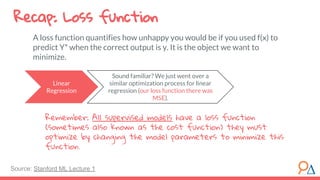
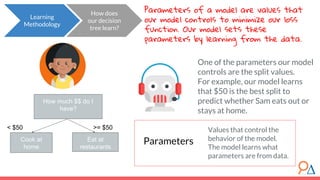
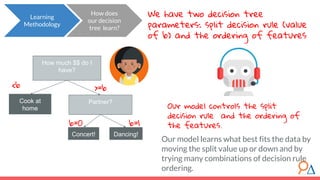
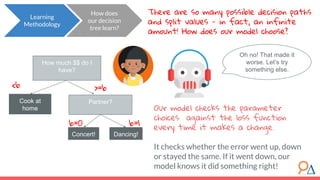
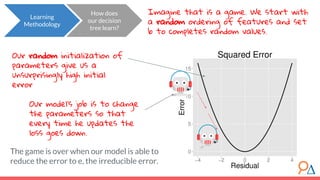
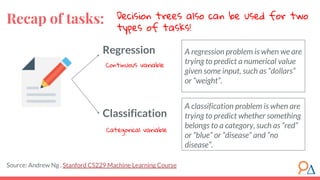
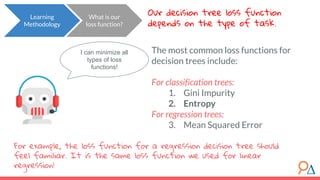
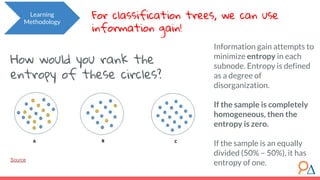

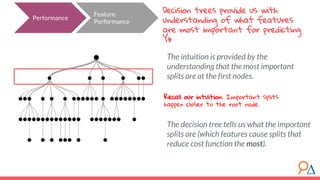
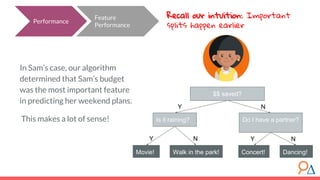
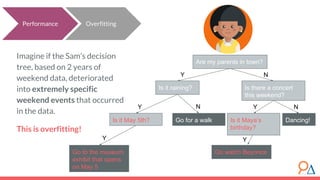
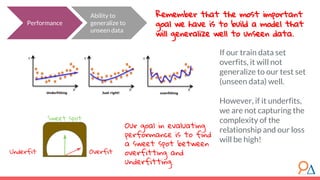
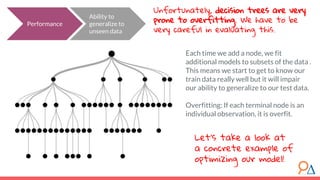

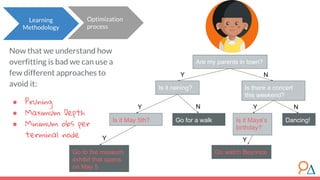
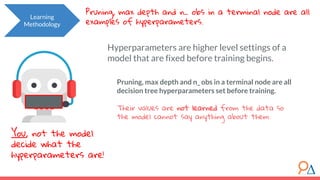
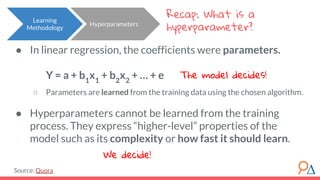
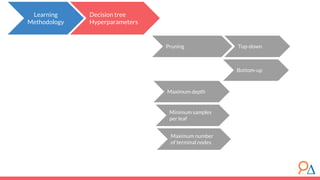
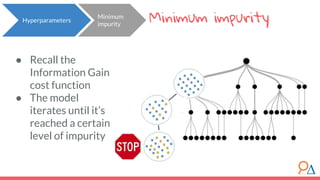
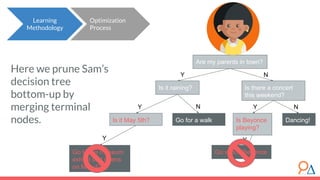
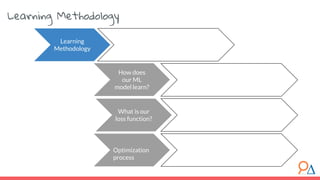
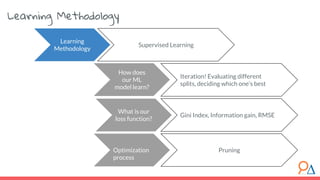

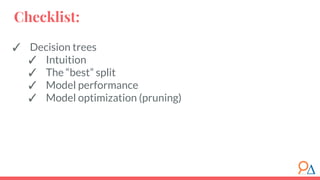


This document discusses decision trees as a machine learning algorithm used for classification and regression tasks. It explains the structure of decision trees, their intuitive similarity to human decision-making, and the learning methodology, which involves optimizing splits based on loss functions like Gini impurity and mean squared error. The content also highlights the pros and cons of decision trees, such as their susceptibility to overfitting and their interpretability.


![Yellow_Colorful_Animated_Illustration_Science_Theme_Presentation_(1)[1].pptx](https://cdn.slidesharecdn.com/ss_thumbnails/yellowcolorfulanimatedillustrationsciencethemepresentation11-251014055343-ae23ba9f-thumbnail.jpg?width=640&height=640&fit=bounds)


![Getting Started with Apache Spark: Big Data Made Simple [Free Meetup]](https://cdn.slidesharecdn.com/ss_thumbnails/apachesparkgettingstarted-260203175547-8361bcc3-thumbnail.jpg?width=640&height=640&fit=bounds)


