Download as PDF, PPTX


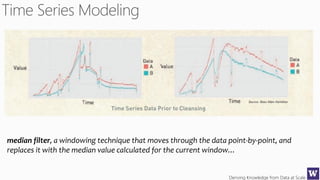
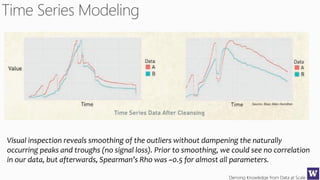


The document discusses machine learning and data science concepts. It begins with an introduction to machine learning and the machine learning process. It then provides an overview of select machine learning algorithms and concepts like bias/variance, generalization, underfitting and overfitting. It also discusses ensemble methods. The document then shifts to discussing time series, functions for manipulating time series, and laying the foundation for time series prediction and forecasting. It provides examples of applying techniques like median filtering to smooth time series data. Overall, the document provides a high-level introduction and overview of key machine learning and time series concepts.


![7.__Developing_a_Research_Proposal[1].pptx](https://cdn.slidesharecdn.com/ss_thumbnails/7-260131073037-df92dd7d-thumbnail.jpg?width=640&height=640&fit=bounds)


