Download to read offline
![IOSR Journal of Applied Chemistry (IOSR-JAC)
e-ISSN: 2278-5736.Volume 4, Issue 6 (May. – Jun. 2013), PP 05-10
www.iosrjournals.org
www.iosrjournals.org 5 | Page
TLC Separation of Cephalosporins on Stannic Arsenate Layers
Ajay Gupta & Jayshree Dassani
Department of Applied Sciences, SR Group of Institutions, Jhansi
Abstract: The chromatographic behaviour of some cephalosporins has been studied on synthetic stannic
arsenate layers using citrate and borate buffers as mobile phases. Several ternary and quaternary separations
have been achieved. The utility of these separations has been demonstrated for estimation of cephalosporins in
blood serum from patients.This method used is simple, rapid ,reproducible and can also be applied in the
separation and determination of cephalosporins in other biological samples. The limit of detection was found to
be 0.20 µg/l.
KeyWords: TLC, Cephalosporins, Stanic arsenate
I. Introduction
The use of inorganic ion exchangers as adsorbents in thin layer chromatography has afforded promising
results in the separation of metal ions, anions [1–4], organic compounds [5,6], phenols [7] and organic acids [8].
The widespread application of ion-exchange resins for separating and purifying amino acids from protein
hydrolysis has received considerable attention [9,10]. Stannic arsenate has been used for TLC because it has
been found to be quite stable in acids, bases, and common organic solvents; it has been used for separation of
metal ions [11], anions [12],and amino acids [13].Addition of inorganic salts to conventional adsorbents and use
of organic and inorganic solvents as mobile phases has been reported to result in improved separations of some
pharmaceutical products compared with the untreated adsorbent [14]. Double hydroxide adsorbent layers have
been used for TLC separation of cephalosporins [15]. The cephalosporin anti-biotics are a large family of
therapeutically useful compounds
Sporadic publications on the identification of cephalosporin anti-biotics by densitometry on
hydrocarbon-impregnated silica gel HPTLC plates have appeared in the literature [16-17] and TLC of
cephalosporins has also been performed on silanized silica gel [18-19]. In this work we have reported the utility
of stannic arsenate and simple mobile phases for separation of cephalosporins and their subsequent quantitative
determination in the blood serum of patients.
II. Experimental
Chemicals
Sodium arsenate(Loba Chemic,India),Stenic Chloride(Loba Chemic,India),Methanol (AR grade), citric
acid, sodium hydroxide, potassium di-hydrogen phosphate, ammonia solution, borax, sodium bicarbonate, ferric
ammonium sulphate, and hydroxylamine hydrochloride were from Merck (Mumbai, India) . Boric acid was
from Ranbaxy (S.A.S. Nagar, India). Ni-ckel(II) chloride hexahydrate was from Qualigens Fine Chemical
(Mum-bai, India).
Samples
Cefaclor was from Aristo pharmaceuticals (Nani Daman, Mumbai, India), ceftriaxone from Otomotive
Products (Navi Mumbai, India), cefta-zidime from Biochem Pharmaceuticals (Mumbai, India), cefoperazone
from
Unimed Technologies (Halol, Gujarat, India), cefotaxime from Starry Health Care (Vikhroli (W) Mumbai,
India), cefadroxil from Comed Chemicals (Baroda, Gujarat, India), and cephalexin from Glaxo India (Mumbai,
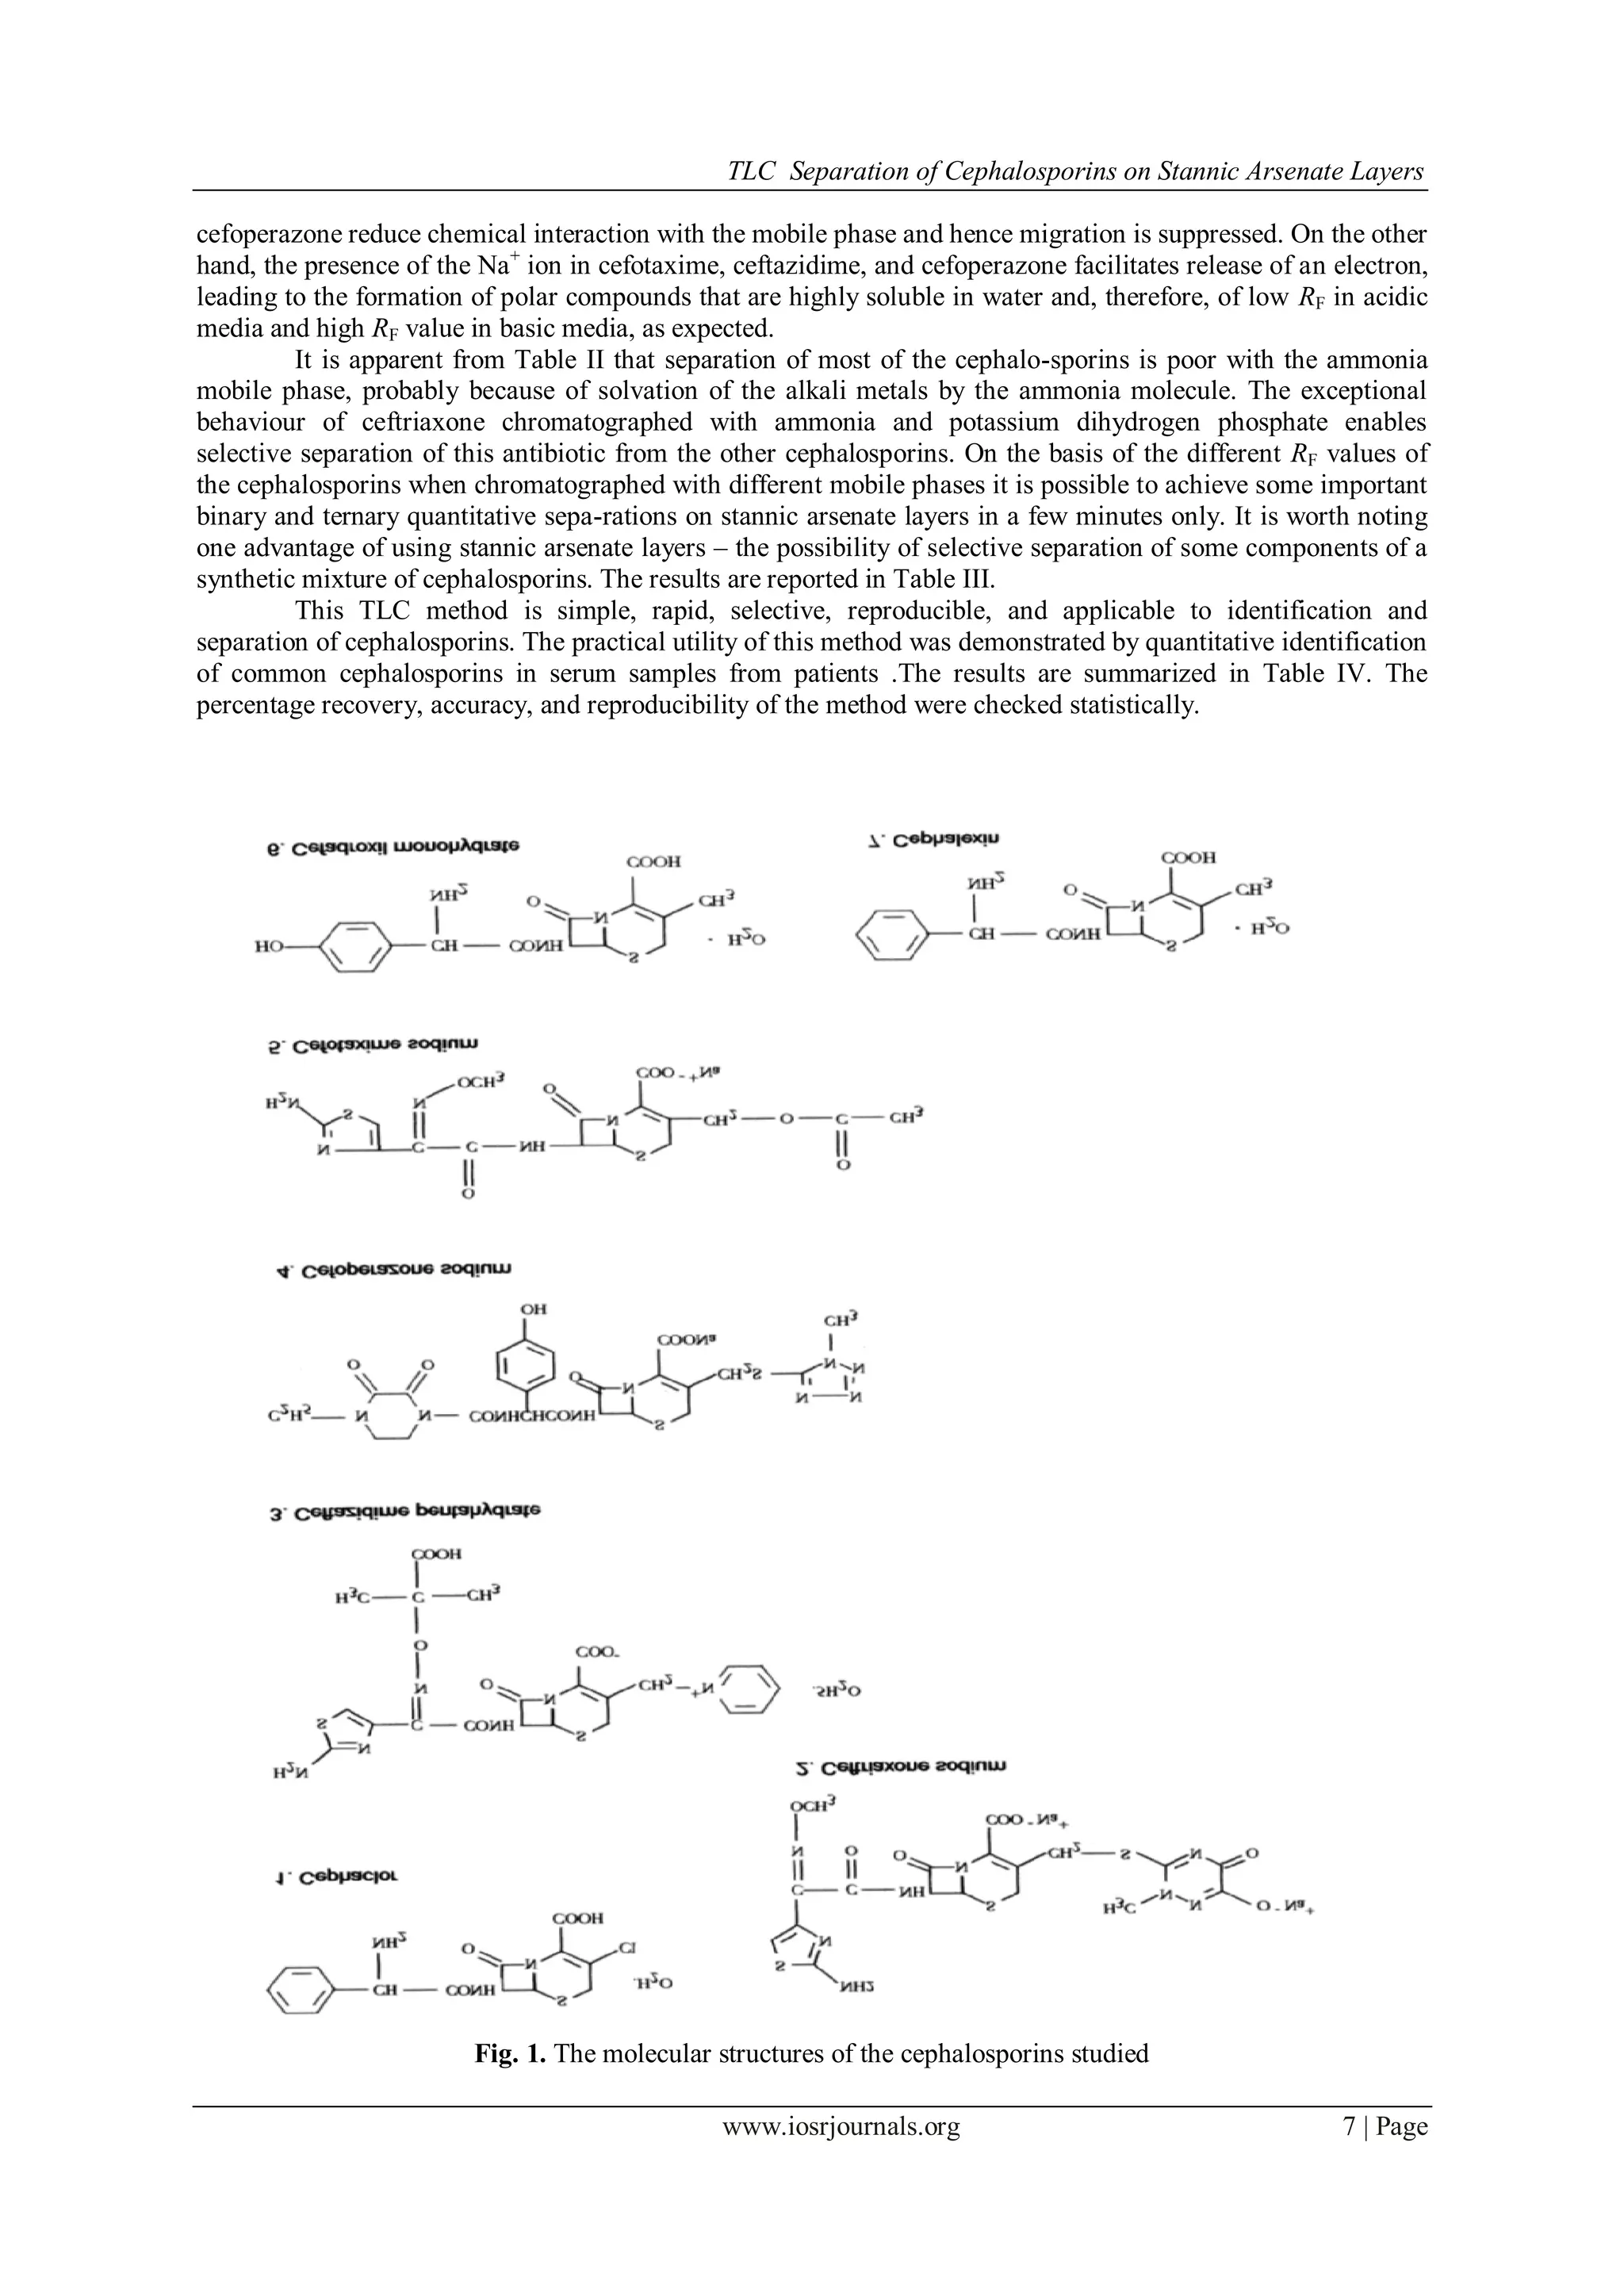
In-dia). The structures of the compounds are shown in Fig. 1.
III. Preparation of Ion- exchange material and development of TLC plates
Stenic arsenate ion-exchanger was prepared by mixing 0.5 molar sodium arsenate with 0.5 molar stenic
chlotide in 1:1 ratio at pH 10.0 and subsequent addition of 0.1M HCl . The resulting precipitate was digested at
room temp. for 24 hours,filtered by suction and then dried in an oven at 40±5o C.The material obtained was
cracked in dimineralized water,mixed with 1 M Nitric ad. and kept for over night so that it is converted in to
protonated form.It was washed with demineralized water to remove exciss ad. and finally dried in an oven at
400
C
The TLC plates were prepared in the usual manner from demineralized water . The slurry was spread
over TLC plates with 0.2 mm thickness and dried in air overnight, and activated at 60°C for 1 h before spot
application.](https://image.slidesharecdn.com/b0460510-150425004231-conversion-gate02/75/TLC-Separation-of-Cephalosporins-on-Stannic-Arsenate-Layers-1-2048.jpg)
![TLC Separation of Cephalosporins on Stannic Arsenate Layers
www.iosrjournals.org 6 | Page
Solvent System used
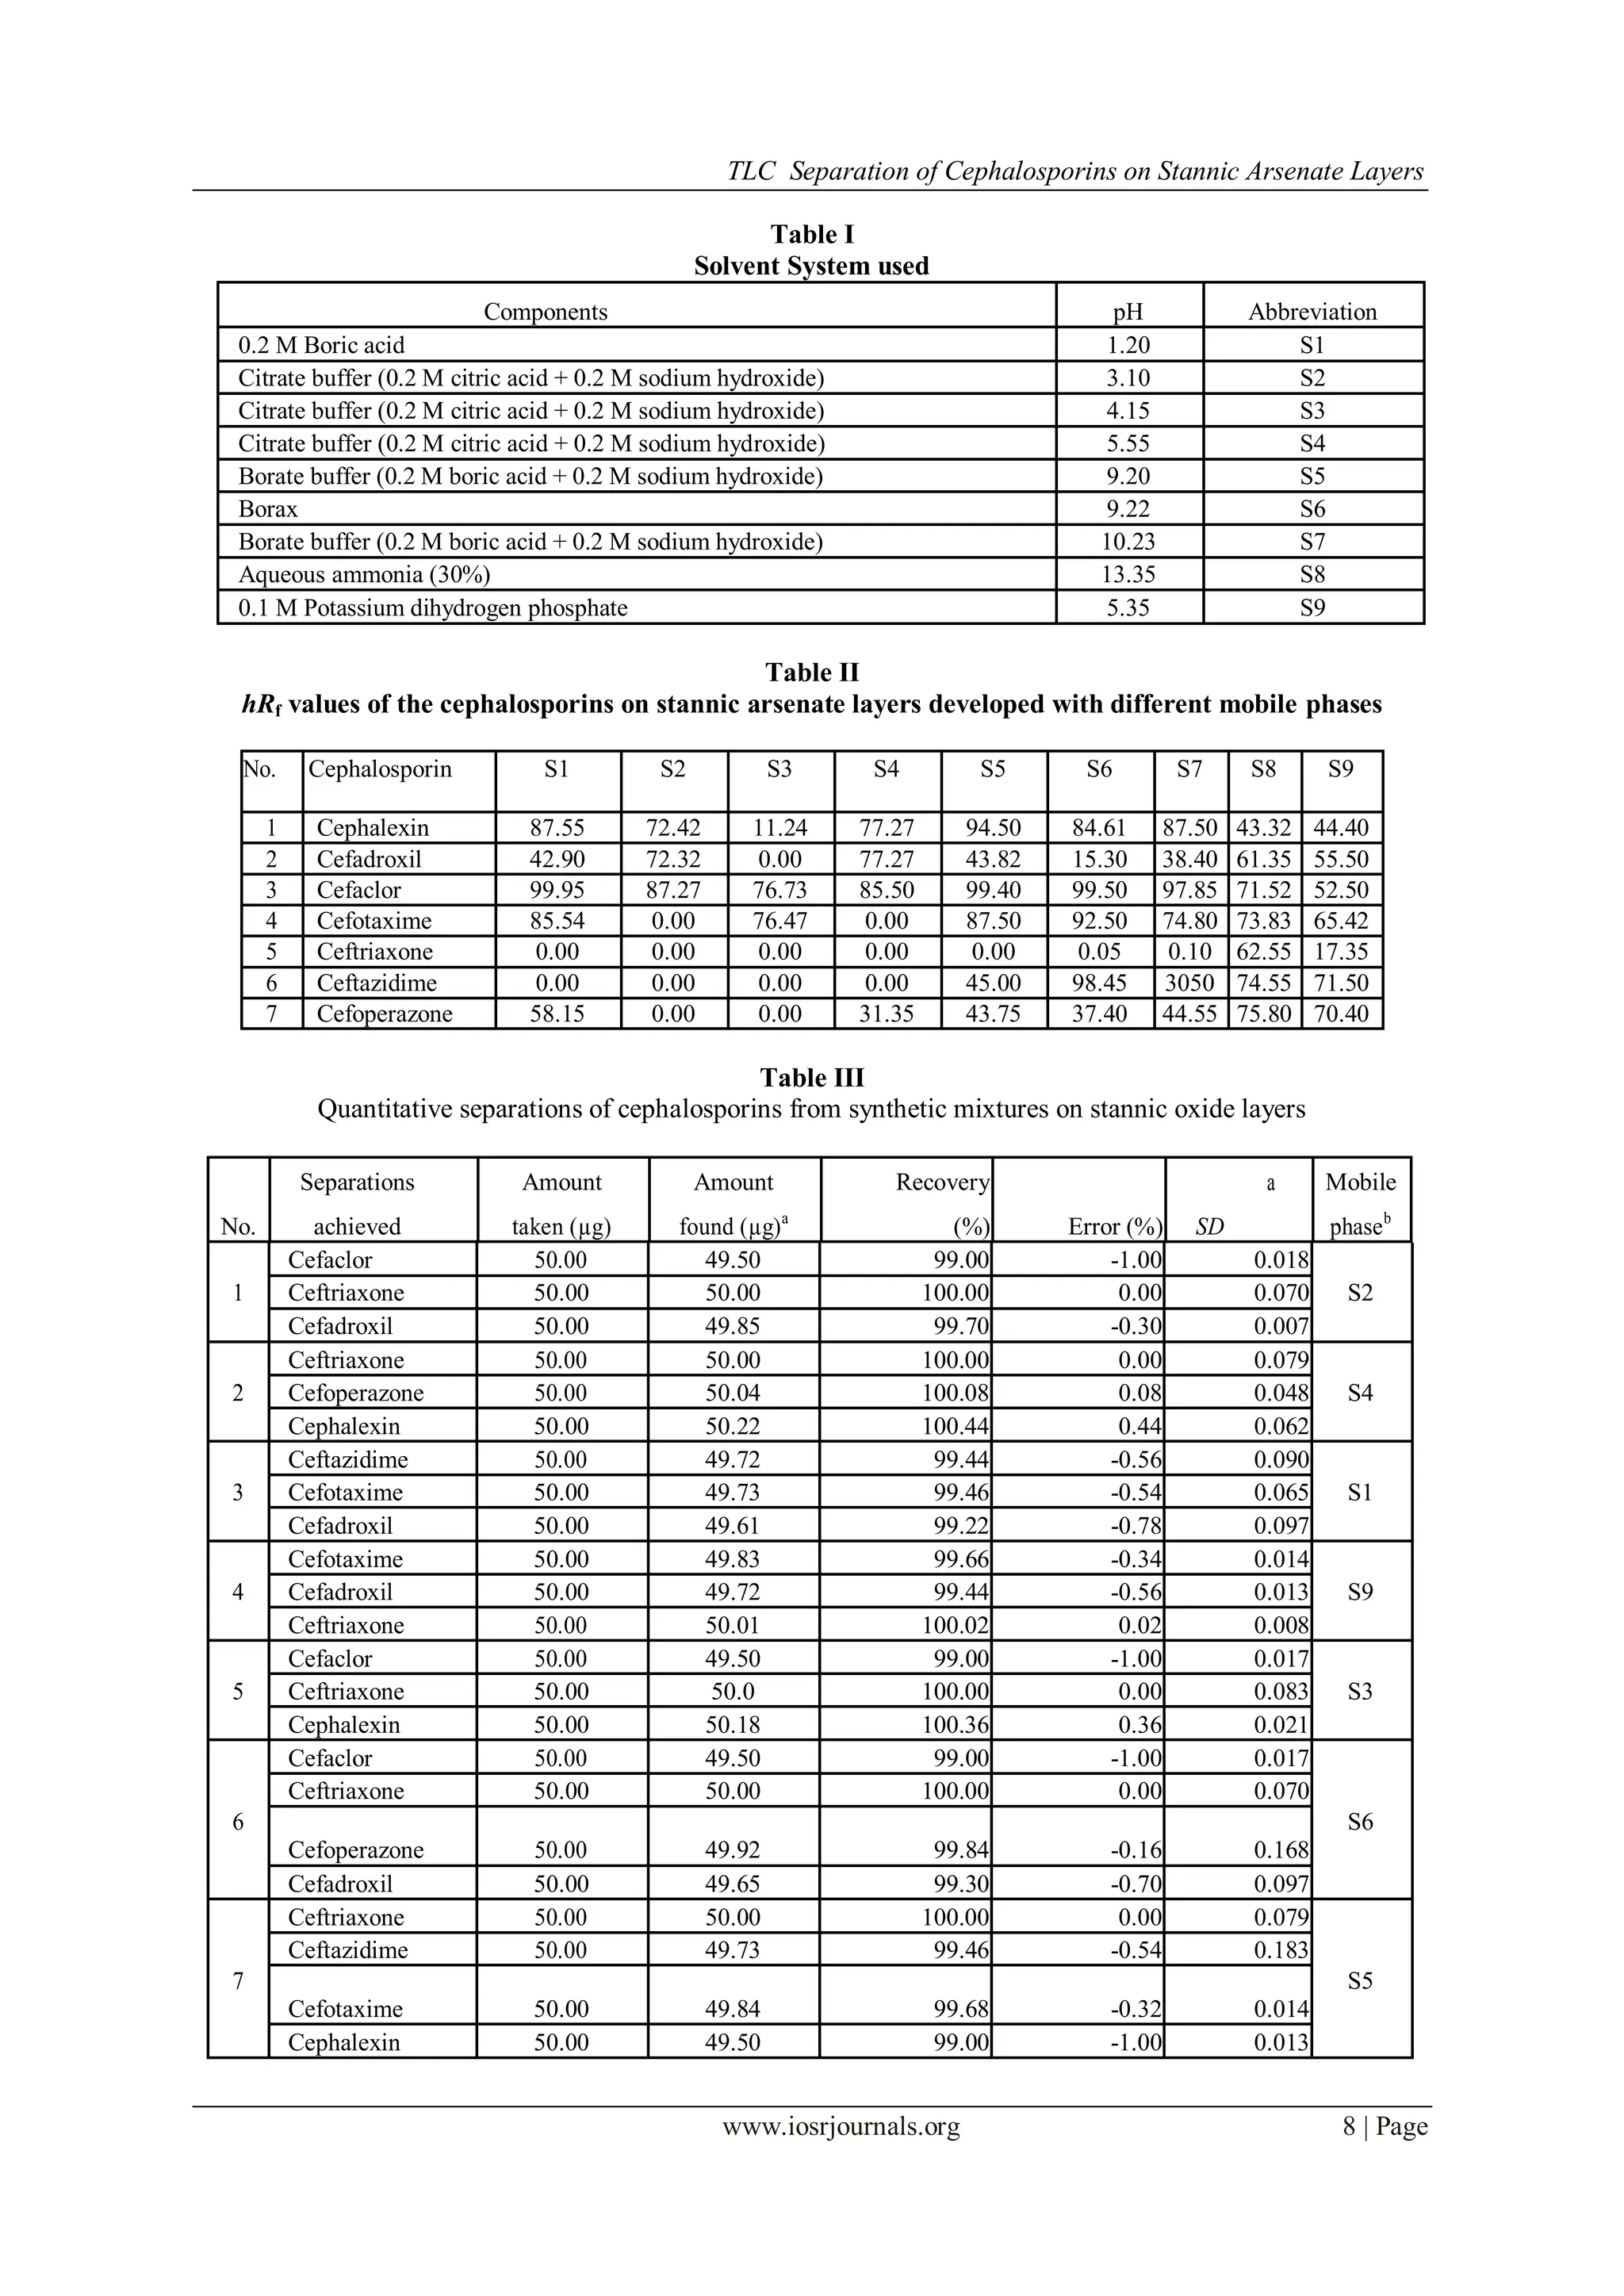
At least 20 different solvents were used as mobile phases but sepa-ration of cephalosporins on stannic
arsenate was achieved solely by use of citrate and borate buffers of different pH. The mobile phases used are
listed in Table I.
Qualitative Separations in synthetic mixtures
For qualitative studies solutions (1.0 mg mL−1)
of each cephalospo-rin in DMW were applied at one
end of the plate. The glass plates (18cm x 20 cm) were developed, at room temperature (25 ± 3°C), in
rectangular chambers (20 cm × 22 cm × 9 cm) previously equilibrated by conditioning with mobile phase for at
least 1 h. The time required for chromatographic development of the plates varied with the mobile phase used.
After development plates were dried with a stream of cold air and the spots were visualized.
by placing the plates in a chamber of iodine vapour. Brown spots on the plate revealed the location of the
compounds. hRF values were calculated by means of the formula:
hRF=
distance travelled by the geometrical centre of the solute spot
×100
distance travelled by solvent front from the point of application
The hRF values obtained are listed in Table II.
IV. Quantitative Separations
For quantitative work, stock solutions of cephalosporins were pre-pared in demineralized water.
Solutions of different cephalosporins were mixed, spotted by means of a microsyringe, and developed with a
selected mobile phase. A pilot plate was run simultaneously to visualise exact position of the spot on the TLC
plate. The regions containing the cephalosporins were scraped from the plates, mixed in demineralized water
and then filtered. The clear solution containing the cephalosporin content of each spot was then analysed by a
spectrophotometric method [20-24]. Results are shown in Table III.
Quantitative Estimation of Cephalosporins in Blood Serum Samples
Anhydrous sodium sulphate (40 g) and ethanol (95%, 2 mL) were mixed with 10 mL of oxalate blood.
The mixture was centrifuged and after 2.5 hours the supernatant liquid was decanted. Because of the presence of
sodium sulphate and alcohol, water was eliminated. Finally the mixture was mixed with diethyl ether for 45
min. The ether layer was separated and the mixture was concentrated to approximately 0.10 mL under vacuum
at 50°C. Blood serum samples from different patients were collected and analysed for specific antibiotics by a
spectrophotometric method. Known amount of the concentrated solution of cefalosporine was then applied to
the TLC plates and the plates were developed with an appropriate mobile phase. The region containing the spot
was scraped from the plate, mixed with demineralised water, and same procedure was applied as in quantitative
separation.
V. Results And Disicussion
Antibiotics are chemically defined reproducible chemical substan-ces produced in and isolated from
living cells, or are chemical or biological derivatives of these [25]. Non-specific methods for analysis of anti-
biotics, for example microbiological and spectrophotometric methods, do not differentiate between structurally
similar byproducts from the synthesis or degradation of the antibiotics of interest. More specific methods such
as TLC, GC, and HPLC that differentiate among different structures are preferable for analysis of antibiotics
[26]. Because of the unstable nature of antibiotics, decomposition of the drugs or polymerization can occur
during chromatography, although this occurs less in TLC than in paper chromatography [27].
Stannic arsenate is regarded as quite stable, amorphous, and hydrated to a variable extent. TLC plates
are, therefore, activated at 60°C to desorb physically bonded water. The spots were detected by placing the TLC
plates in an iodine vapour chamber. The iodine vapour dissolves in or forms weak charge transfer complexes
with organic compounds and the cephalosporins show up as brown spots on a pale yellow background within
few minutes. After marking the zones for further reference exposure of the plates to air causes the iodine to
sublime and the spots fade. The hRF values of the different cephalosporins after chromatography with mobile
phases S1 to S9 are shown in Table II. It is clear from the hRF values that cefaclor, which contains a Cl group,
has higher hRF values for most of the mobile phases than cephalexin (OCH3 group) or cefadroxil (CH3 group).
This might be because of the negative inductive effect – Cl−
has a stronger negative inductive effect than OCH3
(i.e. attracts electrons more strongly).
It was found that the behaviour of cefoperazone was peculiar in almost all of the mobile phases except
ammonia and potassium dihydrogen phosphate. The positive inductive effects of the methyl and ethyl groups in](https://image.slidesharecdn.com/b0460510-150425004231-conversion-gate02/75/TLC-Separation-of-Cephalosporins-on-Stannic-Arsenate-Layers-2-2048.jpg)
![TLC Separation of Cephalosporins on Stannic Arsenate Layers
www.iosrjournals.org 9 | Page
a
Average from five replicate determinations
b
S1, Boric acid (pH 1.25); S2, citrate buffer (pH 3.15); S3, citrate buffer (pH 4.05); S4, citrate buffer (pH 5.05);
S5, borate buffer (pH 9.10); S6, borax buffer (pH 9.18); S9, po-tassium dihydrogen phosphate (pH 5.30)
Table IV
Quantitative separations of cephalosporins from samples of patients’ serum
Serum
Amount taken Amount found Recovery
SD
a Mobile
sample Cephalosporin (µg) (µg)a
(%) phaseb
no.
1 Cefaclor 50 49.90 99.80 0.05 S 1
2 Cefotaxime 100 49.95 99.90 0.125 S 6
3 Ceftriaxone 100 49.20 9840 0.038 S 8
4 Ceftazidime 50 49.45 98.90 0.022 S 6
a
Average from four replicate determinations
b
S1, boric acid (pH 1.25); S6, borax buffer (pH 9.18); S8, aqueous ammonia (pH 13.55)
References
[1] S.D. Sharma, T.D. Sharma, and B.C. Sethi, J. Liq. Chromatogr., 6, 1253 (1983)
[2] N.S. Sethi, R.P.S. Rajput, and N.K. Agarwal, Anal. Lett., 18, 481 (1985)
[3] S.A. Nabi, W.U. Farooqui, and N. Rahman, J. Planar Chromatogr., 7, 38 (1994)
[4] G. Vanik and S.W. Hussain, Anal. Sci., 16, 1079 (2000)
[5] S.A. Nabi, W.U. Farooqui, and Z.M. Siddiqui, J. Liq. Chromatogr., 6, 109 (1983)
[6] S.A. Nabi, W.U. Farooqui, and N. Rahman, Chromatographia, 20, 109 (1985)
[7] K. Sahil, S.K. Dabral, and K.P.S. Muktawat, J. Indian Chem. Soc., 79(9), 739 (2002)
[8] K. Sahil, S.K. Dabral, and K.P.S. Muktawat, J. Indian Chem. Soc., 78, 374 (2001)
[9] L. Lepri, P.G. Desideri, and D. Heimler, J. Chromatogr., 268, 493 (1983)
[10] S.D. Sharma, H. Sharma, and S.C. Sharma, Chem. Environ. Res., 11, 179 (2002)
[11] N. Zattrezie-Renault, J. Inorg. Nucl. Chem., 40, 539 (1978)
[12] A.K. Sen and U.C. Ghosh, J. Liq. Chromatogr., 3, 31 (1980)
[13] S.A. Nabi and A. Sikarwar,Acta . Chromatogr.,9,123-132(1999)
[14] J.A. Manthey and M.E. Amundson, J. Chromatogr., 19, 522 (1965)
[15] S.Z. Qureshi, R.M.A.Q. Jamhour, and N. Rahman, J. Planar Chromatogr., 9, 466 (1996)
[16] S.C. Dhanesar, J. Planar Chromatogr., 11, 195 (1998)
[17] S.C. Dhanesar, J. Planar Chromatogr., 12, 114 (1999)
[18] I. Quintes, J. Eykens, E. Roets, and J. Hoogmartens, J. Planar Chromatogr., 6,181 (1993)
[19] J. Sherma and B. Fried (eds), Handbook of Thin-Layer Chromatography, Marcel Dekker, New York, 1990
[20] D.L. Mays, F.K. Bangert, W.C. Cantrell, and W.G.. Evans, Anal. Chem., 47, 2229 (1975)
[21] F.I. Sengun and Koksal Ulas, Talanta, 33, 363 (1986)
[22] F.I. Sengun and I. Fedai, Talanta, 33, 366 (1986)
[23] P.B. Issopoulos, J. Pharm. Biomed. Anal., 7, 619 (1989)
[24] British Pharmacopeia, Vol. 1, 1980, p. 86
[25] R. Brunner, in R. Brunner and G. Machek (eds), Die Antibiotica Hans Carls, Nuremberg, FRG, (1962), p. 7
[26] J. Ripphahn and H. Halpaap, J. Chromatogr., 112, 7 (1975)
[27] E.J. Vandamme and J.P. Voets, J. Chromatogr., 71, 141 (1972)
Table I
Solvent System used
Components pH Abbreviation
0.2 M Boric acid 1.20 S1
Citrate buffer (0.2 M citric acid + 0.2 M sodium hydroxide) 3.10 S2
Citrate buffer (0.2 M citric acid + 0.2 M sodium hydroxide) 4.15 S3
Citrate buffer (0.2 M citric acid + 0.2 M sodium hydroxide) 5.55 S4
Borate buffer (0.2 M boric acid + 0.2 M sodium hydroxide) 9.20 S5
Borax 9.22 S6
Borate buffer (0.2 M boric acid + 0.2 M sodium hydroxide) 10.23 S7
Aqueous ammonia (30%) 13.35 S8
0.1 M Potassium dihydrogen phosphate 5.35 S9](https://image.slidesharecdn.com/b0460510-150425004231-conversion-gate02/75/TLC-Separation-of-Cephalosporins-on-Stannic-Arsenate-Layers-5-2048.jpg)


The study explores thin layer chromatography (TLC) for the separation of cephalosporins using stannic arsenate layers with citrate and borate buffers. This method demonstrated effectiveness in estimating cephalosporins from patient blood serum, with a limit of detection of 0.20 μg/l. The research highlights the simplicity, rapidity, and reproducibility of the technique alongside its applicability to other biological samples.