Downloaded 115 times
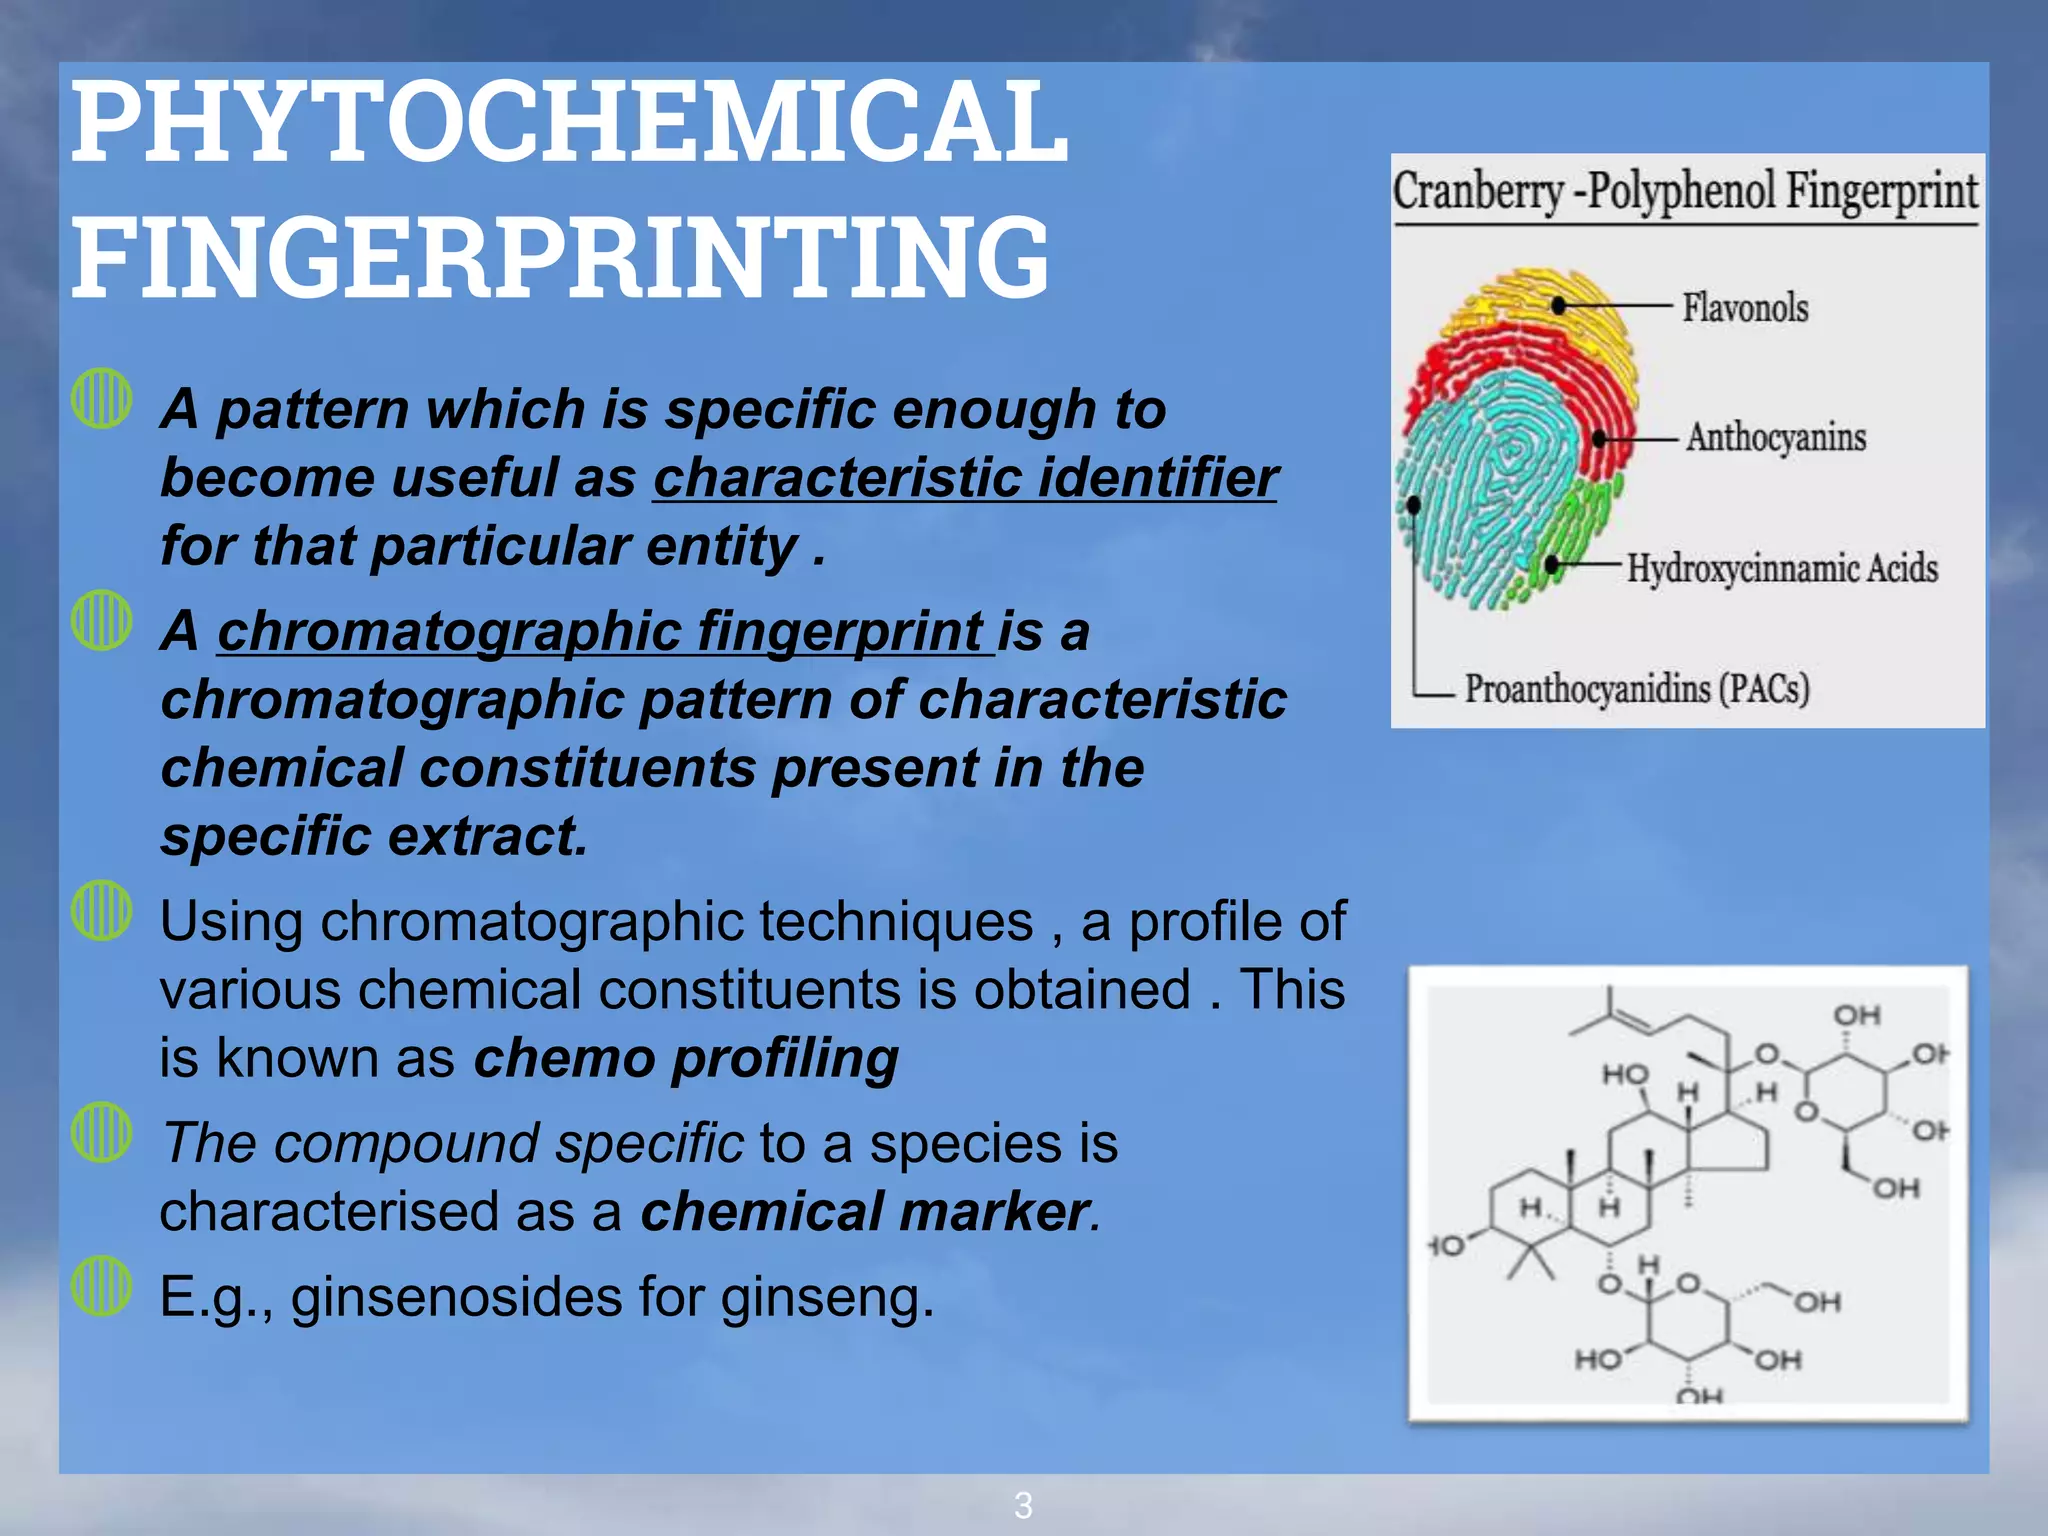
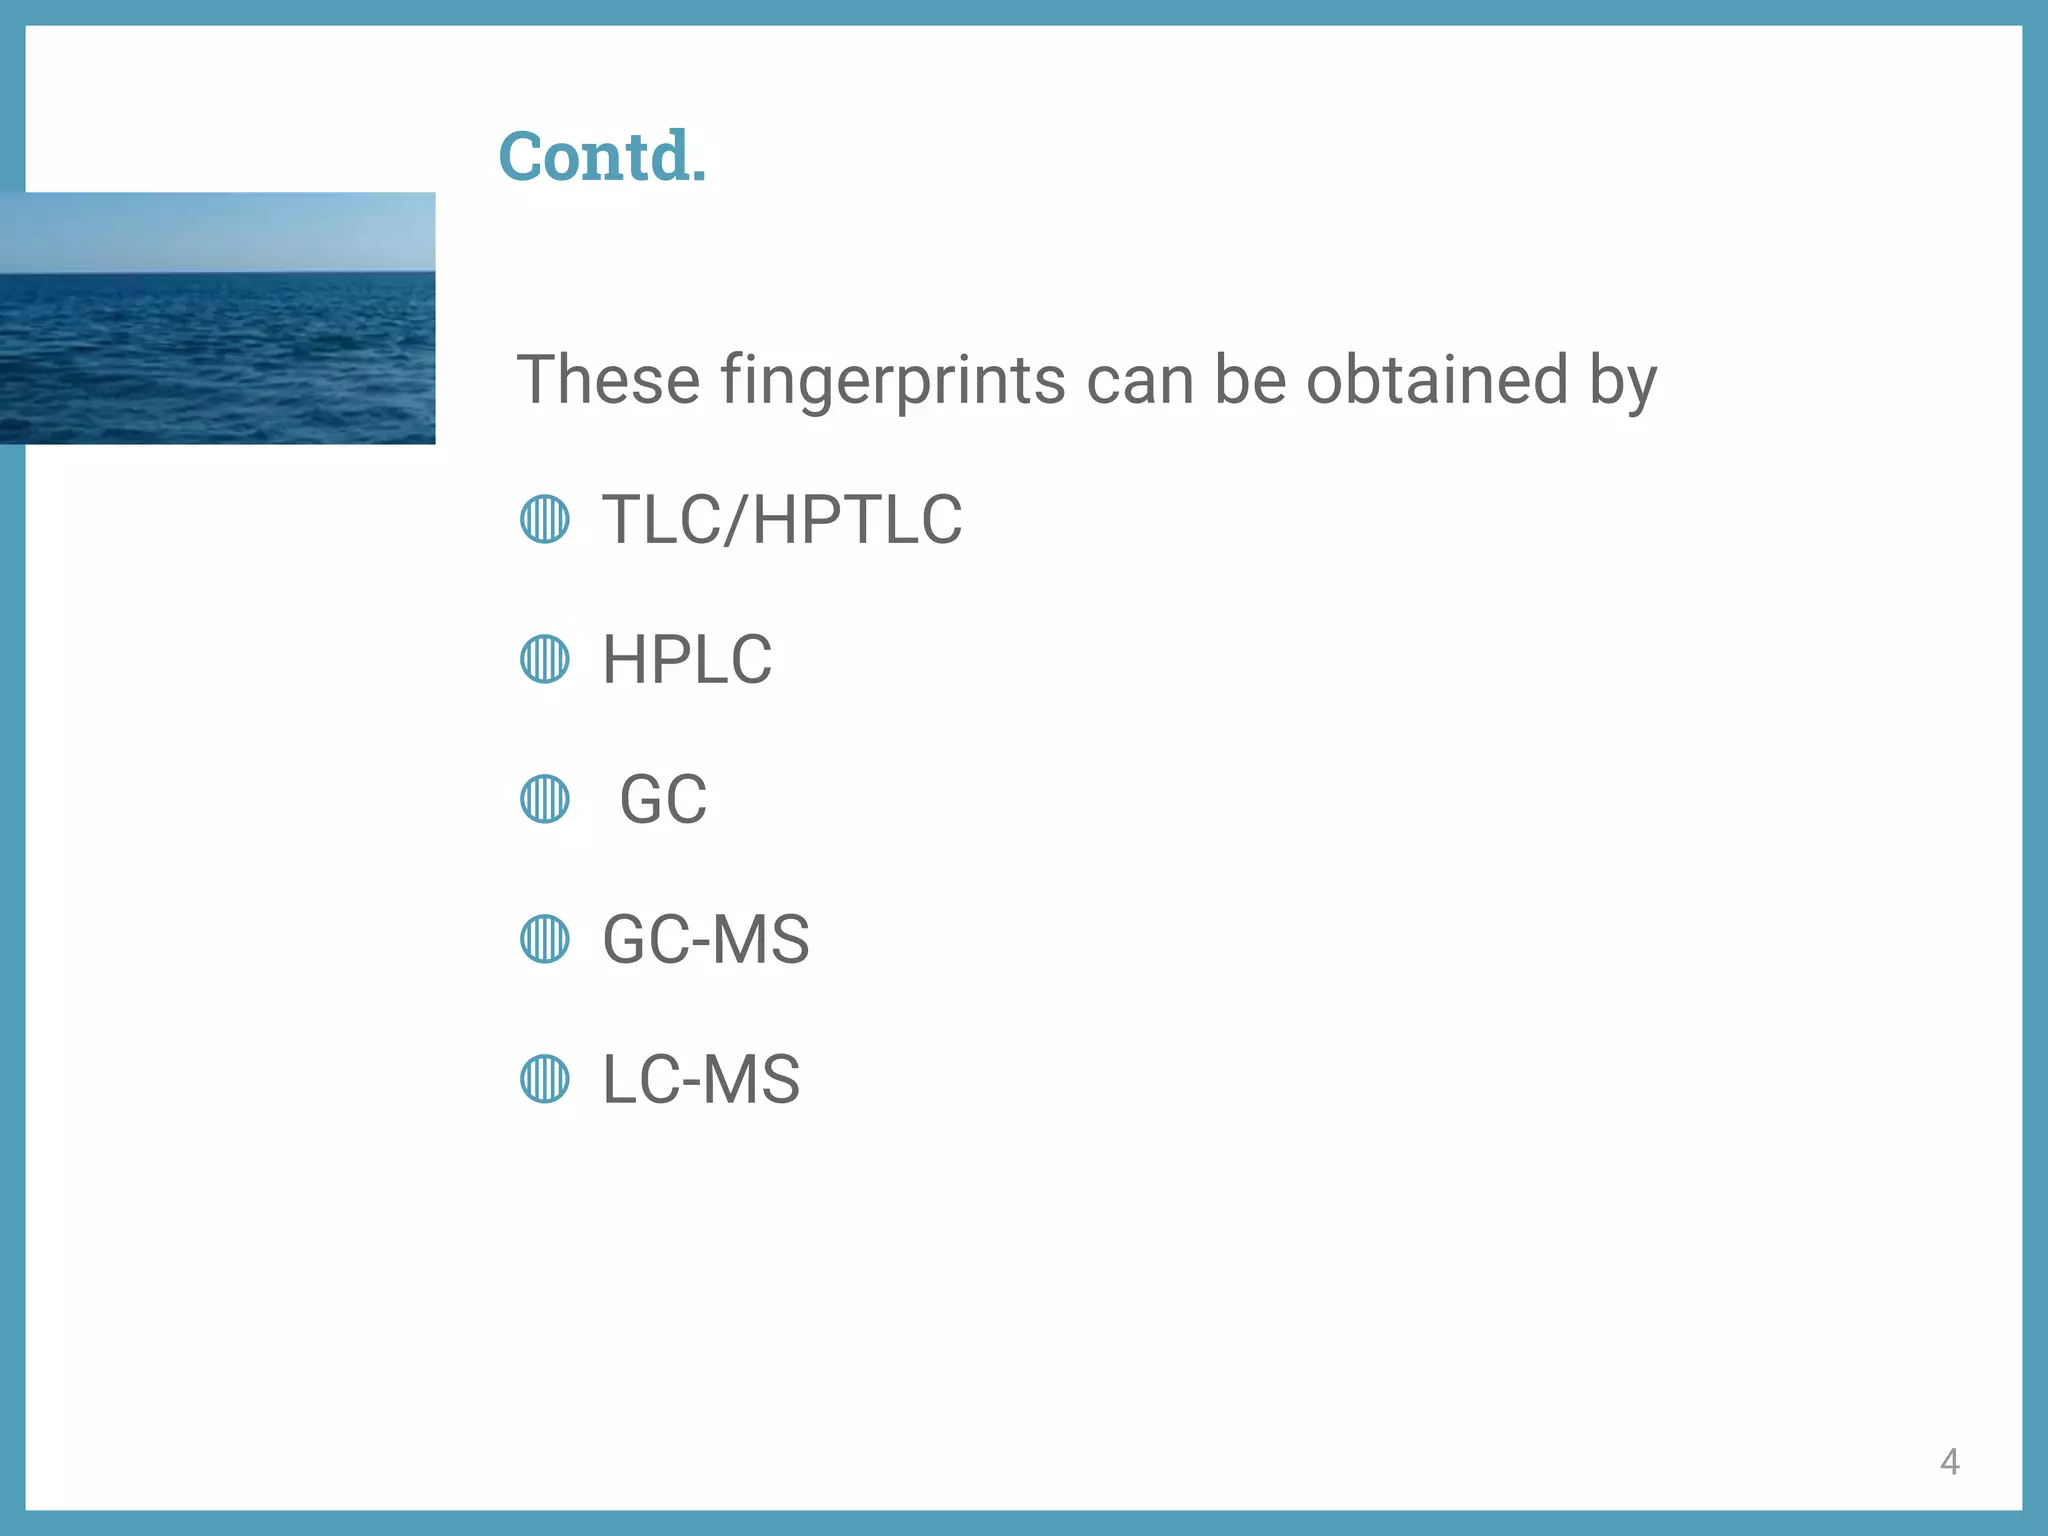
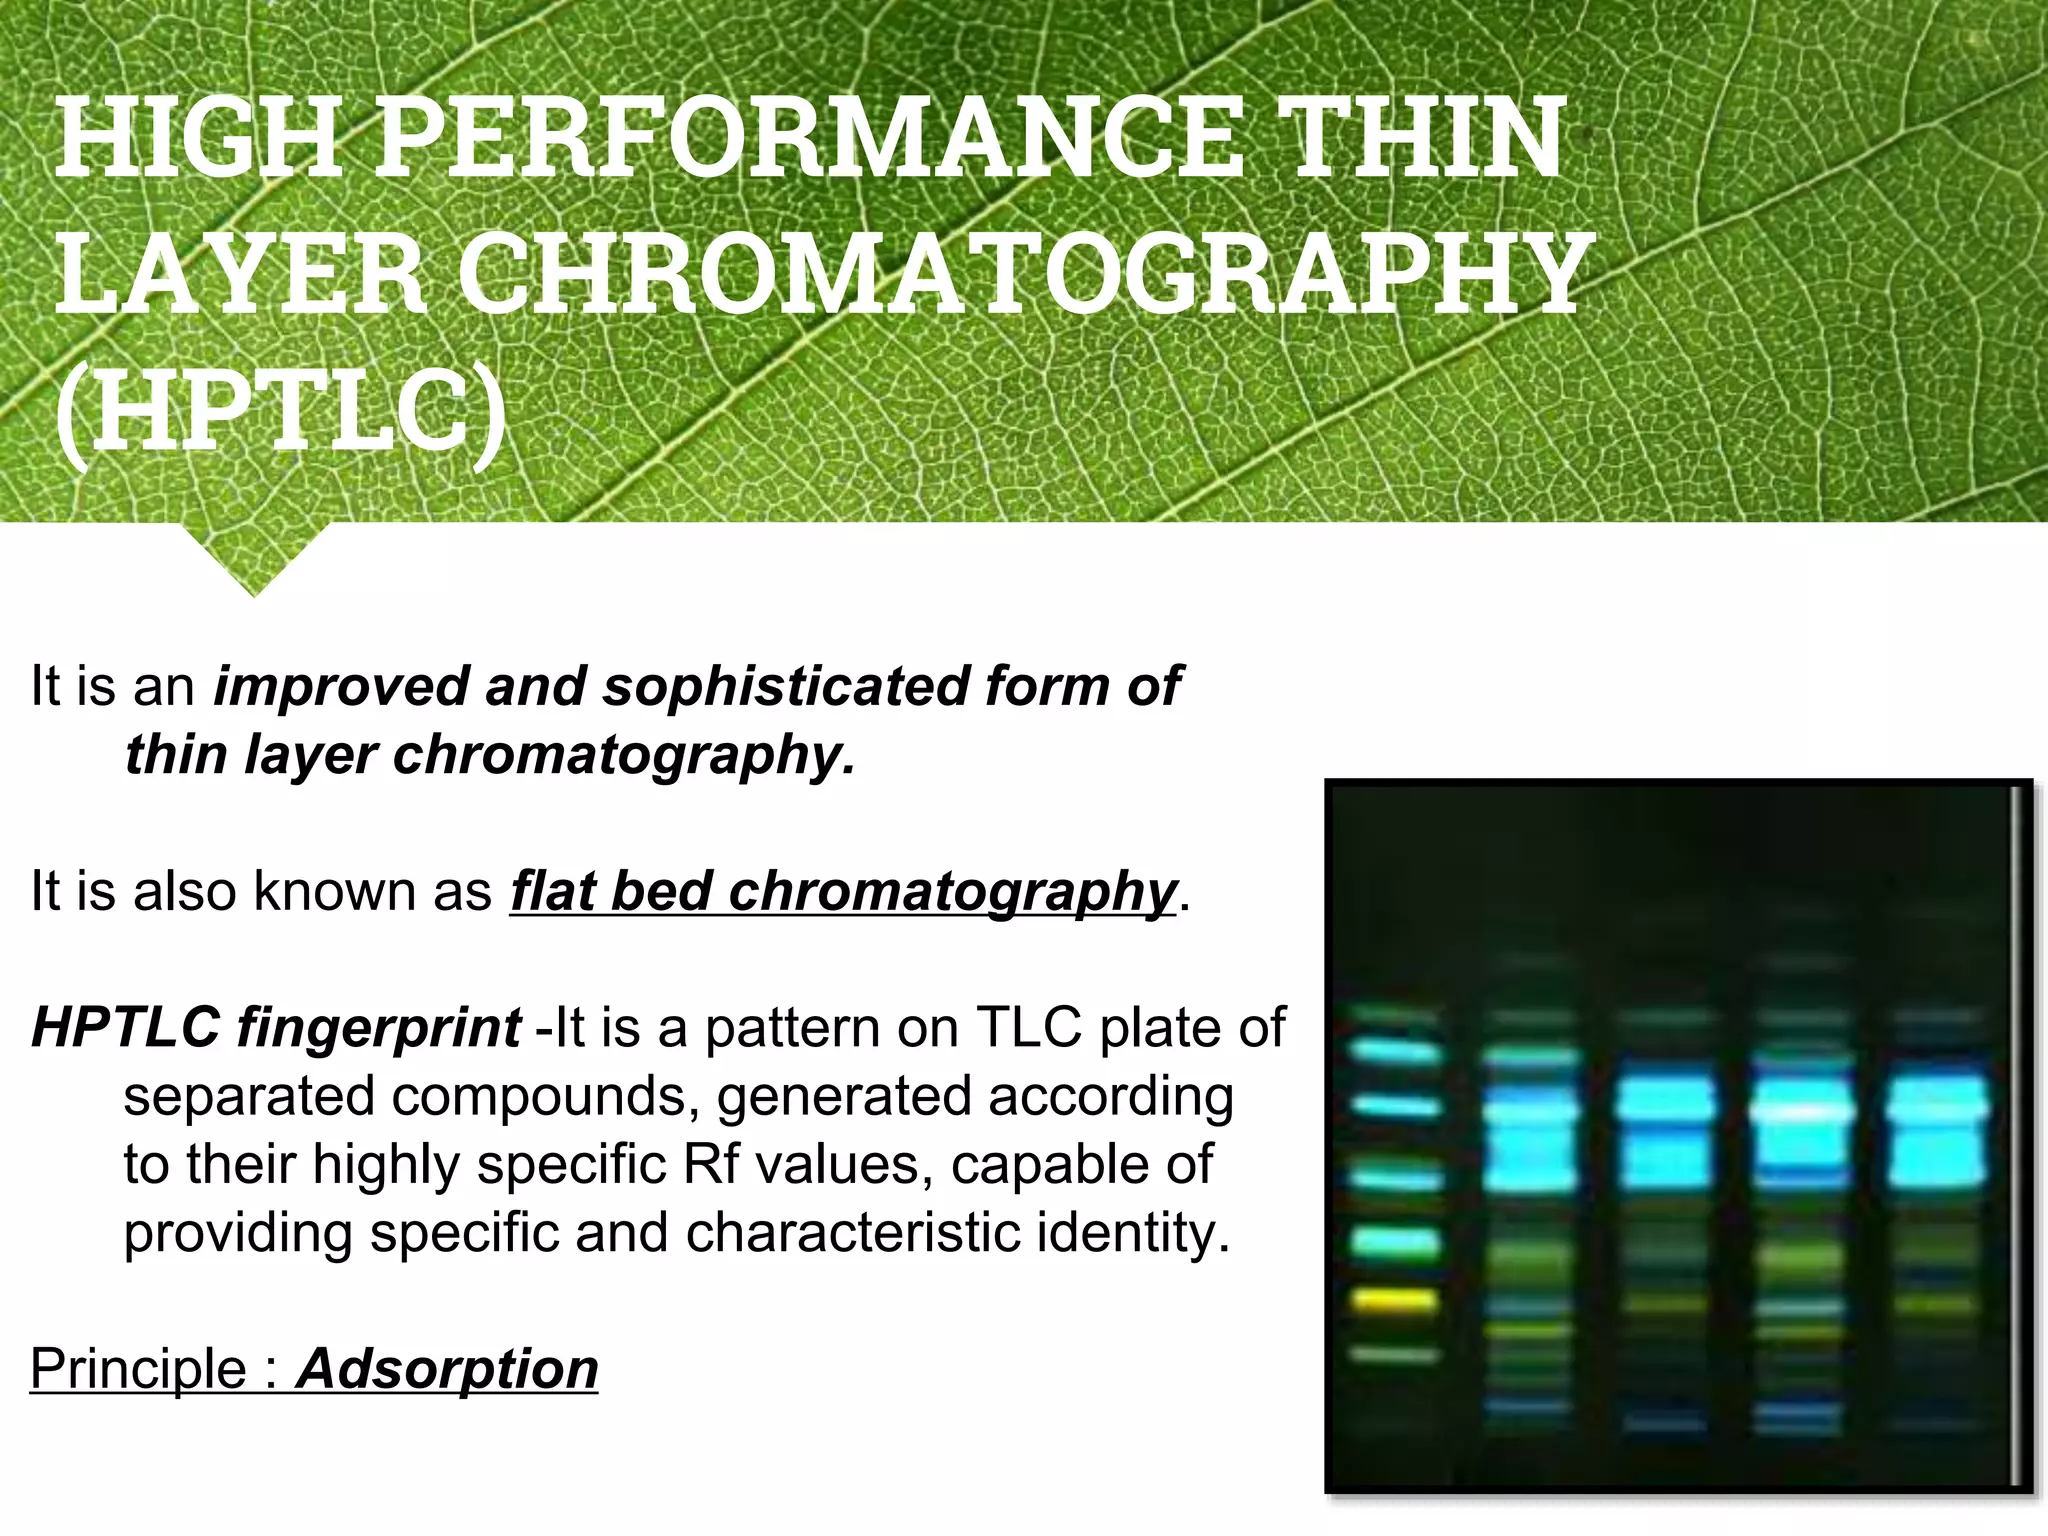
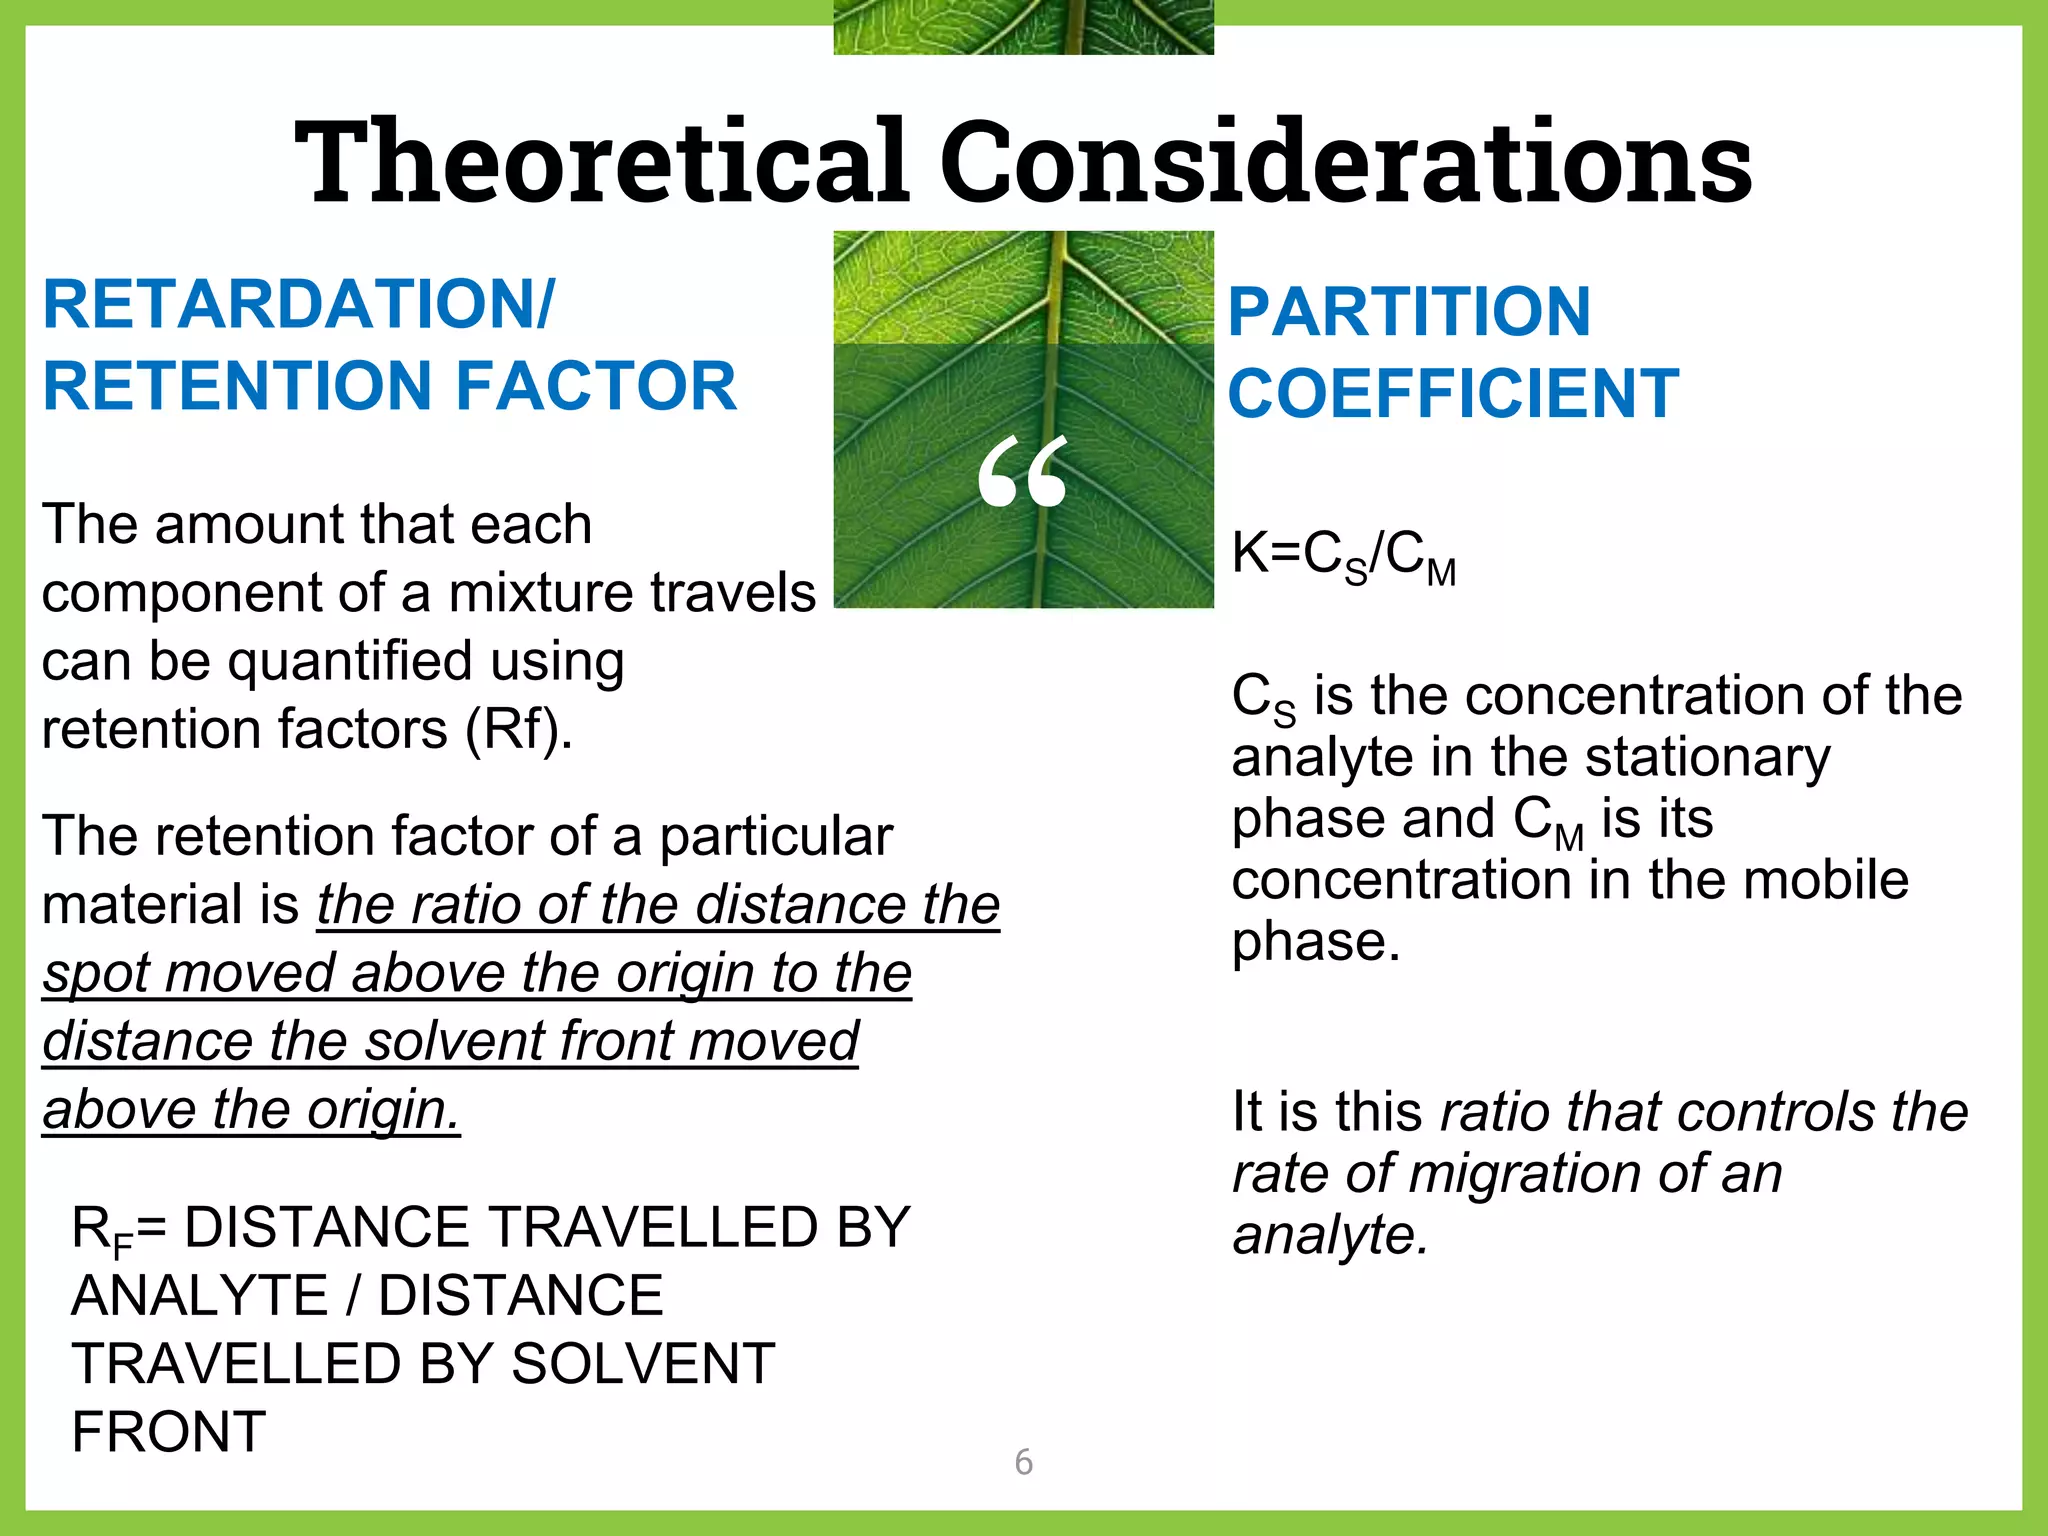
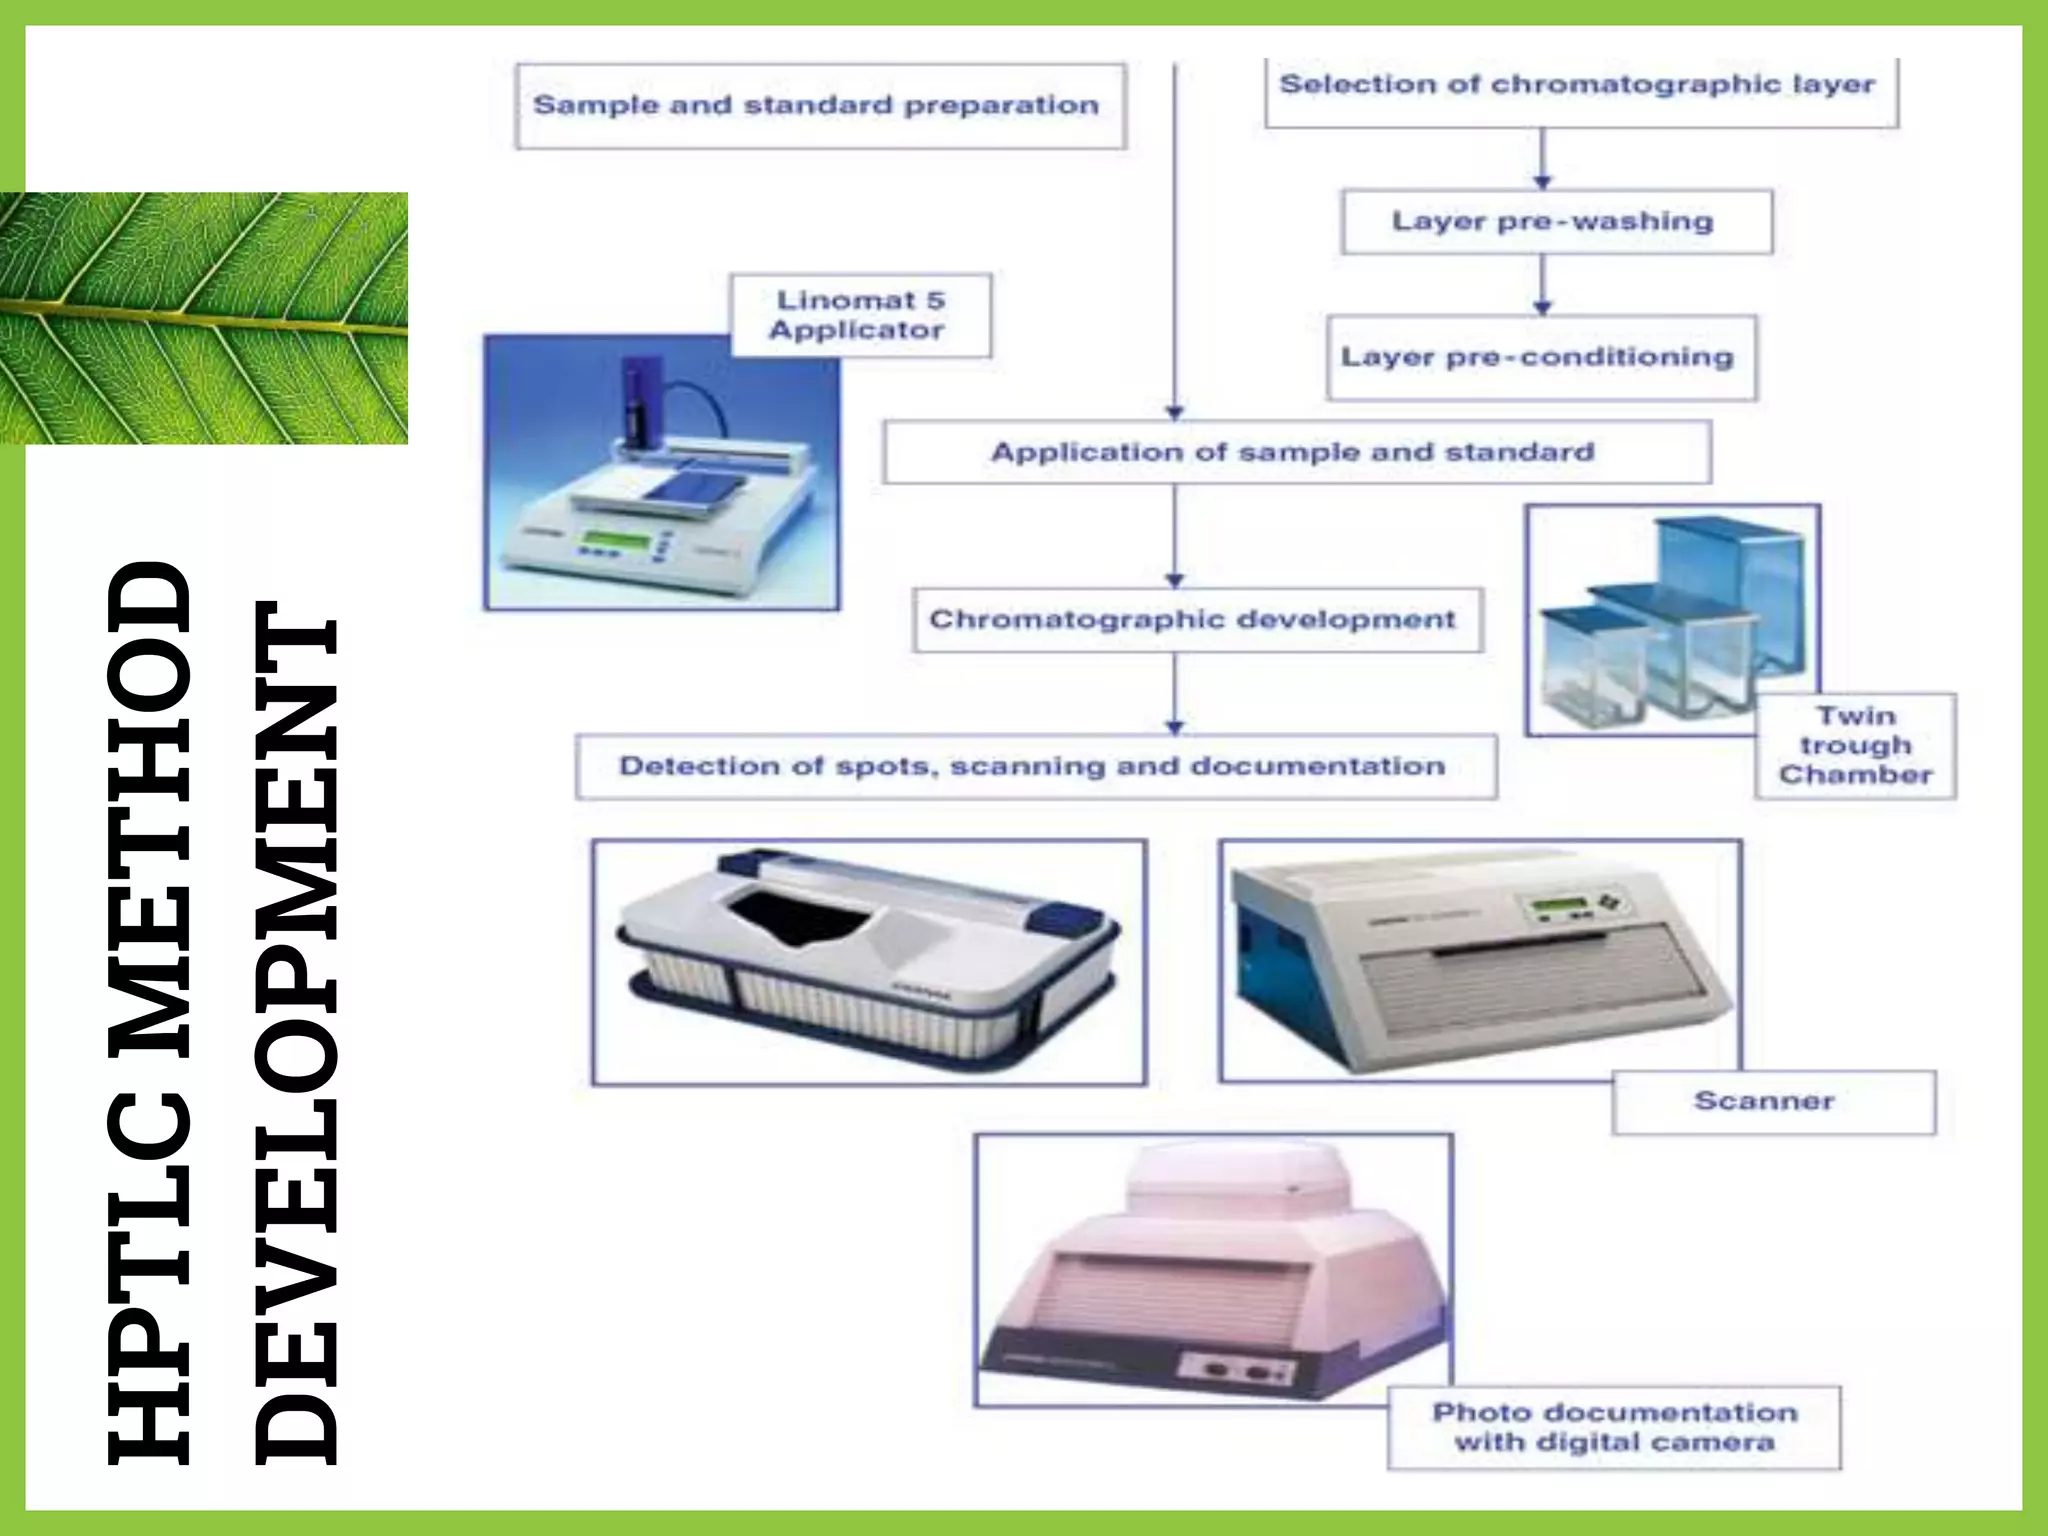
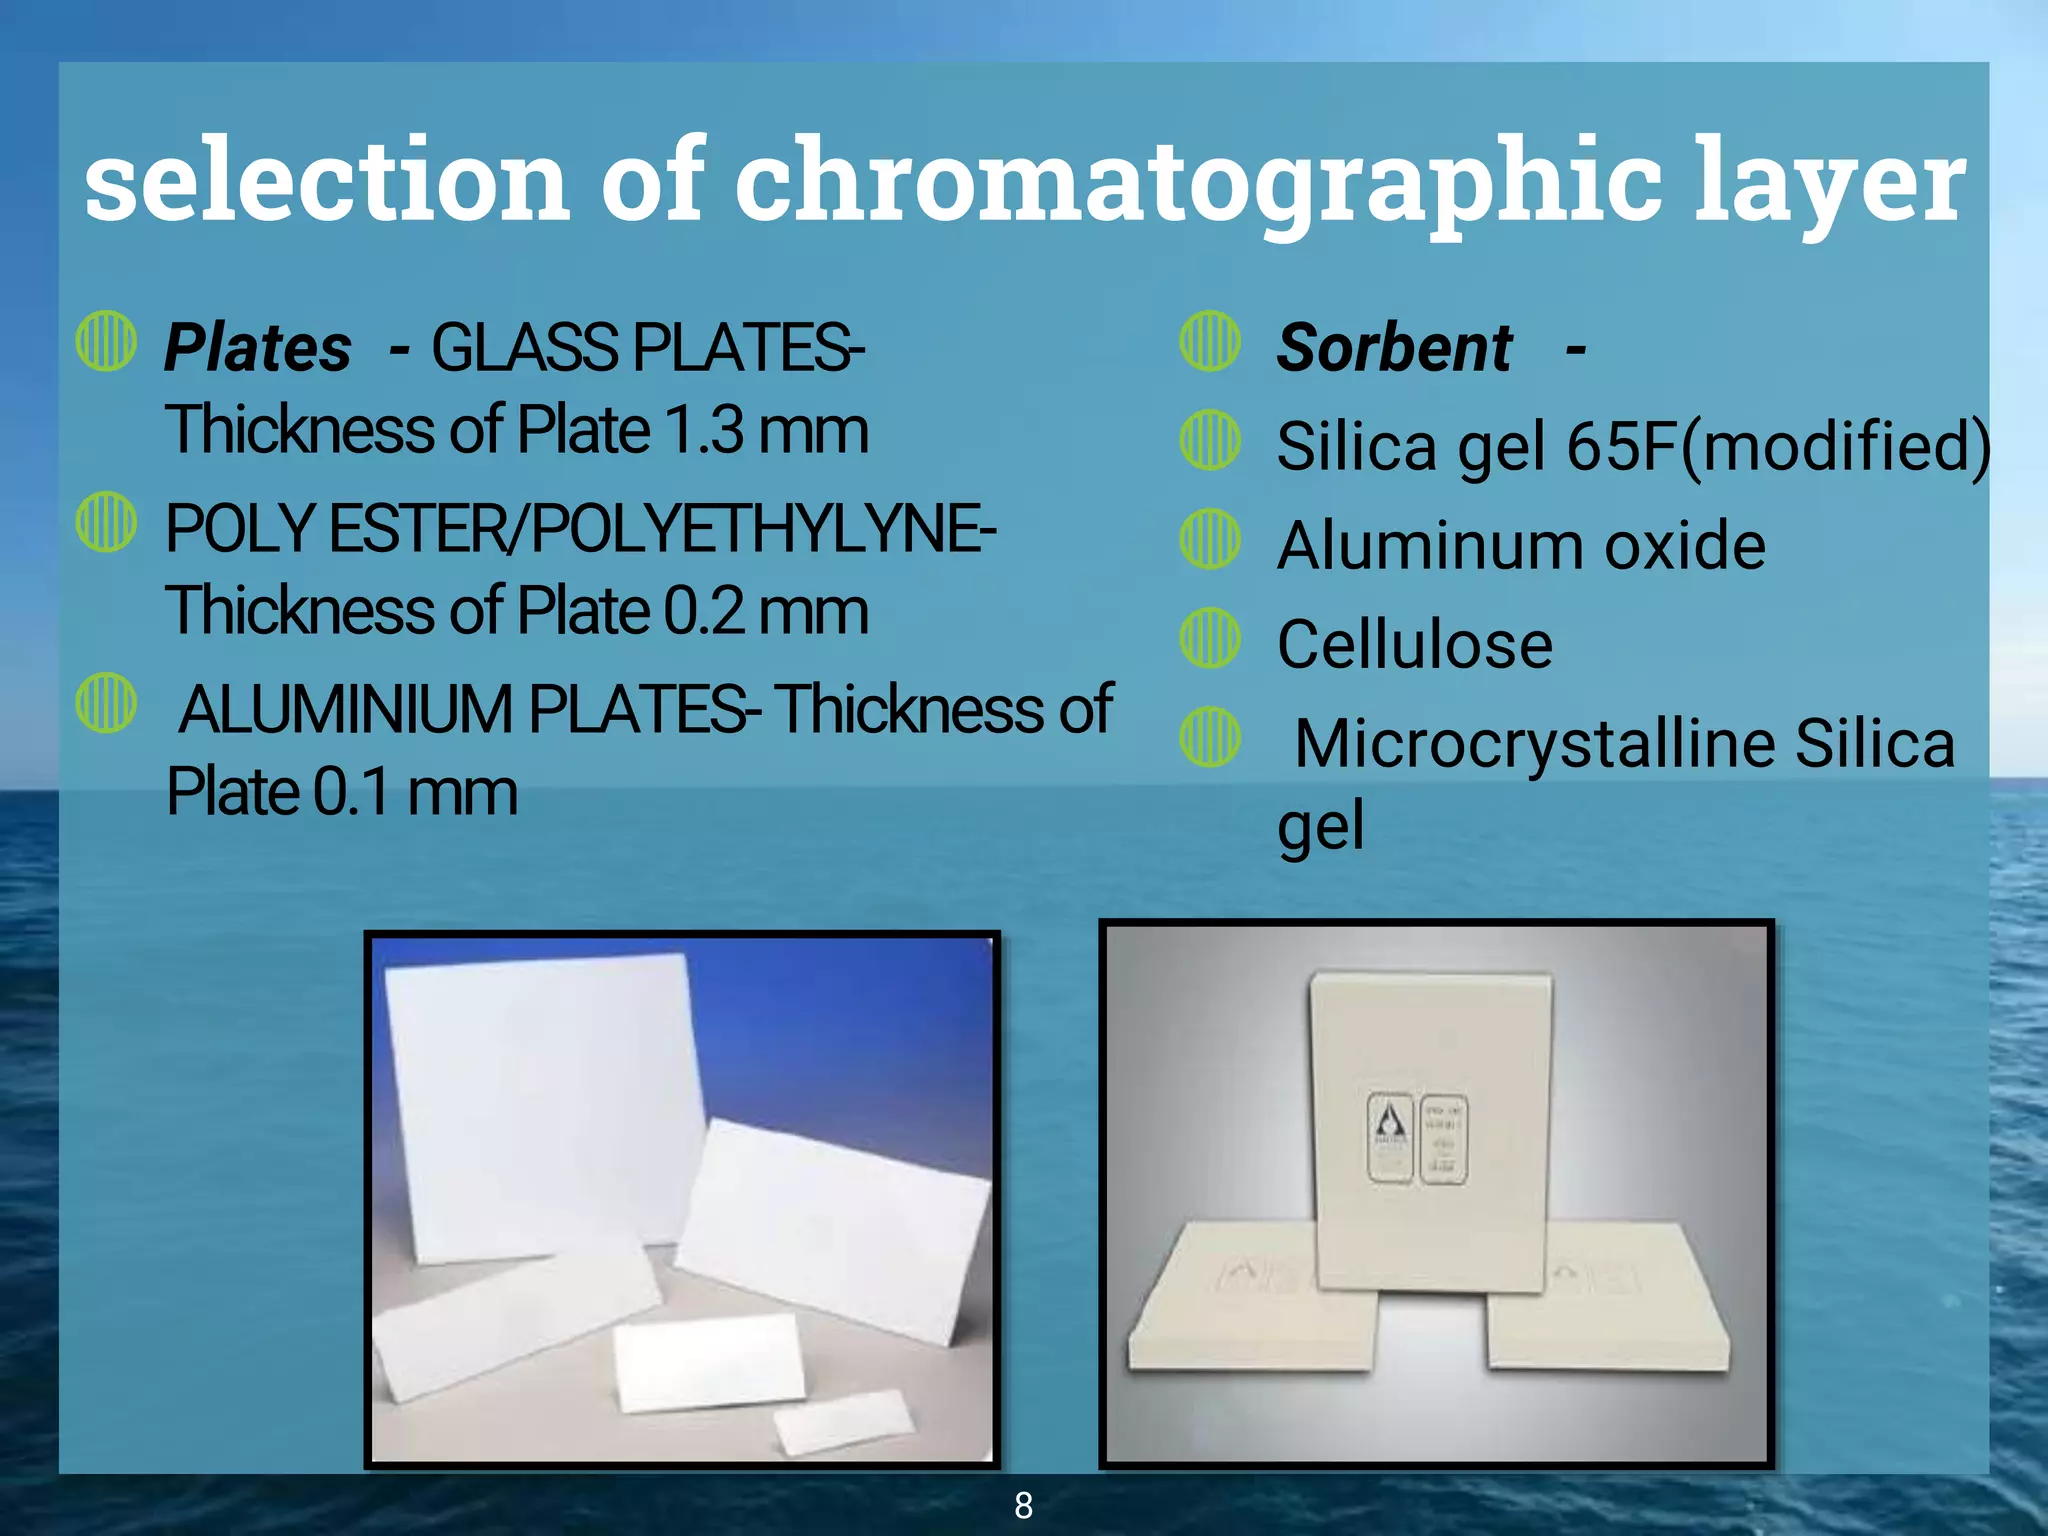
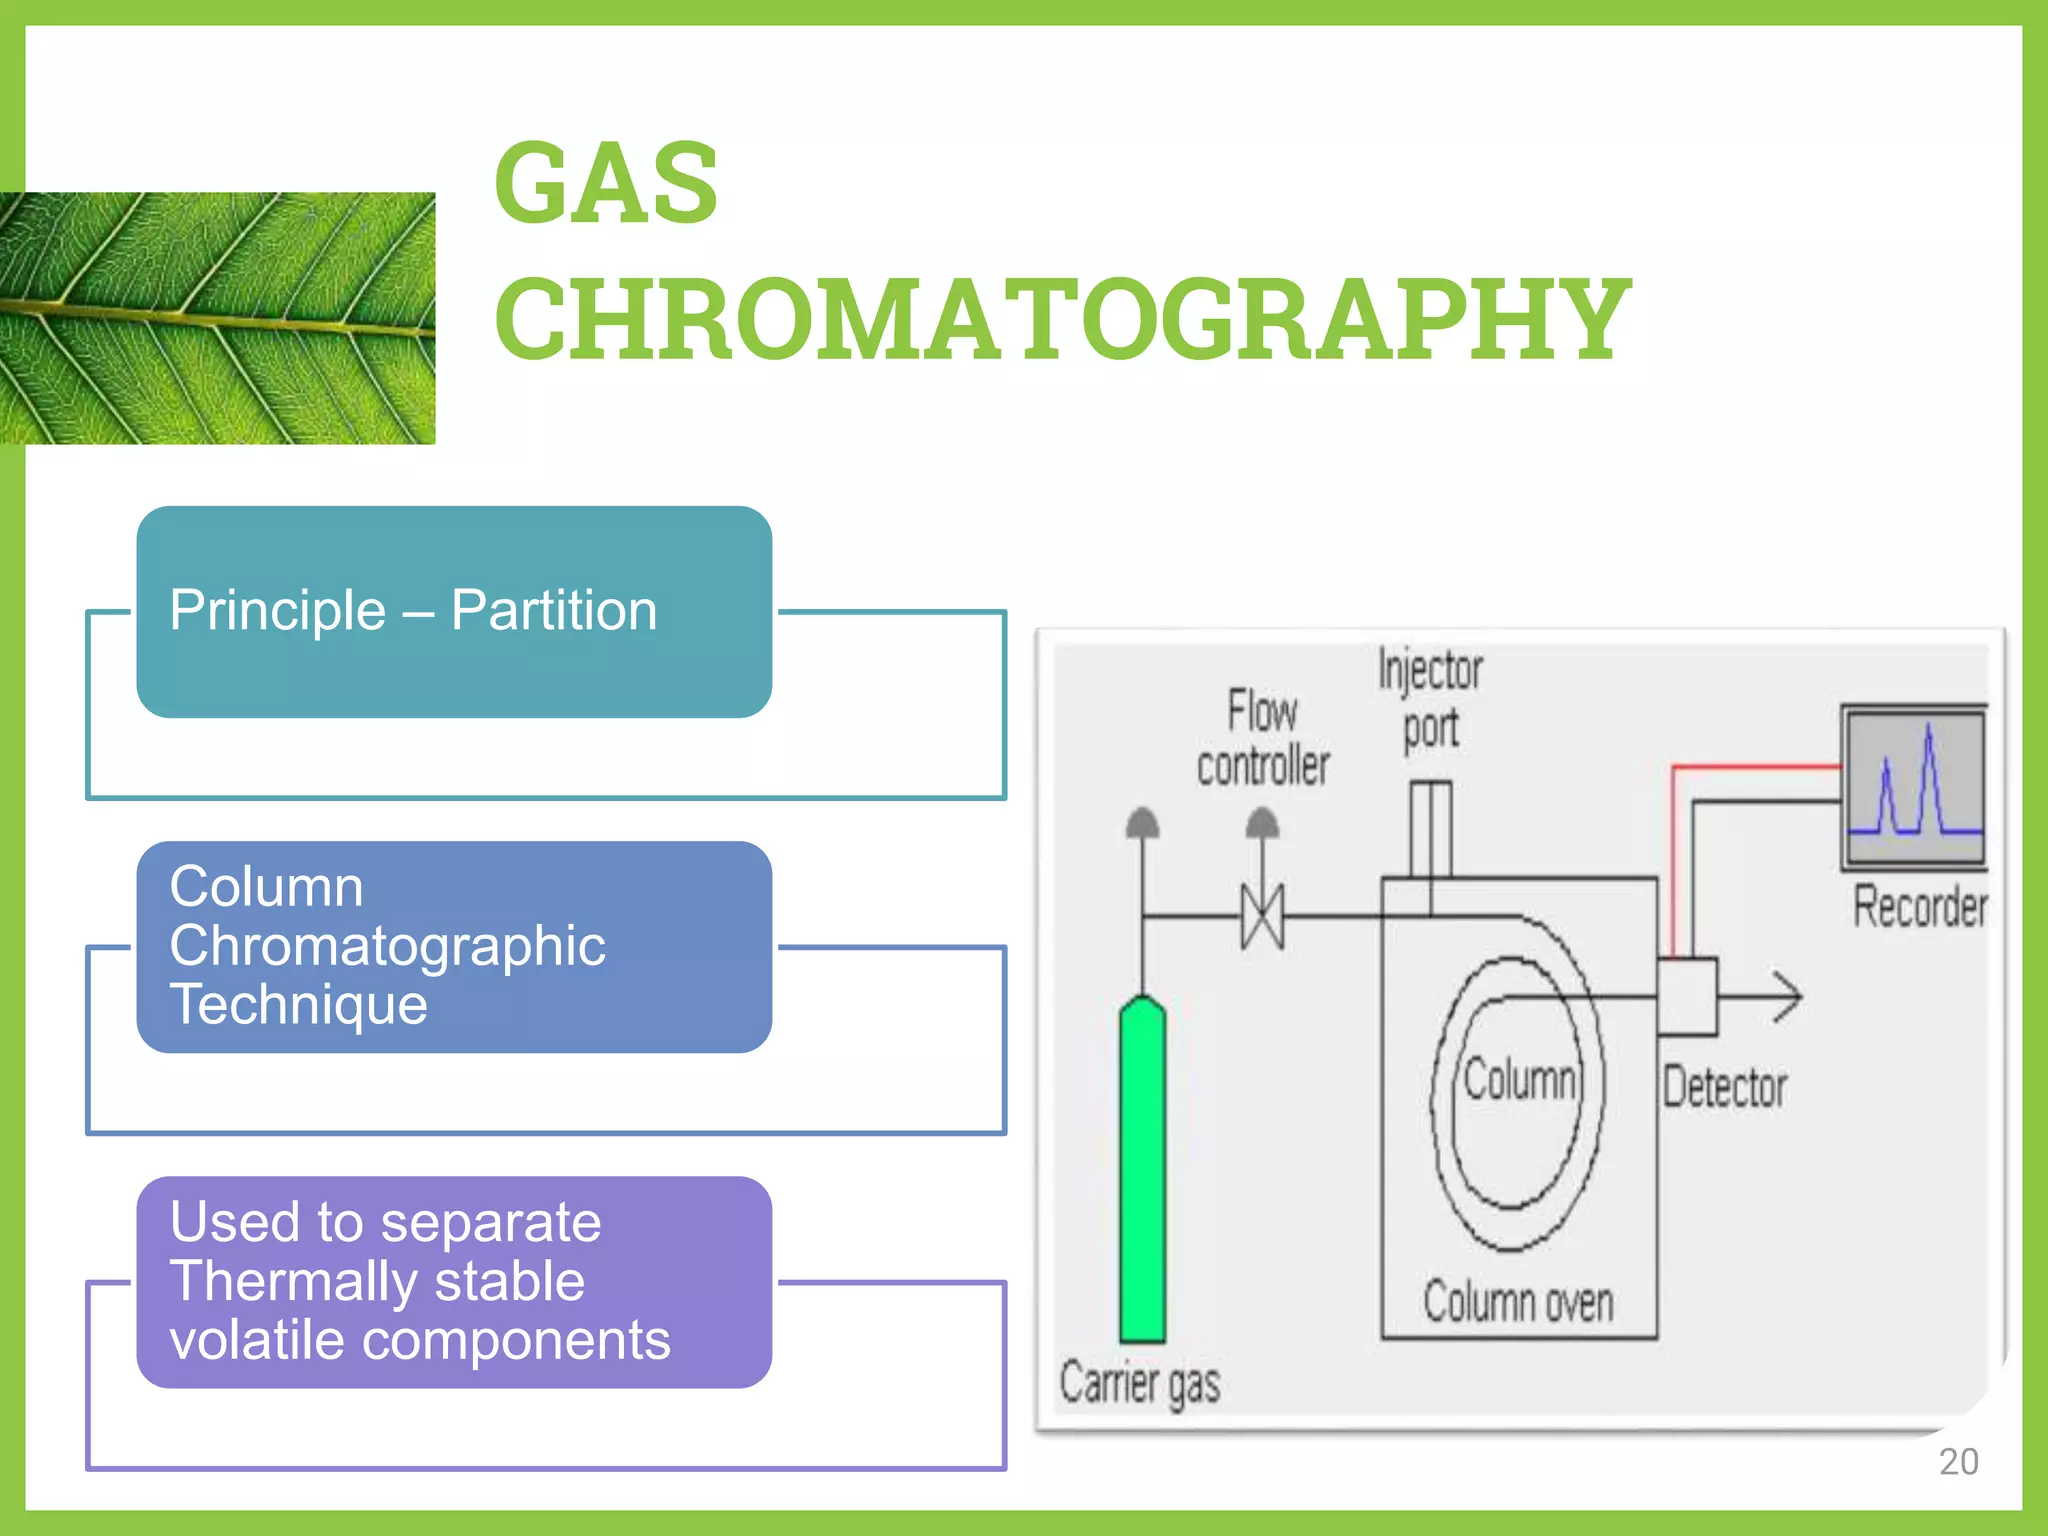
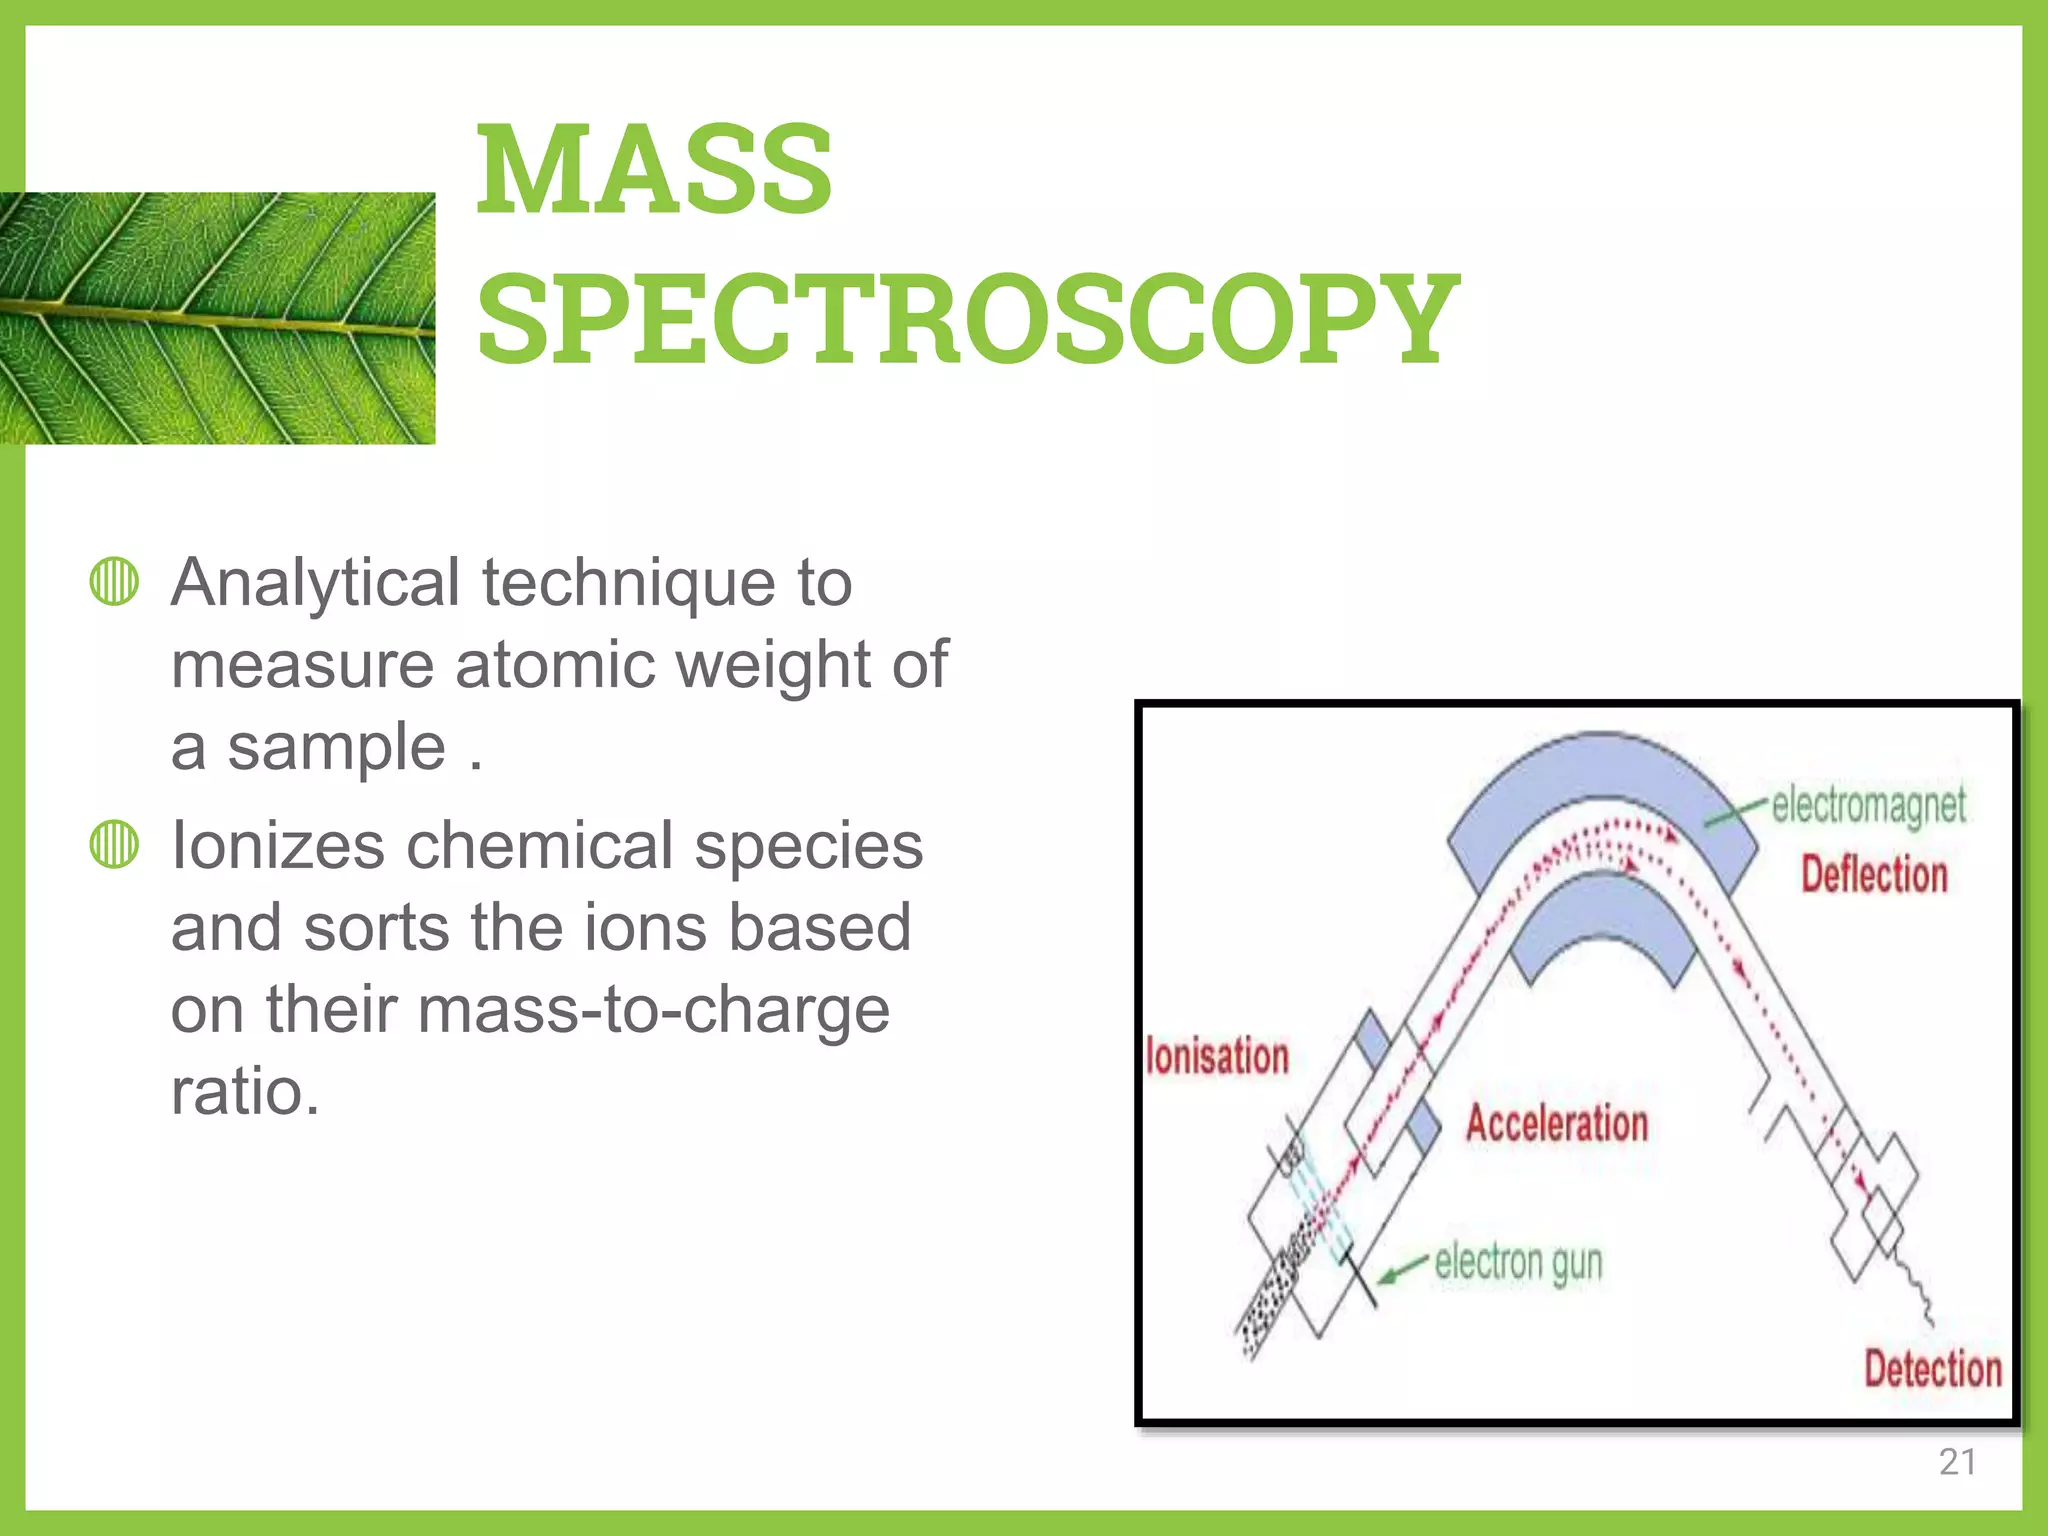
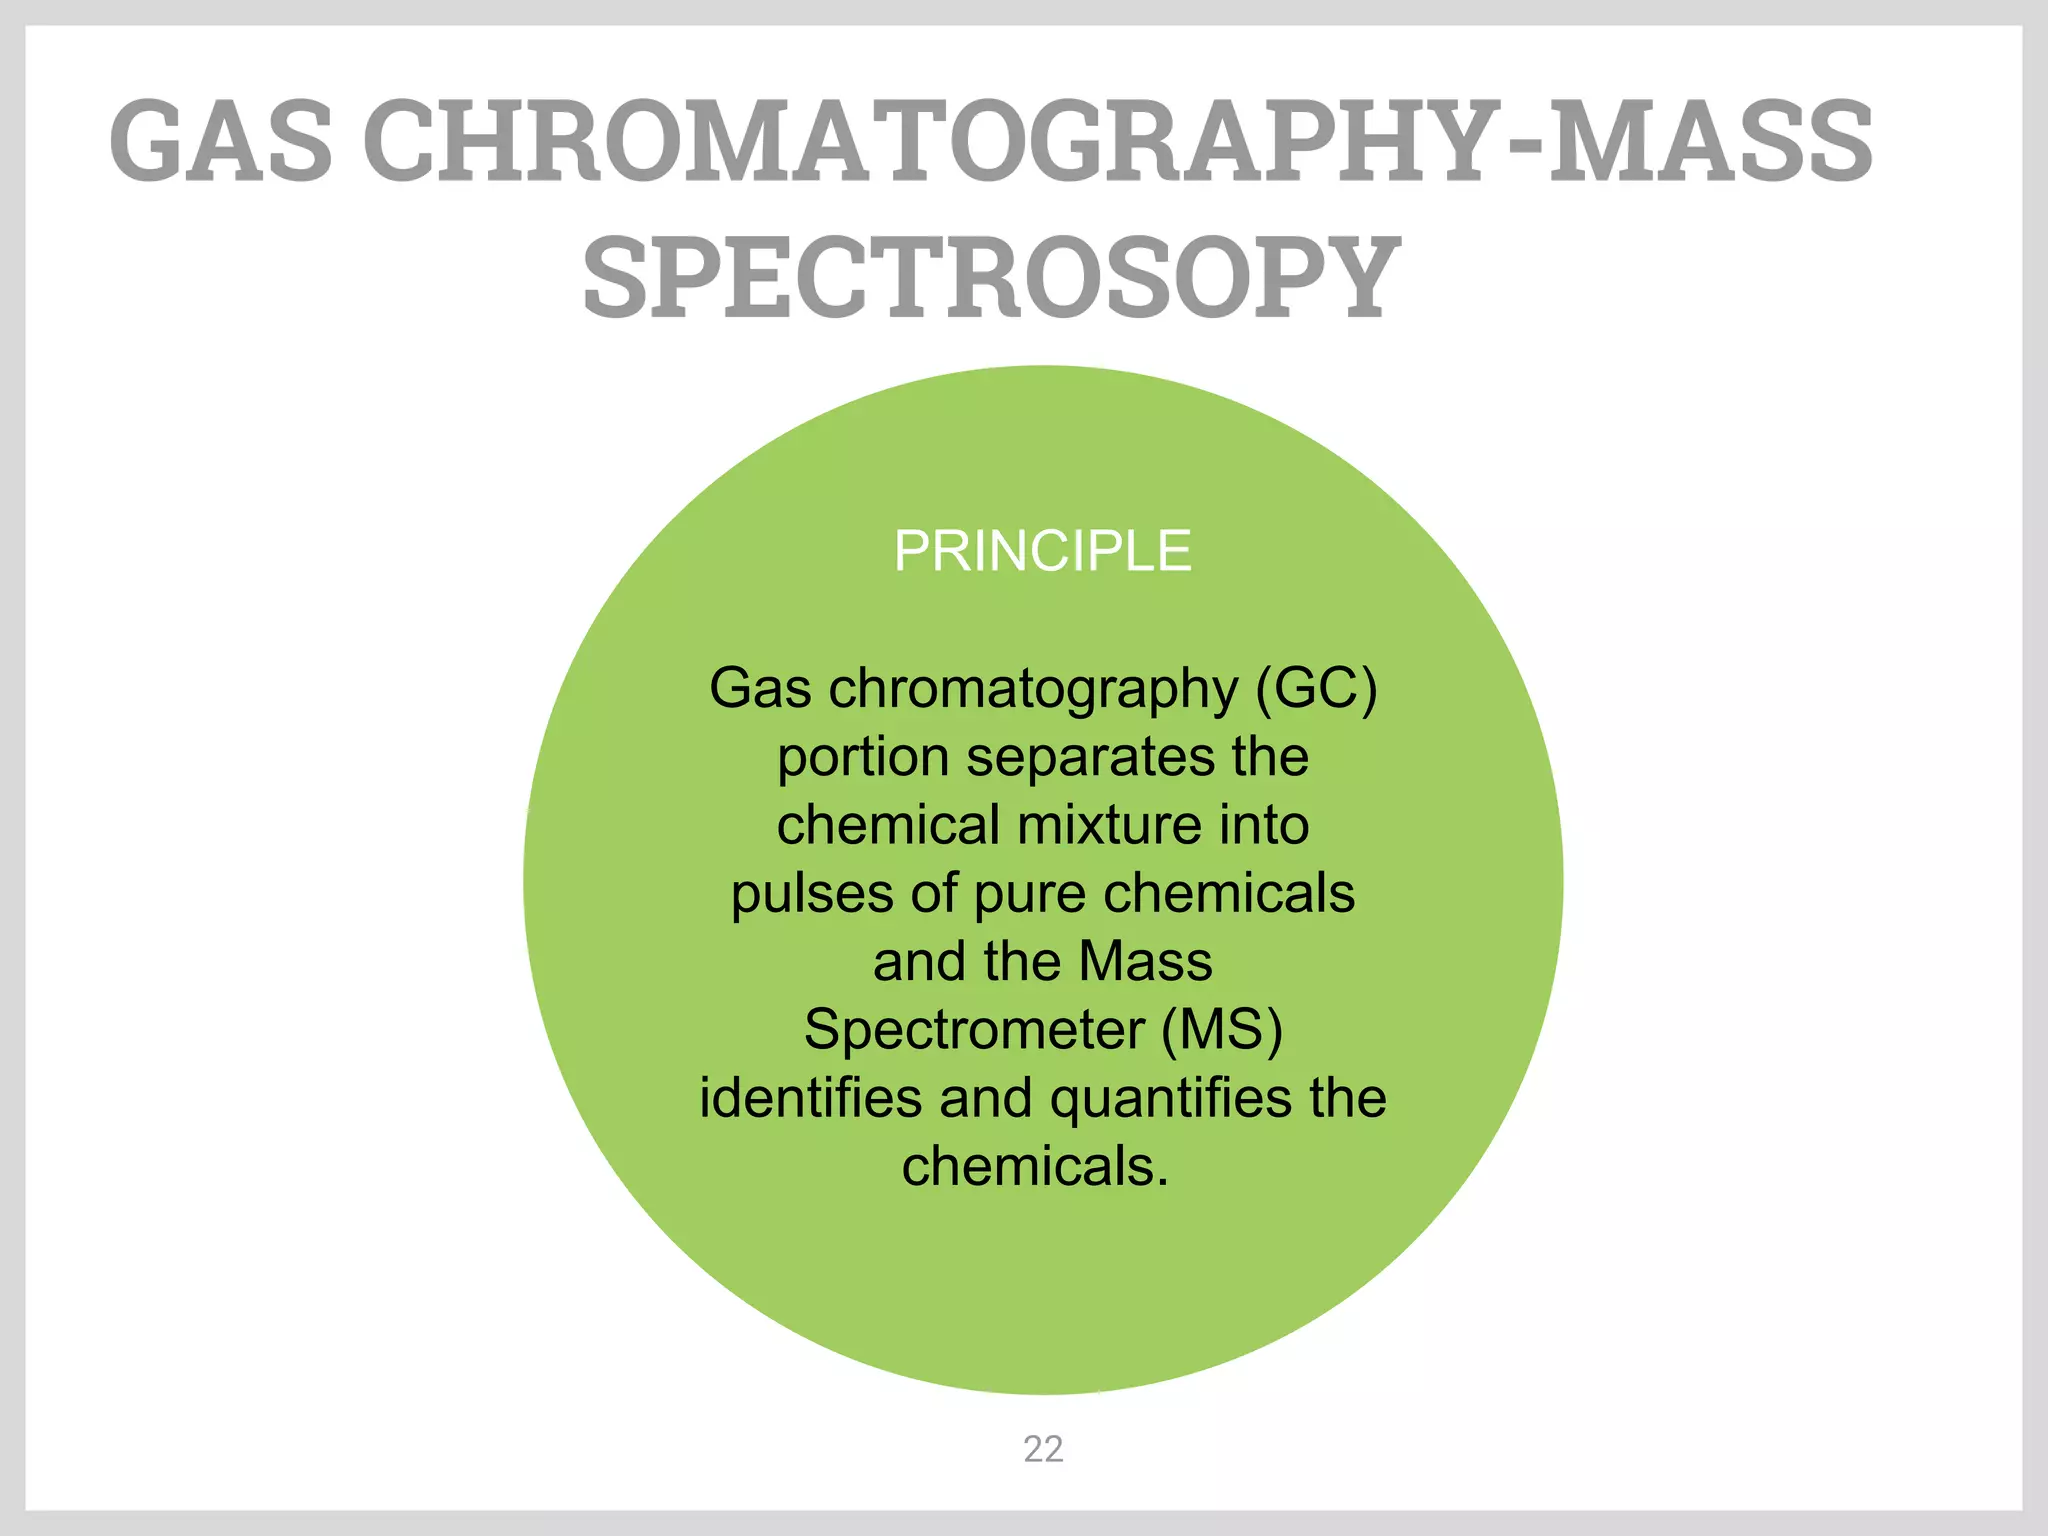
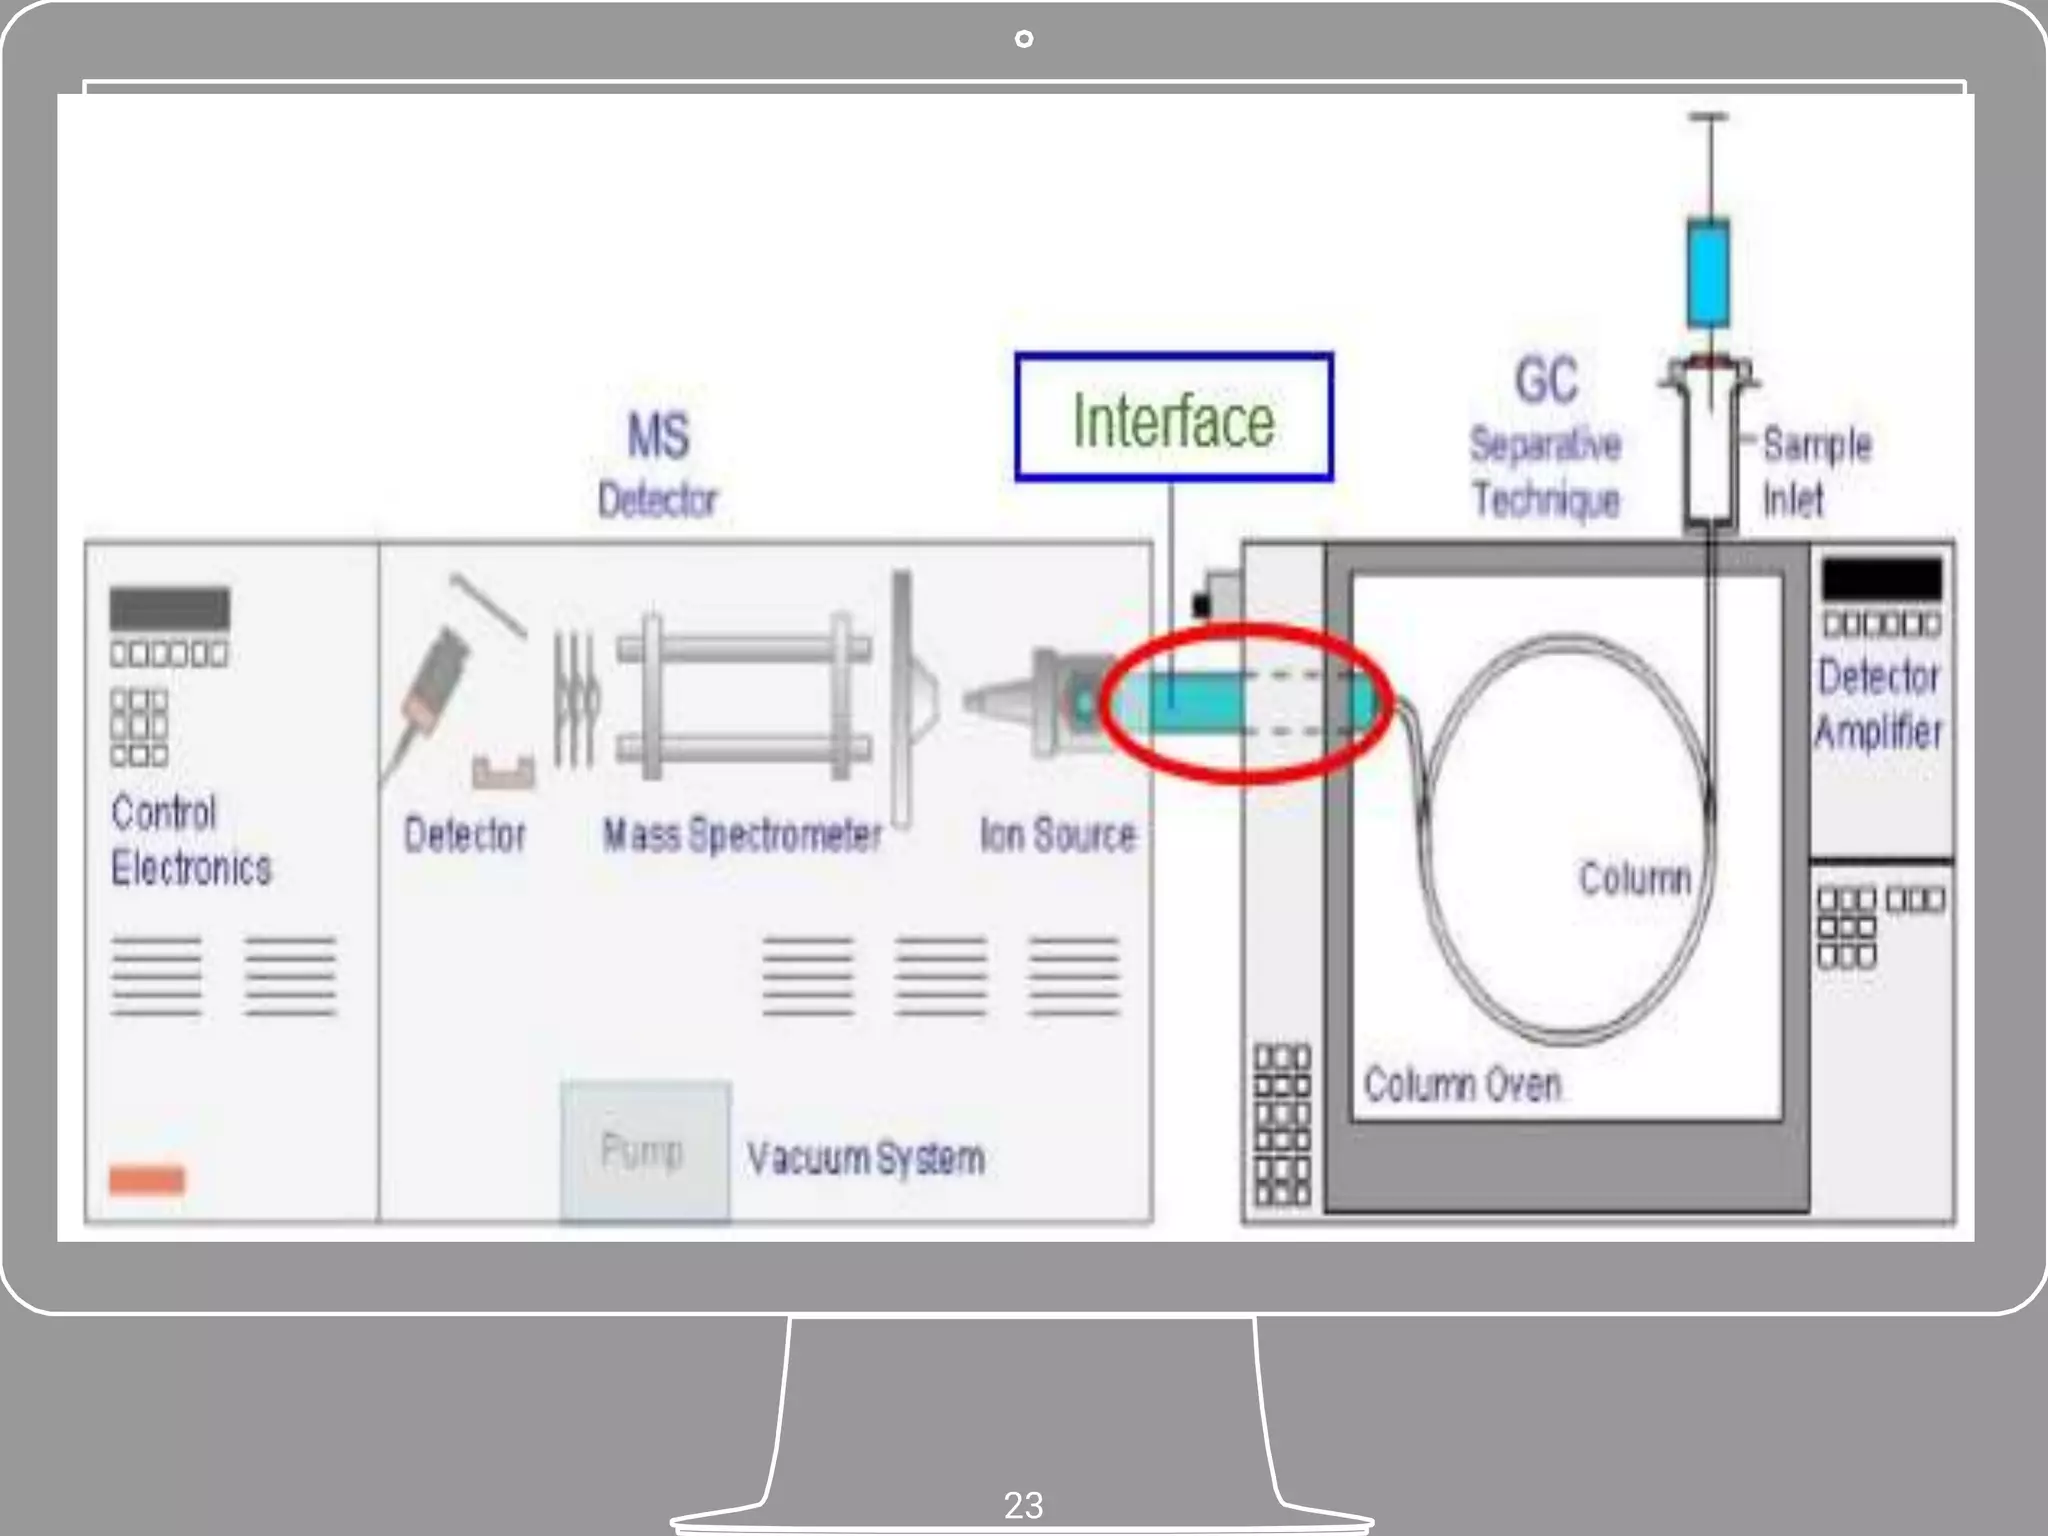
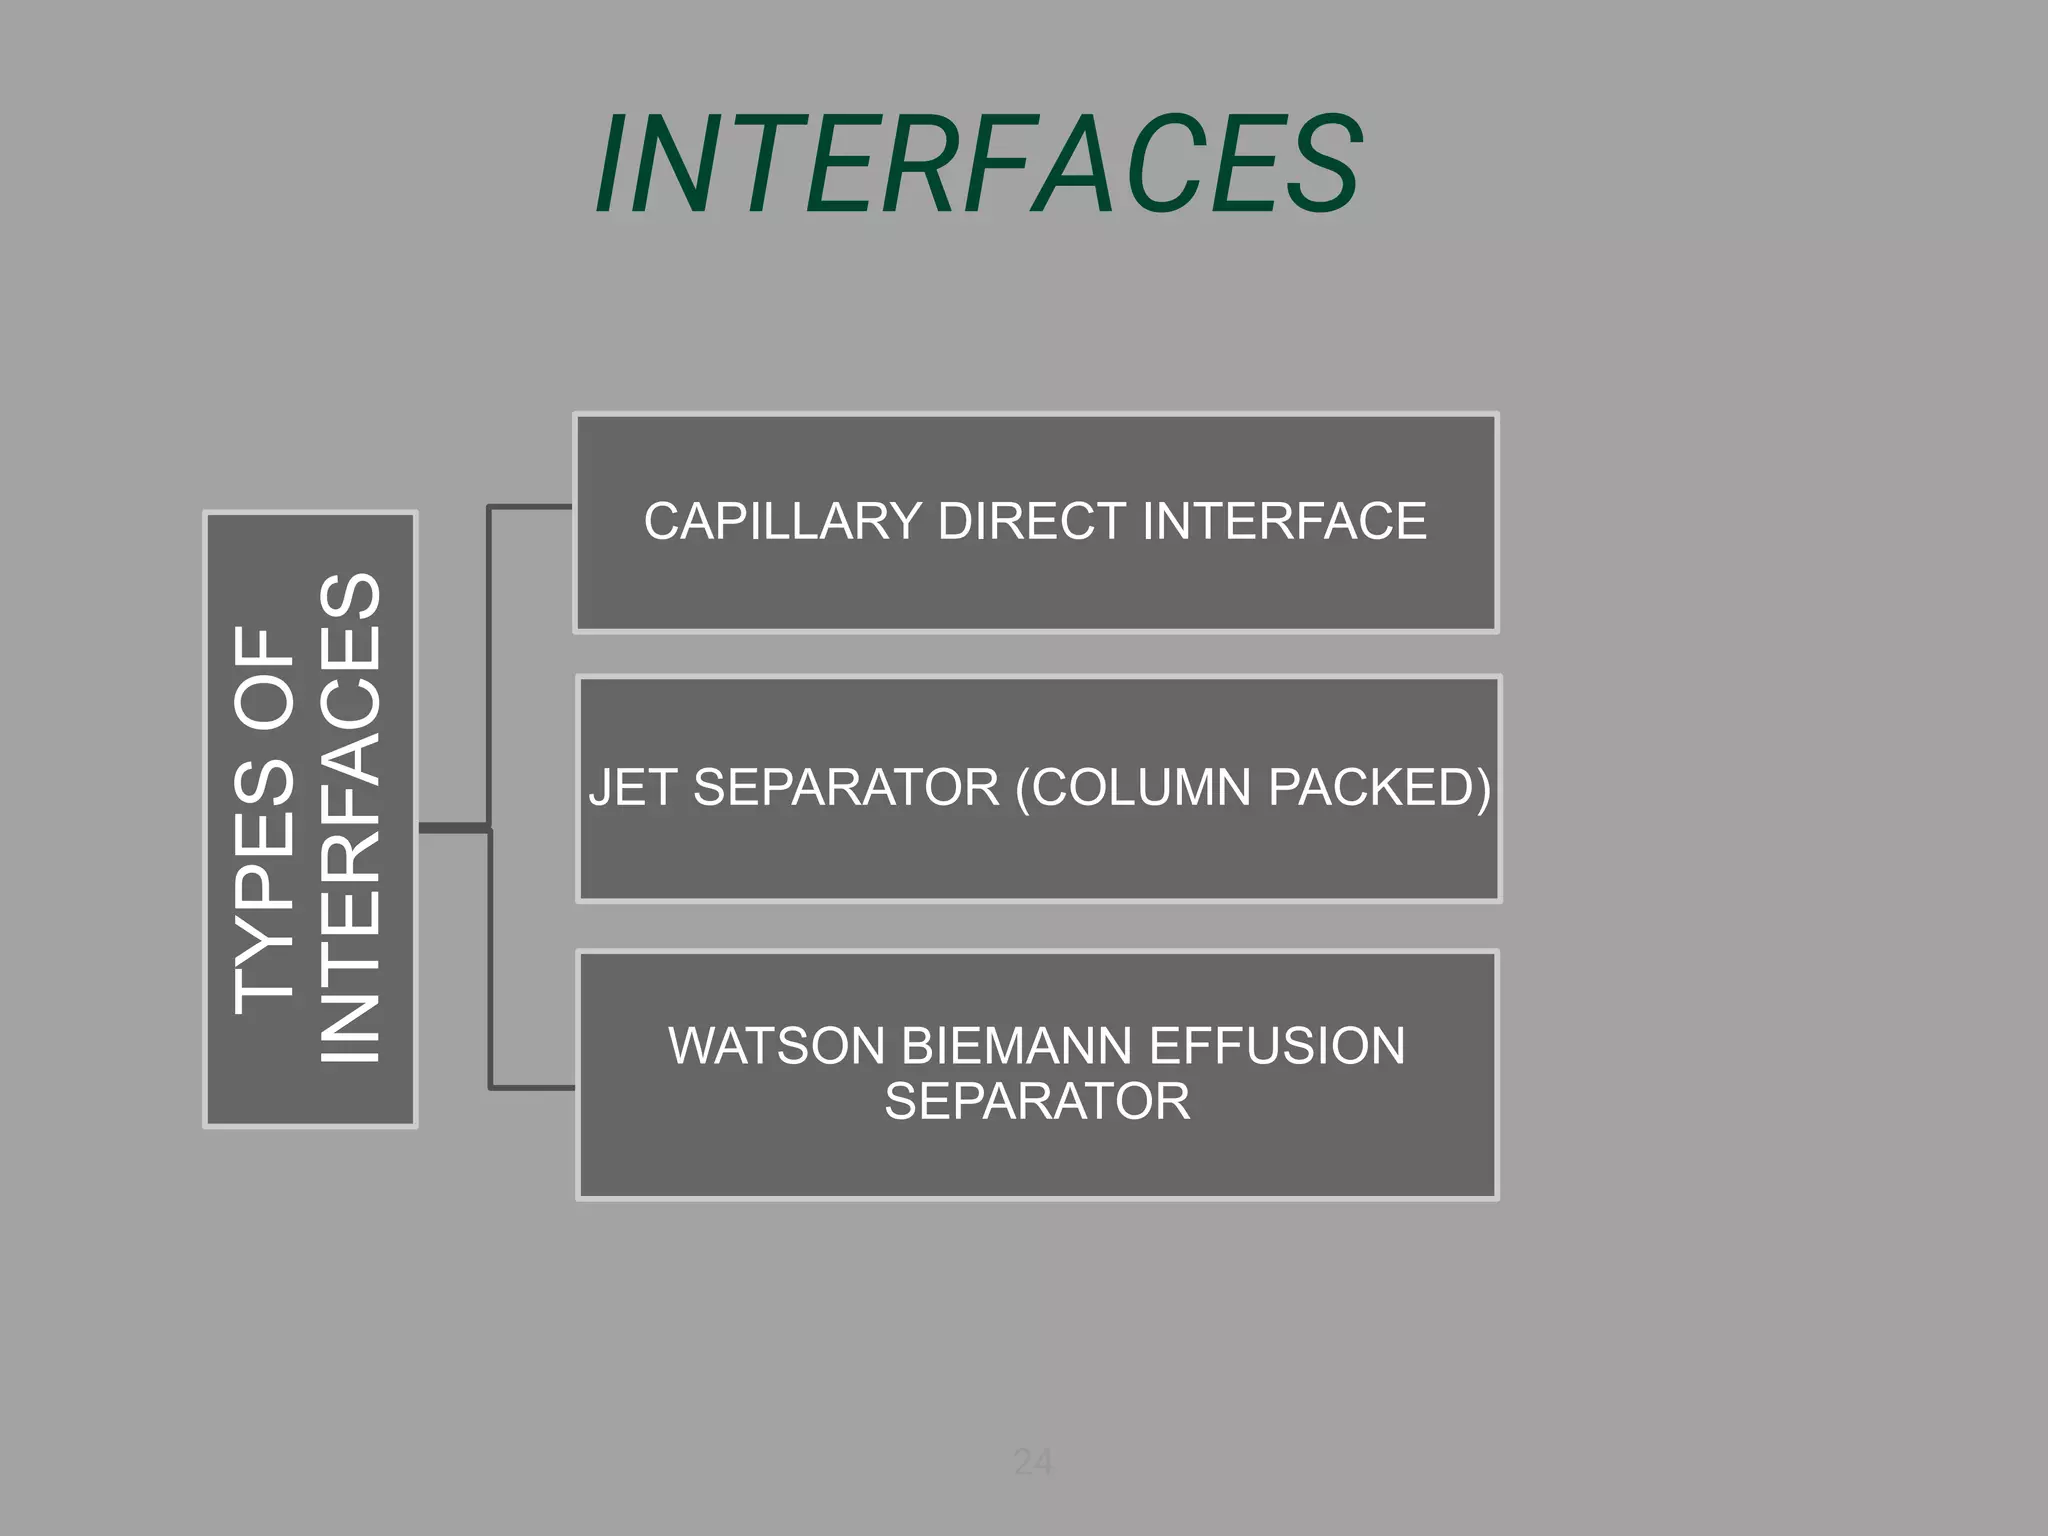
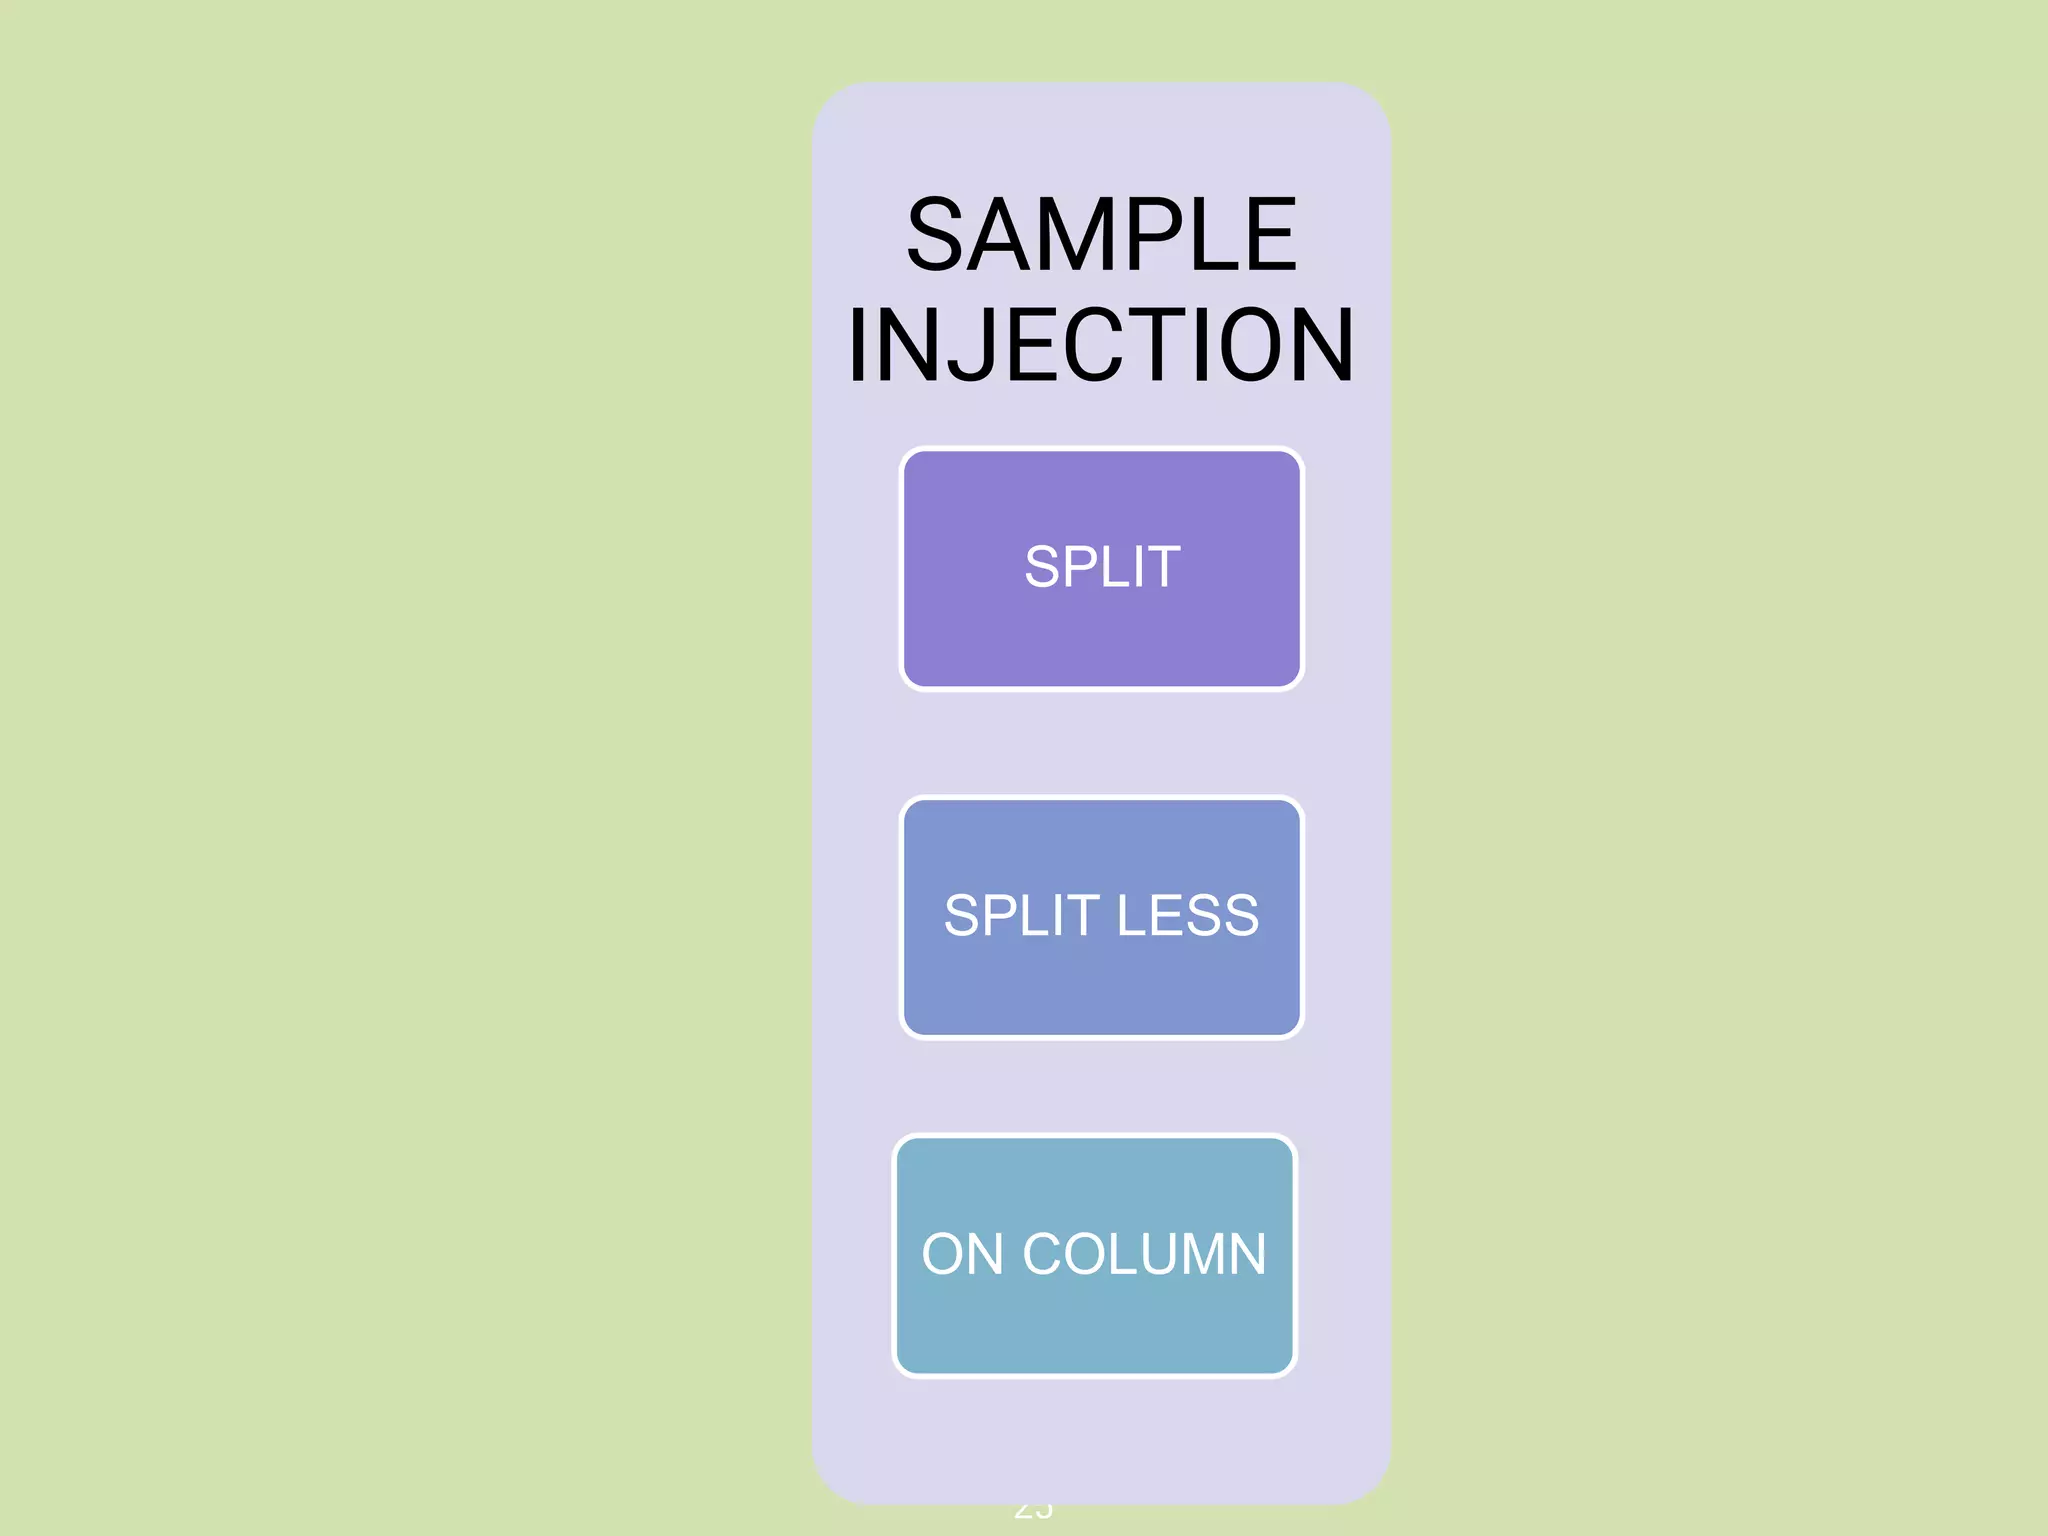
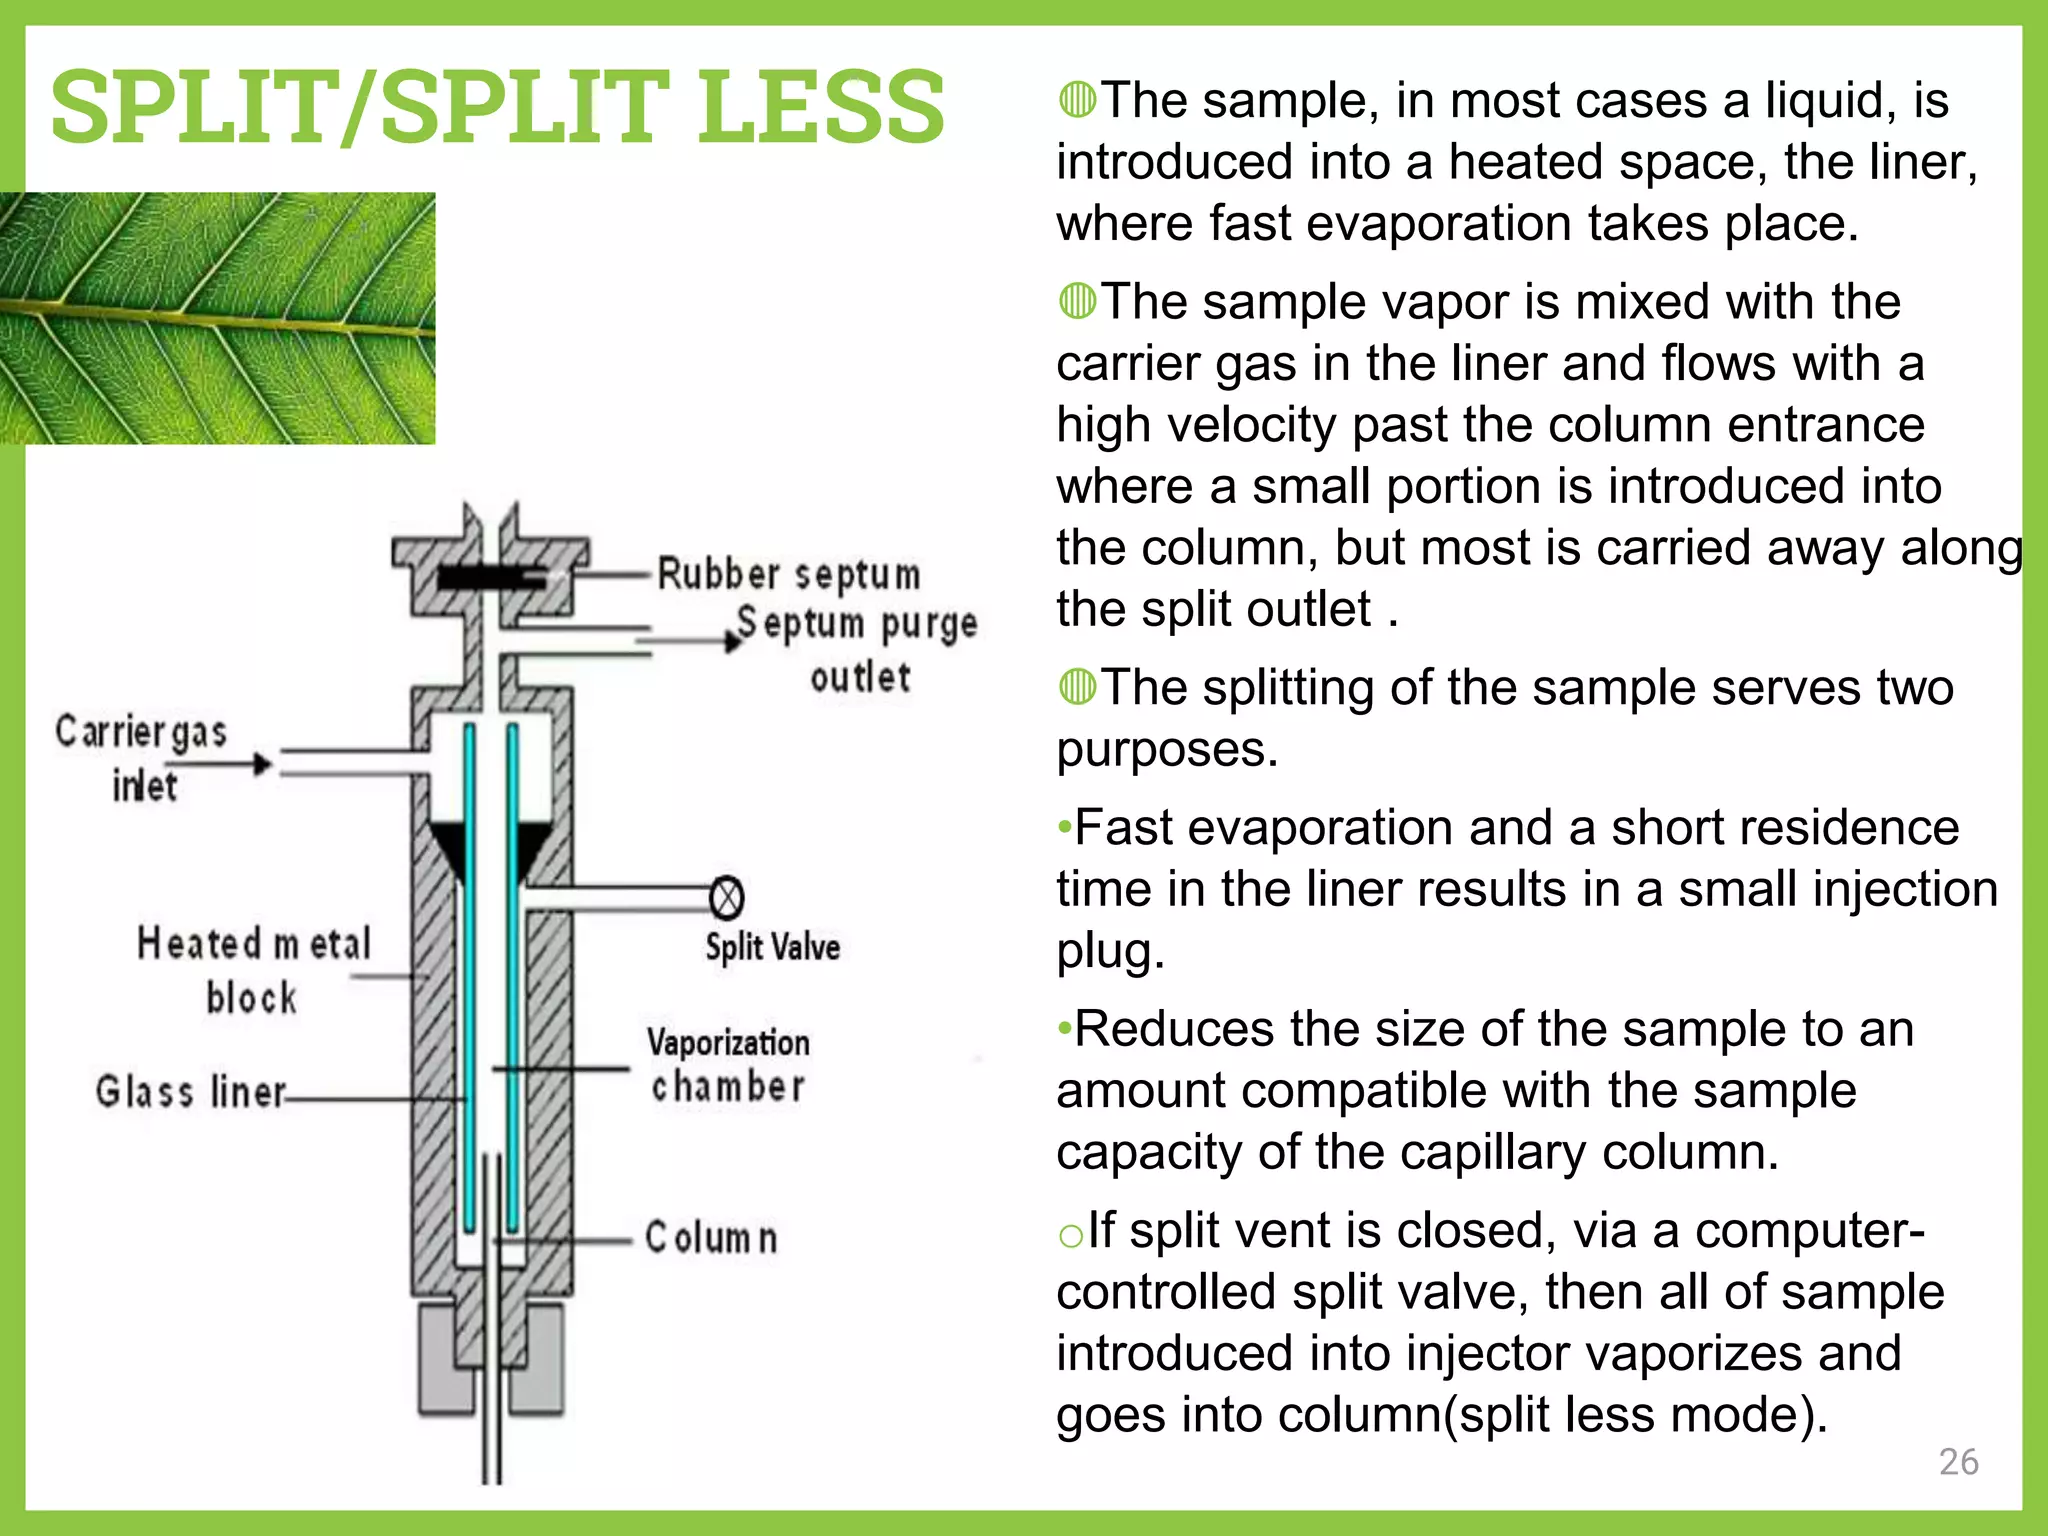
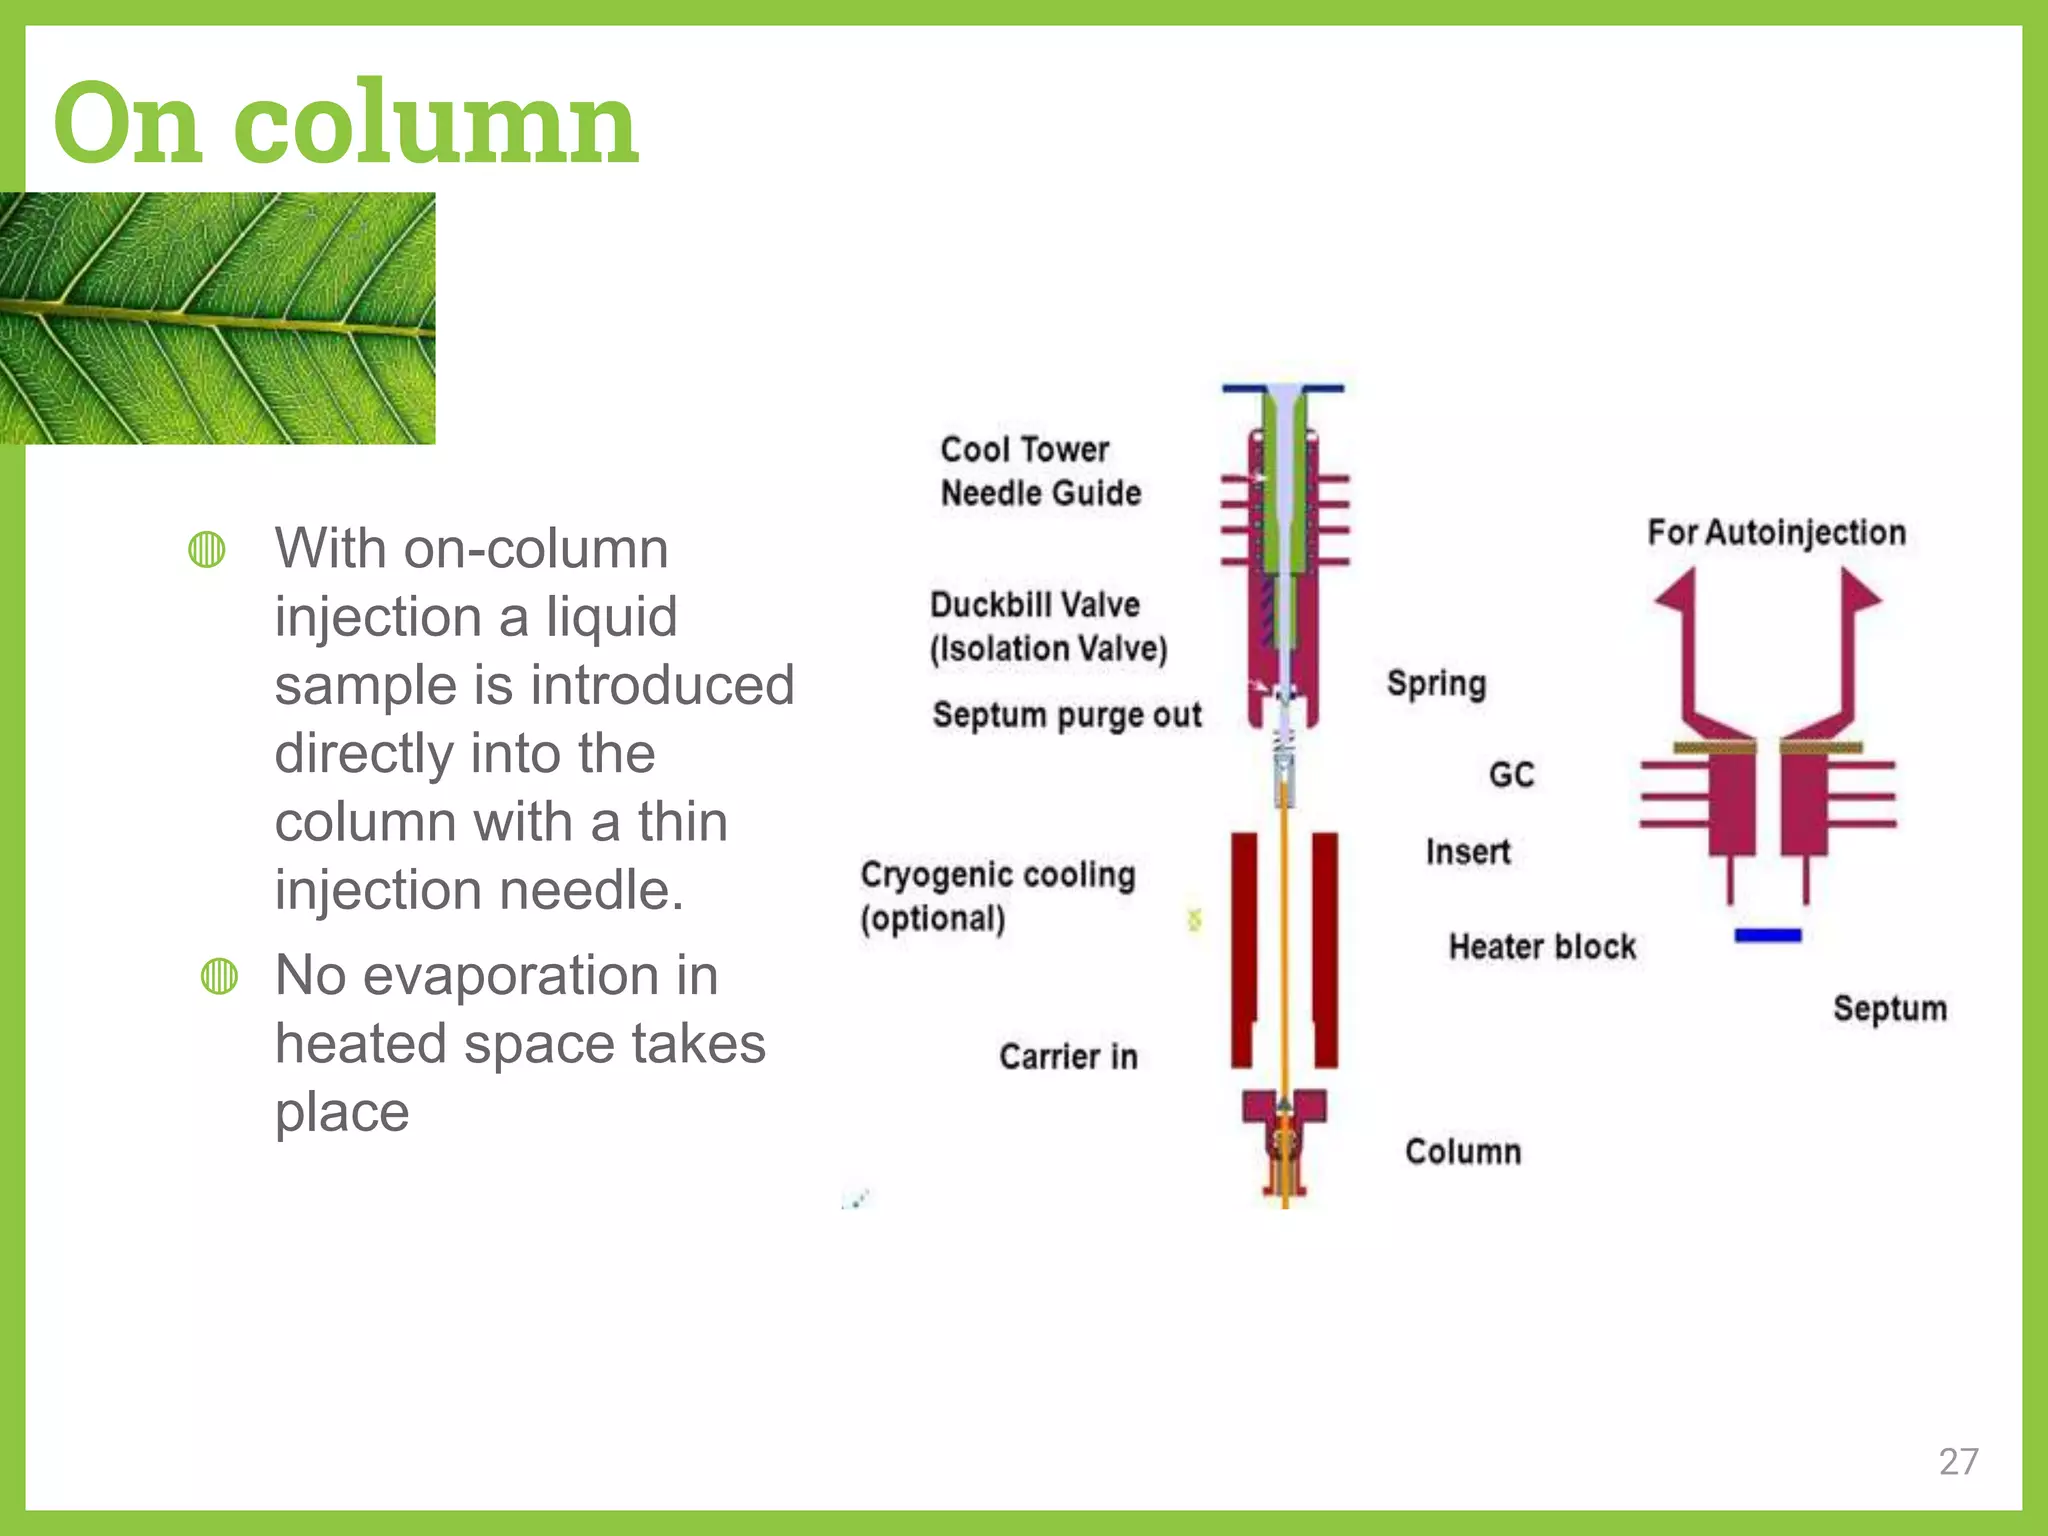
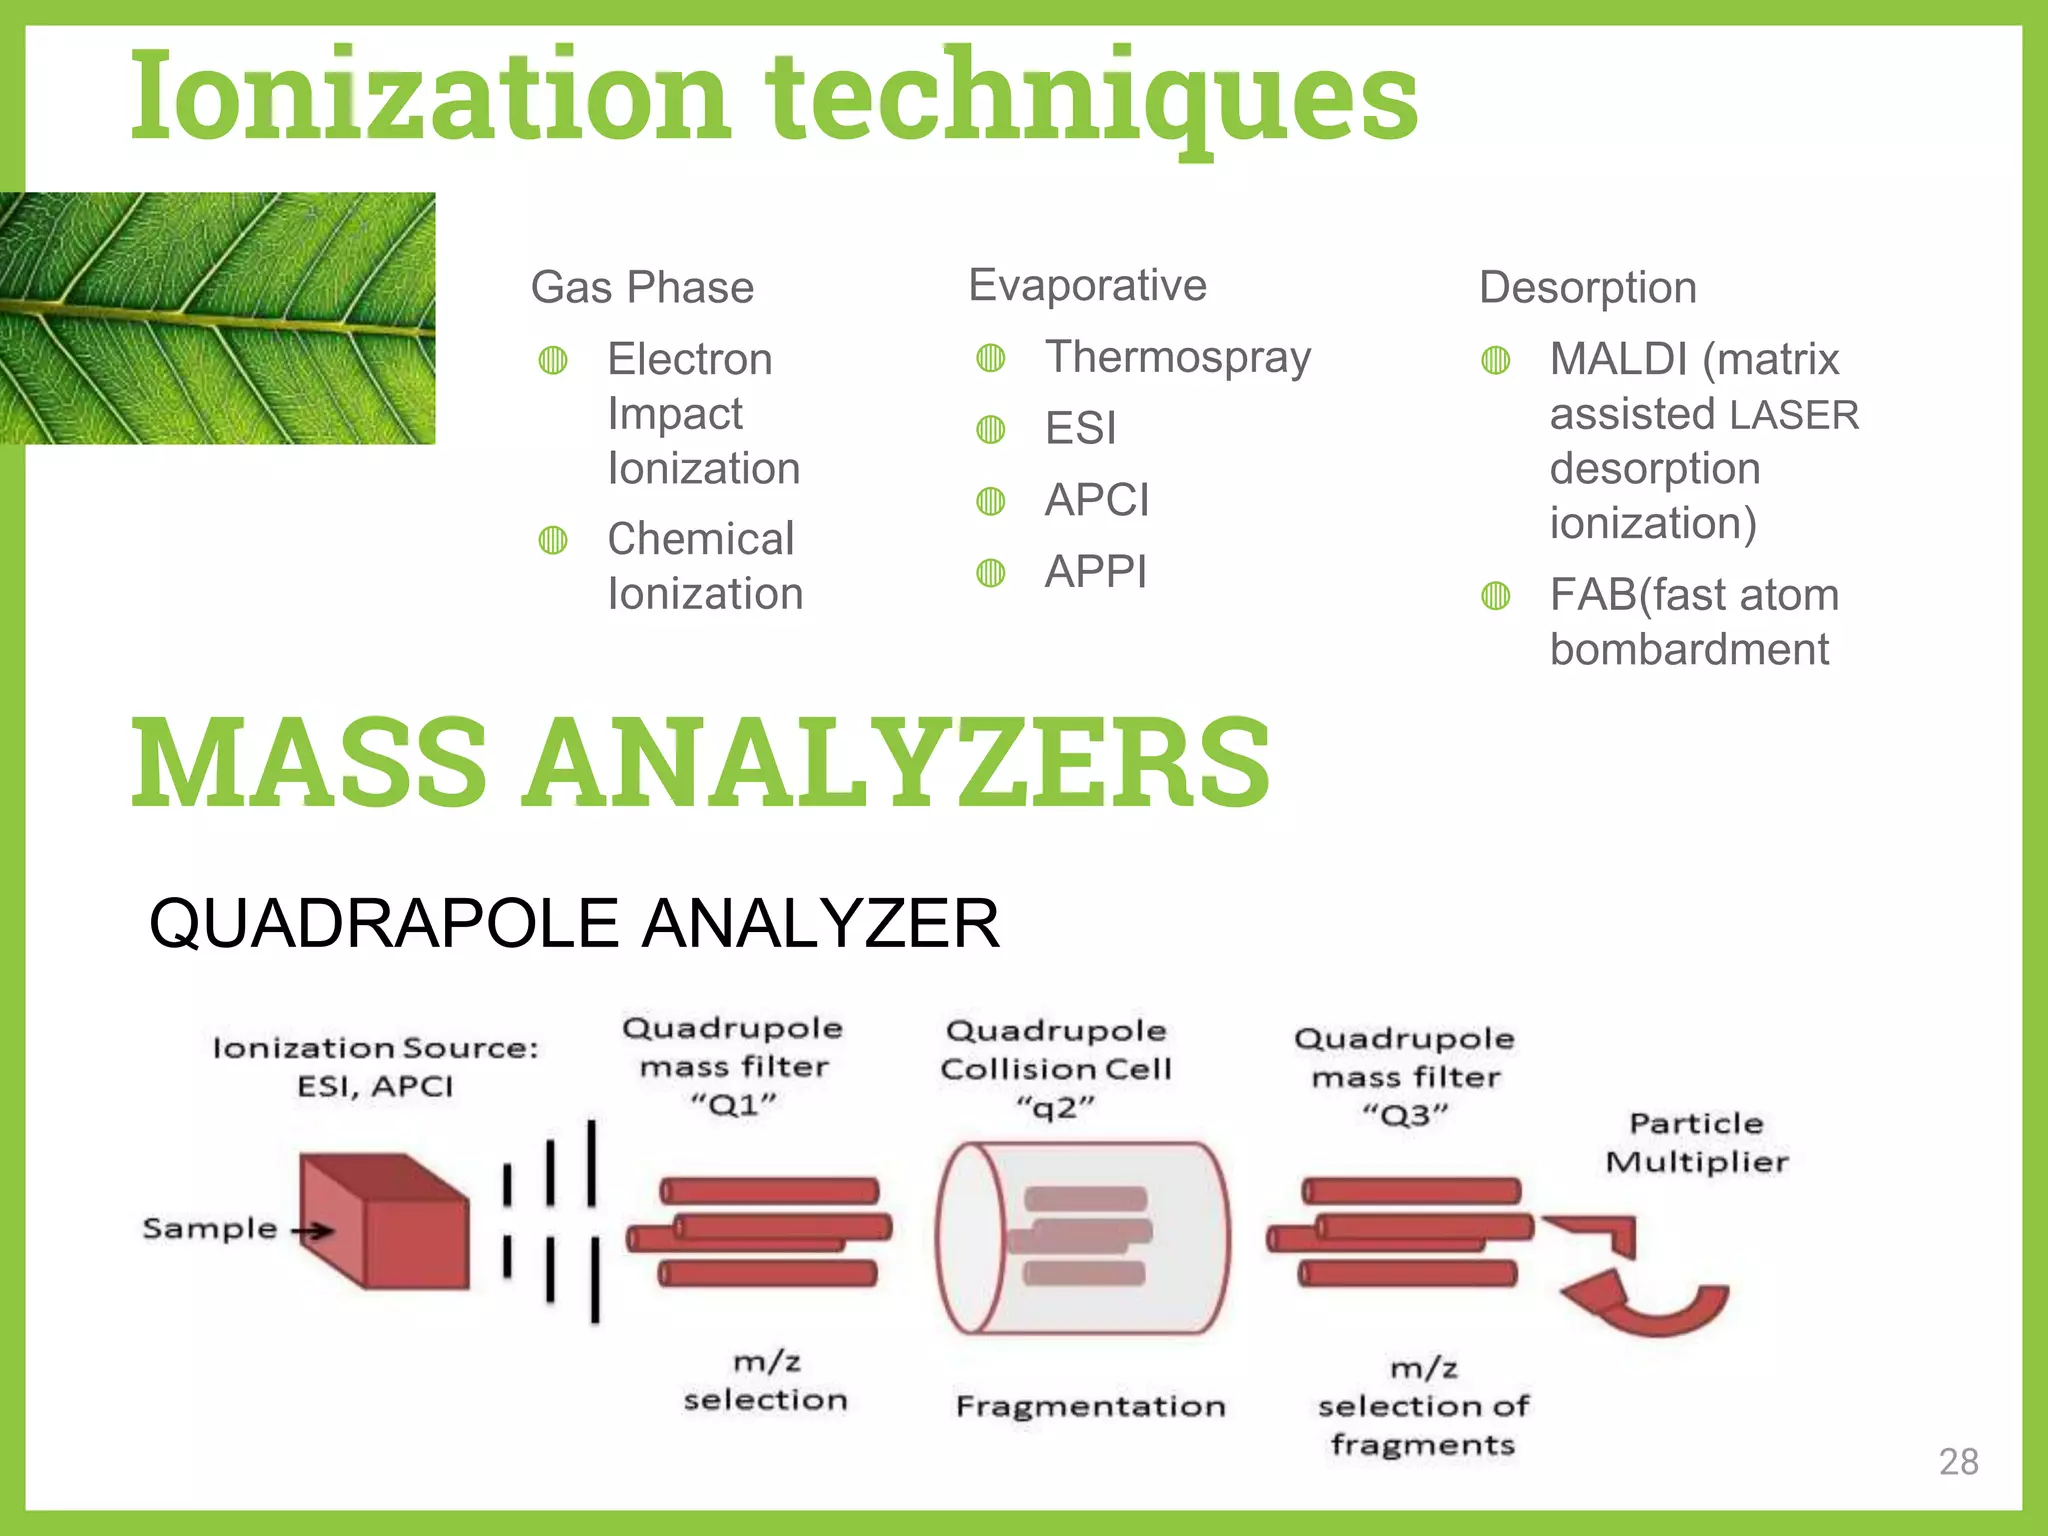
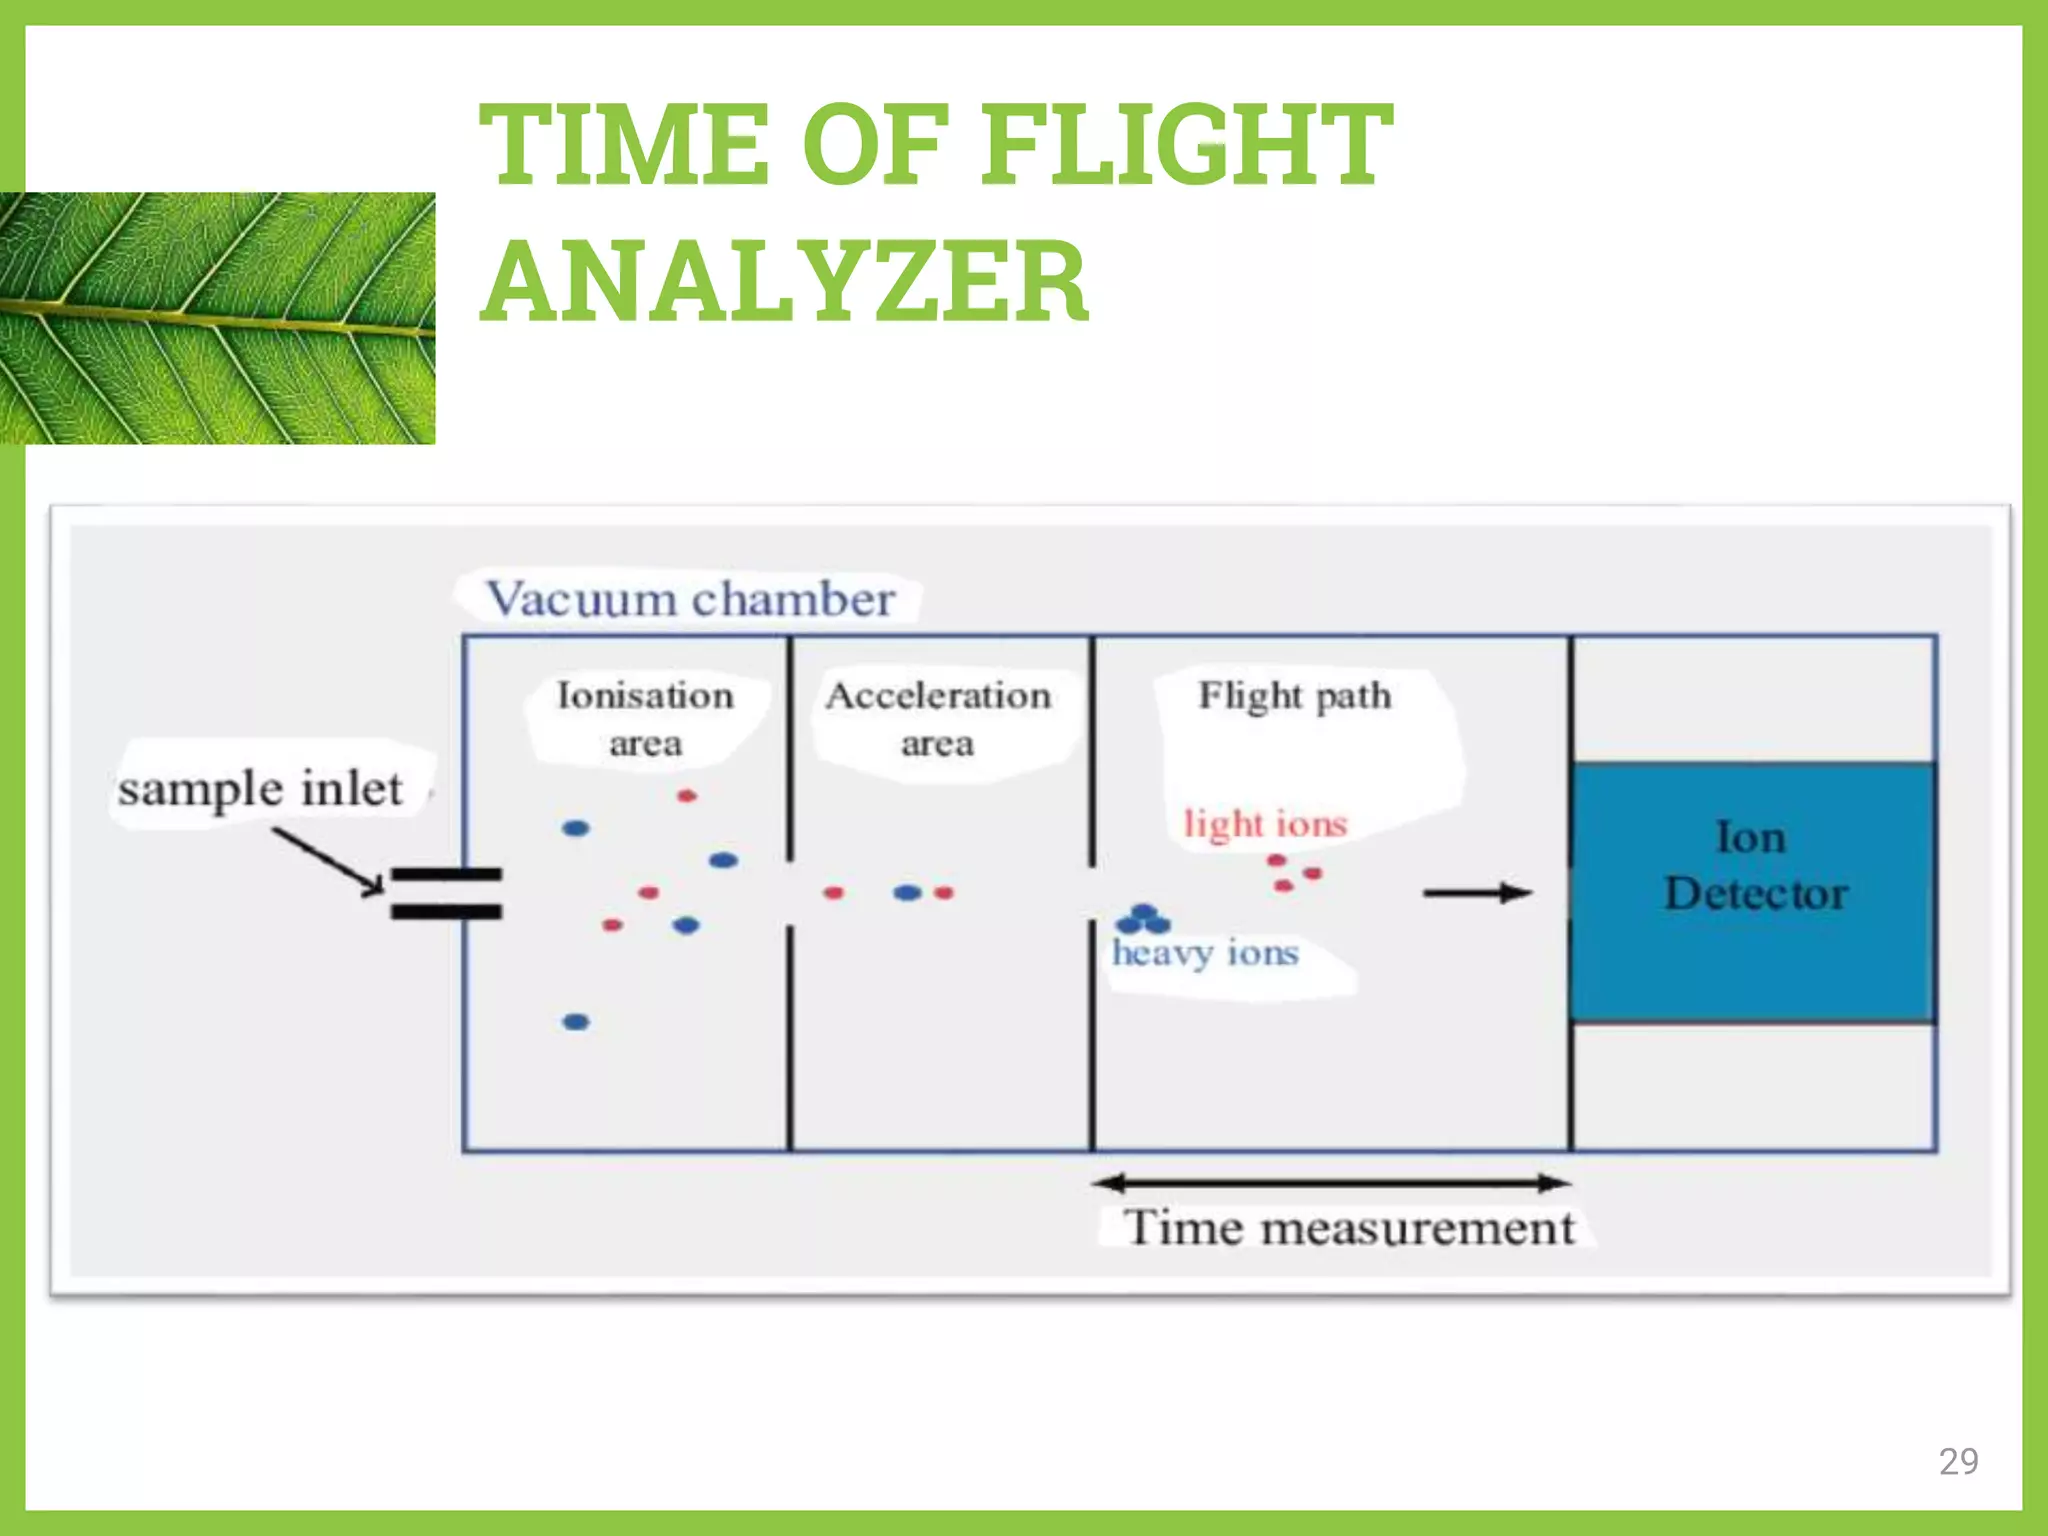
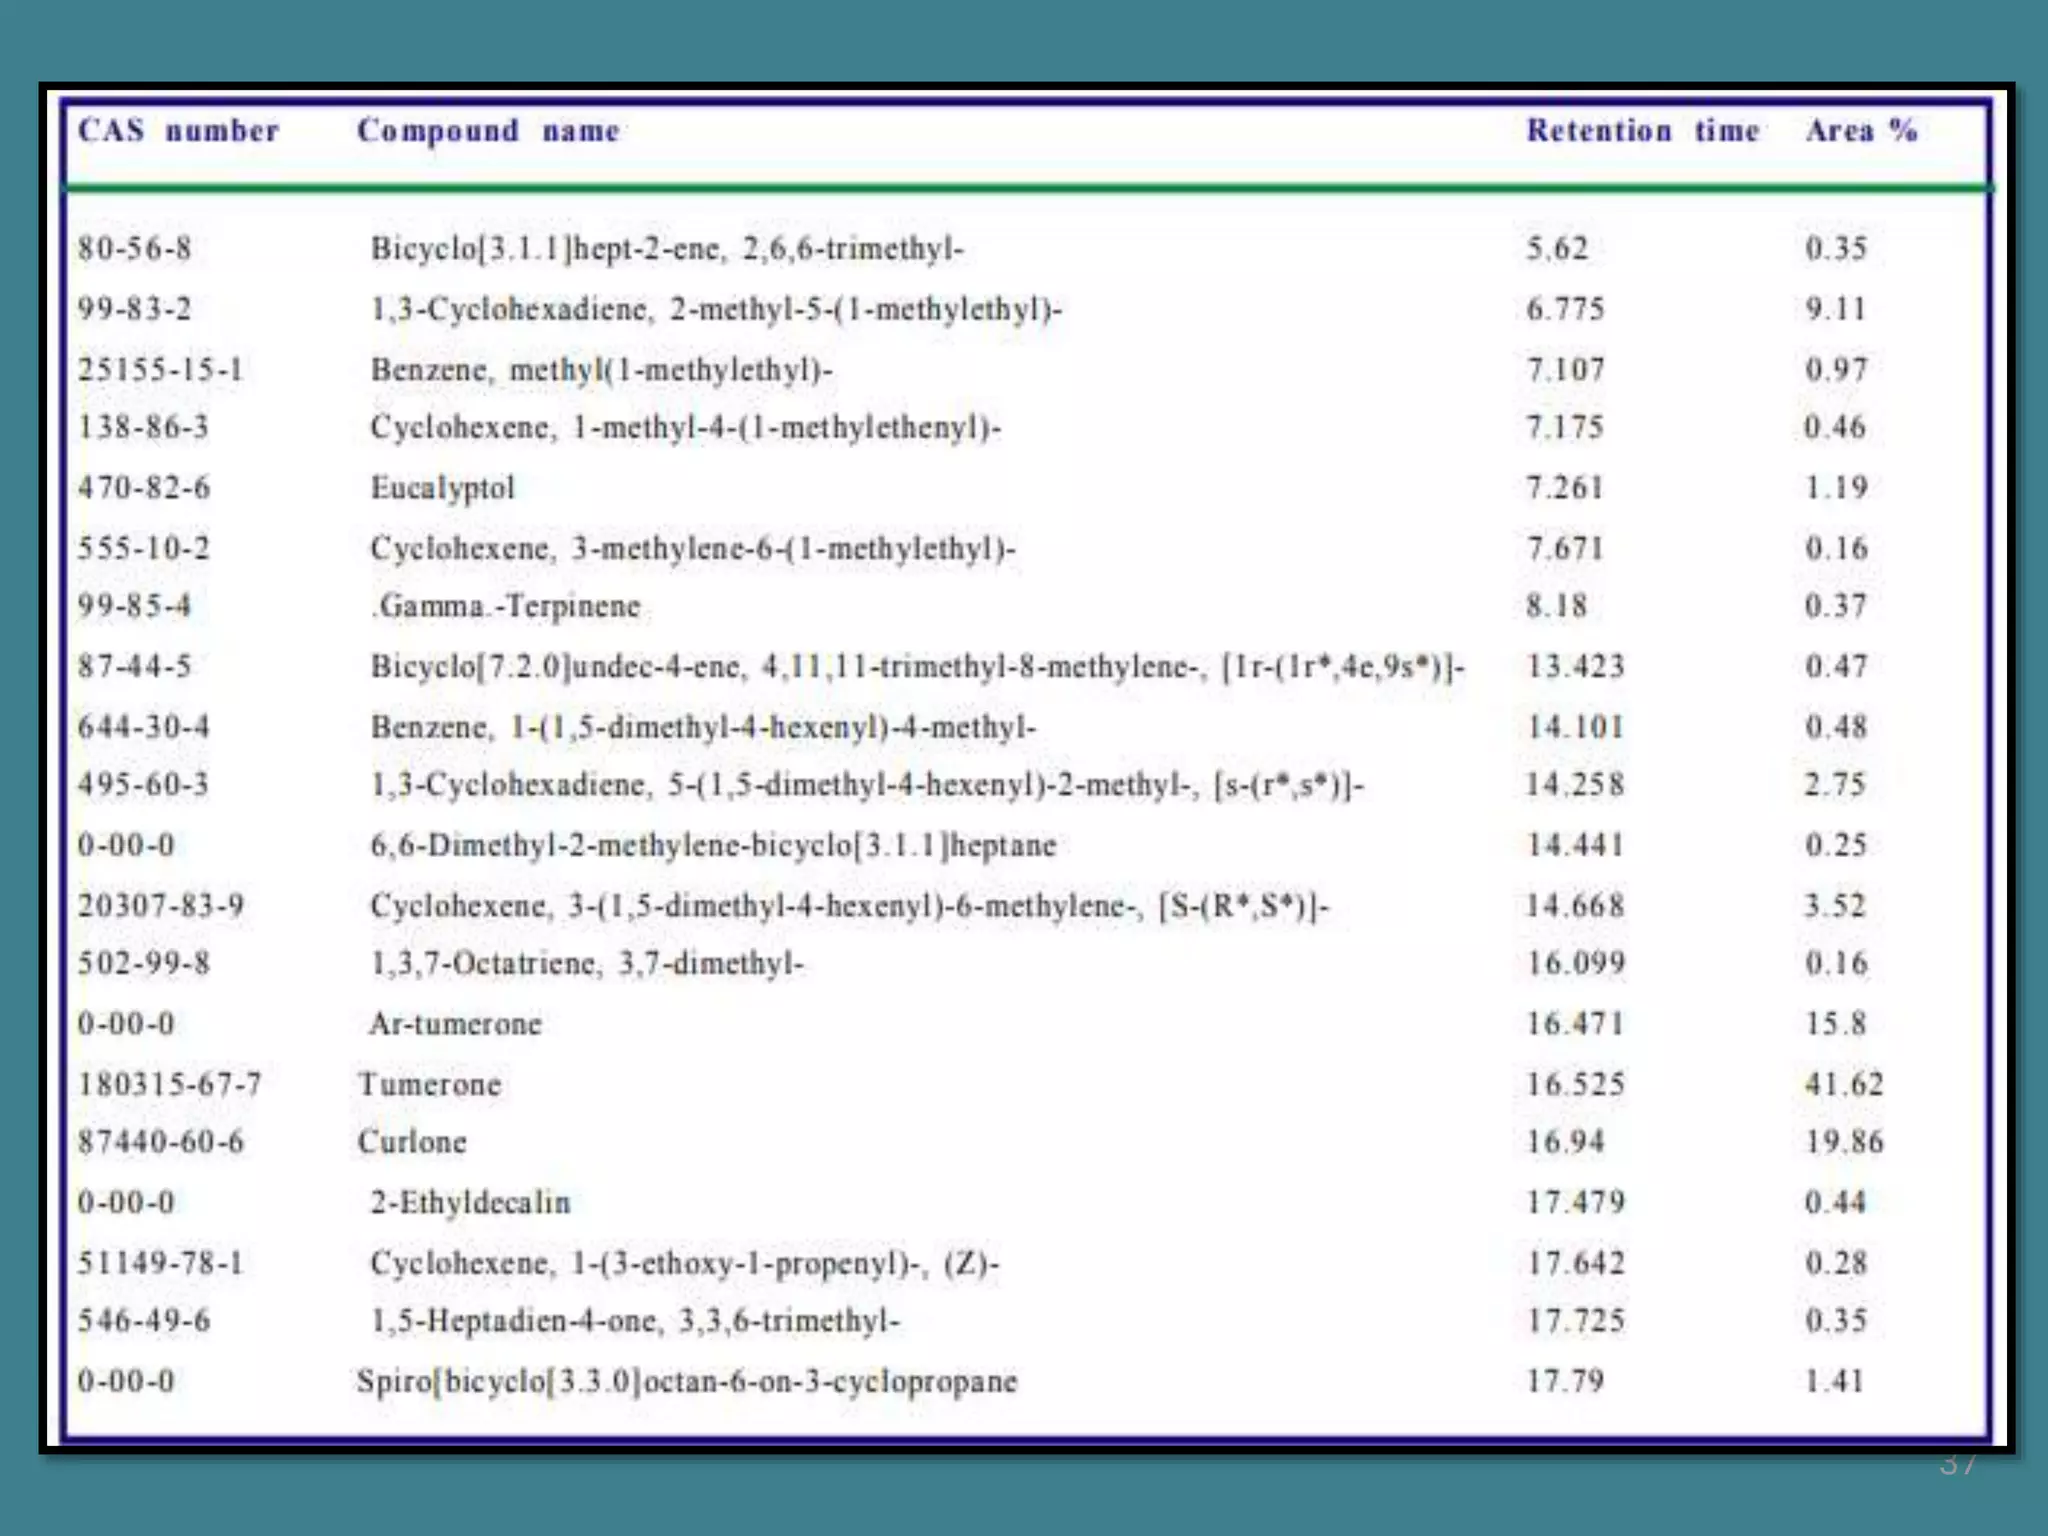


The document discusses phytochemical fingerprinting using techniques like high performance thin layer chromatography (HPTLC) and gas chromatography-mass spectrometry (GC-MS). It provides details on the principles, methodology, and applications of HPTLC for obtaining chromatographic fingerprints of plant extracts. These fingerprints can characterize samples based on the retention factor values and profiles of constituents. The document also describes the basic components and working of GC-MS, a hyphenated technique useful for identification of compounds in a sample.


