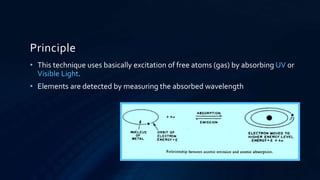
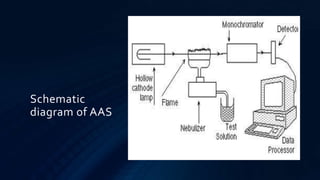
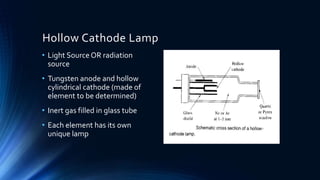
Atomic Absorption
Spectroscopy
MUHAMMAD MAJID (M14-304)
Objectives
• Summary
• Principle
• Instrumentation
• Uses
• Research Article
Introduction
• Atomic absorption spectroscopy (AAS) is an analytical technique
which has been developed primarily for the determination of metals
at low level of concentration.
• It is used for analysing over 62 elements.
History
First atomic absorption
spectrometer was built at
CSIRO by AlanWalsh
(1916-1998) in 1954.
Principle
• This technique uses basically excitation of free atoms (gas) by absorbing UV or
Visible Light.
• Elements are detected by measuring the absorbed wavelength
Instrumentation
Detector
Hollow
Cathode
Lamp
Mono-
chrmator
Atomizer
Nebulizer
Schematic
diagram of AAS
Hollow Cathode Lamp
• Light Source OR radiation
source
• Tungsten anode and hollow
cylindrical cathode (made of
element to be determined)
• Inert gas filled in glass tube
• Each element has its own
unique lamp
Nebulizer
• Give liquid samples at
controlled rate to burner.
• Fine aerosol spray created for
introducing into flame
atomizer.
• Aerosol and fuel is mixed and
oxidant thoroughly for
introducing into flame
atomizer.
Atomizer
A T O M I Z A T I O N is the converting of particles into
molecules and breaking of molecules into atoms. It is done
by heating the sample to high temperature in graphite tube
furnace or flame.
 Elements should be in atomic state for analyzing .
Atomizers
Flame Atomizers
GraphiteTube
Atomizers
Flame Atomizer
• An oxidant and fuel gas is mixed to create flame.
• Normally, nitrous oxide (oxidant) – acetylene (fuel) or air – acetylene
flames are used.
• Dissolved or liquid samples are normally used with flame atomizer.
Schematic
diagram of
Flame Atomizer
Graphite Tube Atomizer (GTAAS)
• Graphite coated furnace is used to vaporize the specimen.
• High current power supply is used for the heating of Graphite tube.
• Analyte deposited on tube for the atomization process.
Schematic
diagram of
Cathode Tube
Atomizer
Monochromator
• It is most important part ofAAS, used for the selection of particular
wavelength of light which is absorbed by the specimen, and to ignore
the other wavelengths.
• Choice of the particular wavelength helps the detection of particular
element in the presence of others.
Detectors
• Photomultiplier tube, convert light signals to electrical signals
proportional to light intensity, is used to detect the absorbed
wavelength.
• Electrical signal amplified and displayed for read out.
Applications
Quantitative analysis
Lead in petroleum
Metal detection in drugs
Traces of metals in body fluids
Determination of metal in foods
Advantages
Widespread Applications
High Sensitivity
Freedom from Interference
Independent of flame
temperature
Disadvantages
Don’t determine nonmetals
Gas or Solid samples can’t
analyzed directly
One element at a time
Anionic Interference
Solid sampling determination of
magnesium in lithium niobate
(LiNbO3) crystals by GFAAS
GABRIELLA DRAVECZ, (2016), SPECTROCHIMICA ACTA PART B
Results:
Absorbance
spectrum
Primary absorption
spectrum of Mg (I) shown
in fig. which indicate the
absorption of 215.4353 nm
wavelength and presence
of Mg in sample.
Mg content in
samples:
19 different samples were
taken and observed, found
that Mg is present in the
range of (1.69 – 4.13mg/g)
in the sample.
Calibration
Curve
The shown graph shows
that increase in content of
Mg in sample will increase
the absorption of
wavelength, so increase
the intensity of line.
Conclusion
Atomic
absorption
spectroscopy is
the technique
used to determine
metal traces with
accuracy.
For

Atomic Absorption Spectroscopy