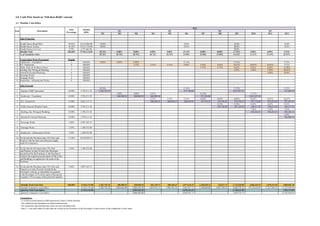
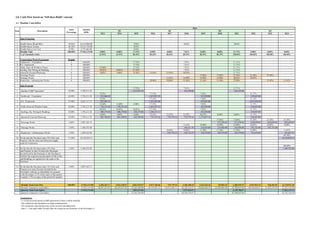
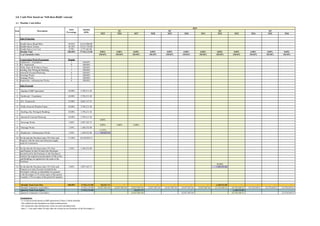
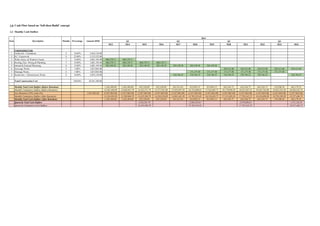
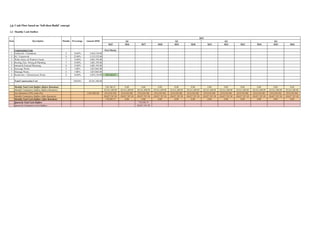
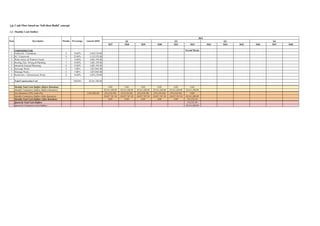
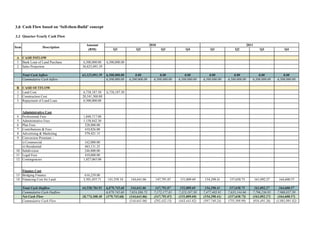
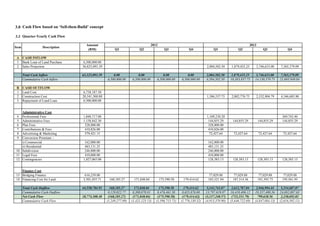
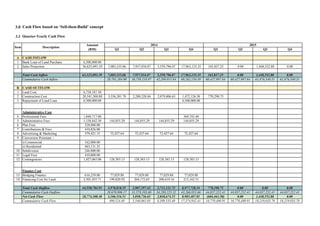
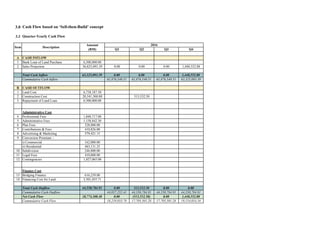
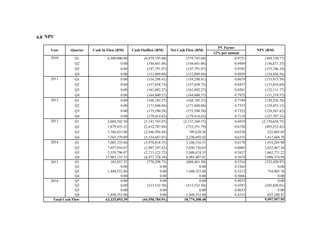
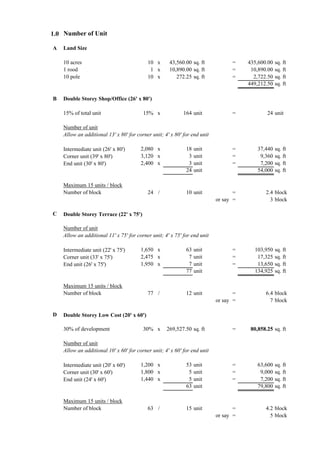
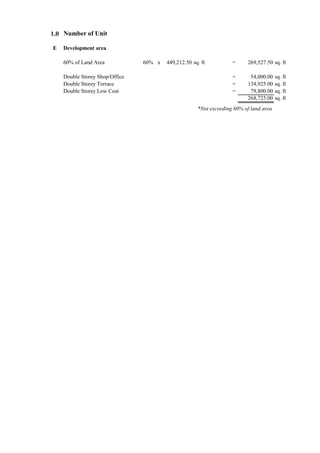
This document outlines a group assignment for a development economics course. It includes details of the proposed development such as land size, number and type of units, and a financial appraisal. The development will include shop/office, terrace, and low-cost housing units totaling 164 units. The financial appraisal estimates construction costs, administrative costs, financing costs, and gross profit. Cash flow projections are provided for a "sell-then-build" approach, with monthly sales and construction progress outlined over a 12 month period.
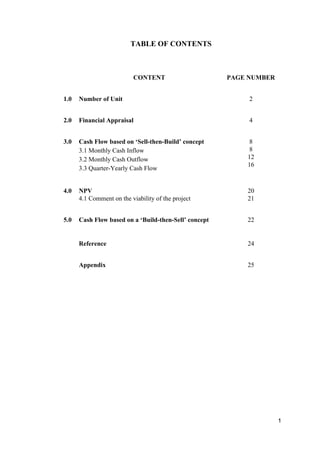
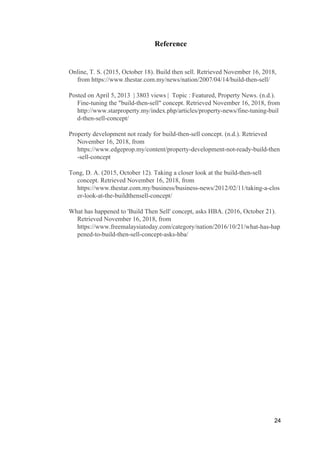
![2.0 Financial Appraisal
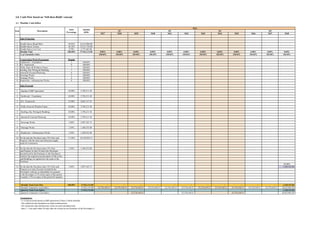
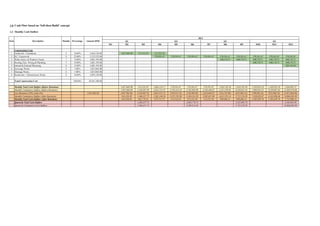
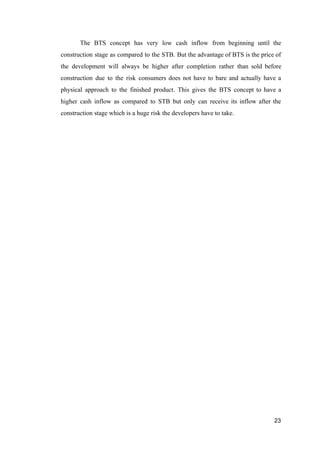
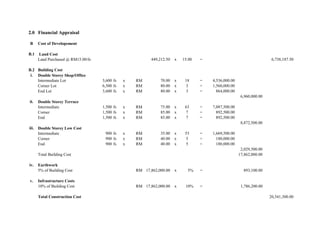
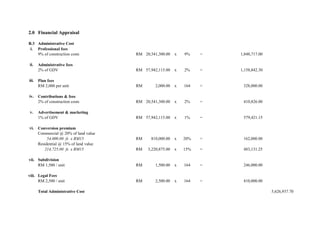
B.4 Finance Cost
i. Cost of Finance (Assume Full)
5.5% p.a + 6.5% p.a 2 x RM 10,270,650.00 x 12% = 616,239.00
ii. Interest on Loan for Purchase of Land
P[((1+i)^n)-1) RM 6,500,000.00 x [(1+0.09)^5-1] = 3,501,055.71
Total Financing Cost 4,117,294.71
B.5 Contigencies
5% of Construction Cost RM 20,541,300.00 x 5% 1,027,065.00
Gross Development Cost 38,050,784.91
C Gross Profit Excluding Taxation
Gross Development Value (GDV) 57,942,115.00
Development Cost (38,050,784.91)
19,891,330.09
D Rate of Return
% of Gross Profit (Profit/GDV) RM 0.34 x 100% 34%](https://image.slidesharecdn.com/deassignmentg7finaldone-190307182800/85/Assignment-Financial-Appraisal-8-320.jpg)