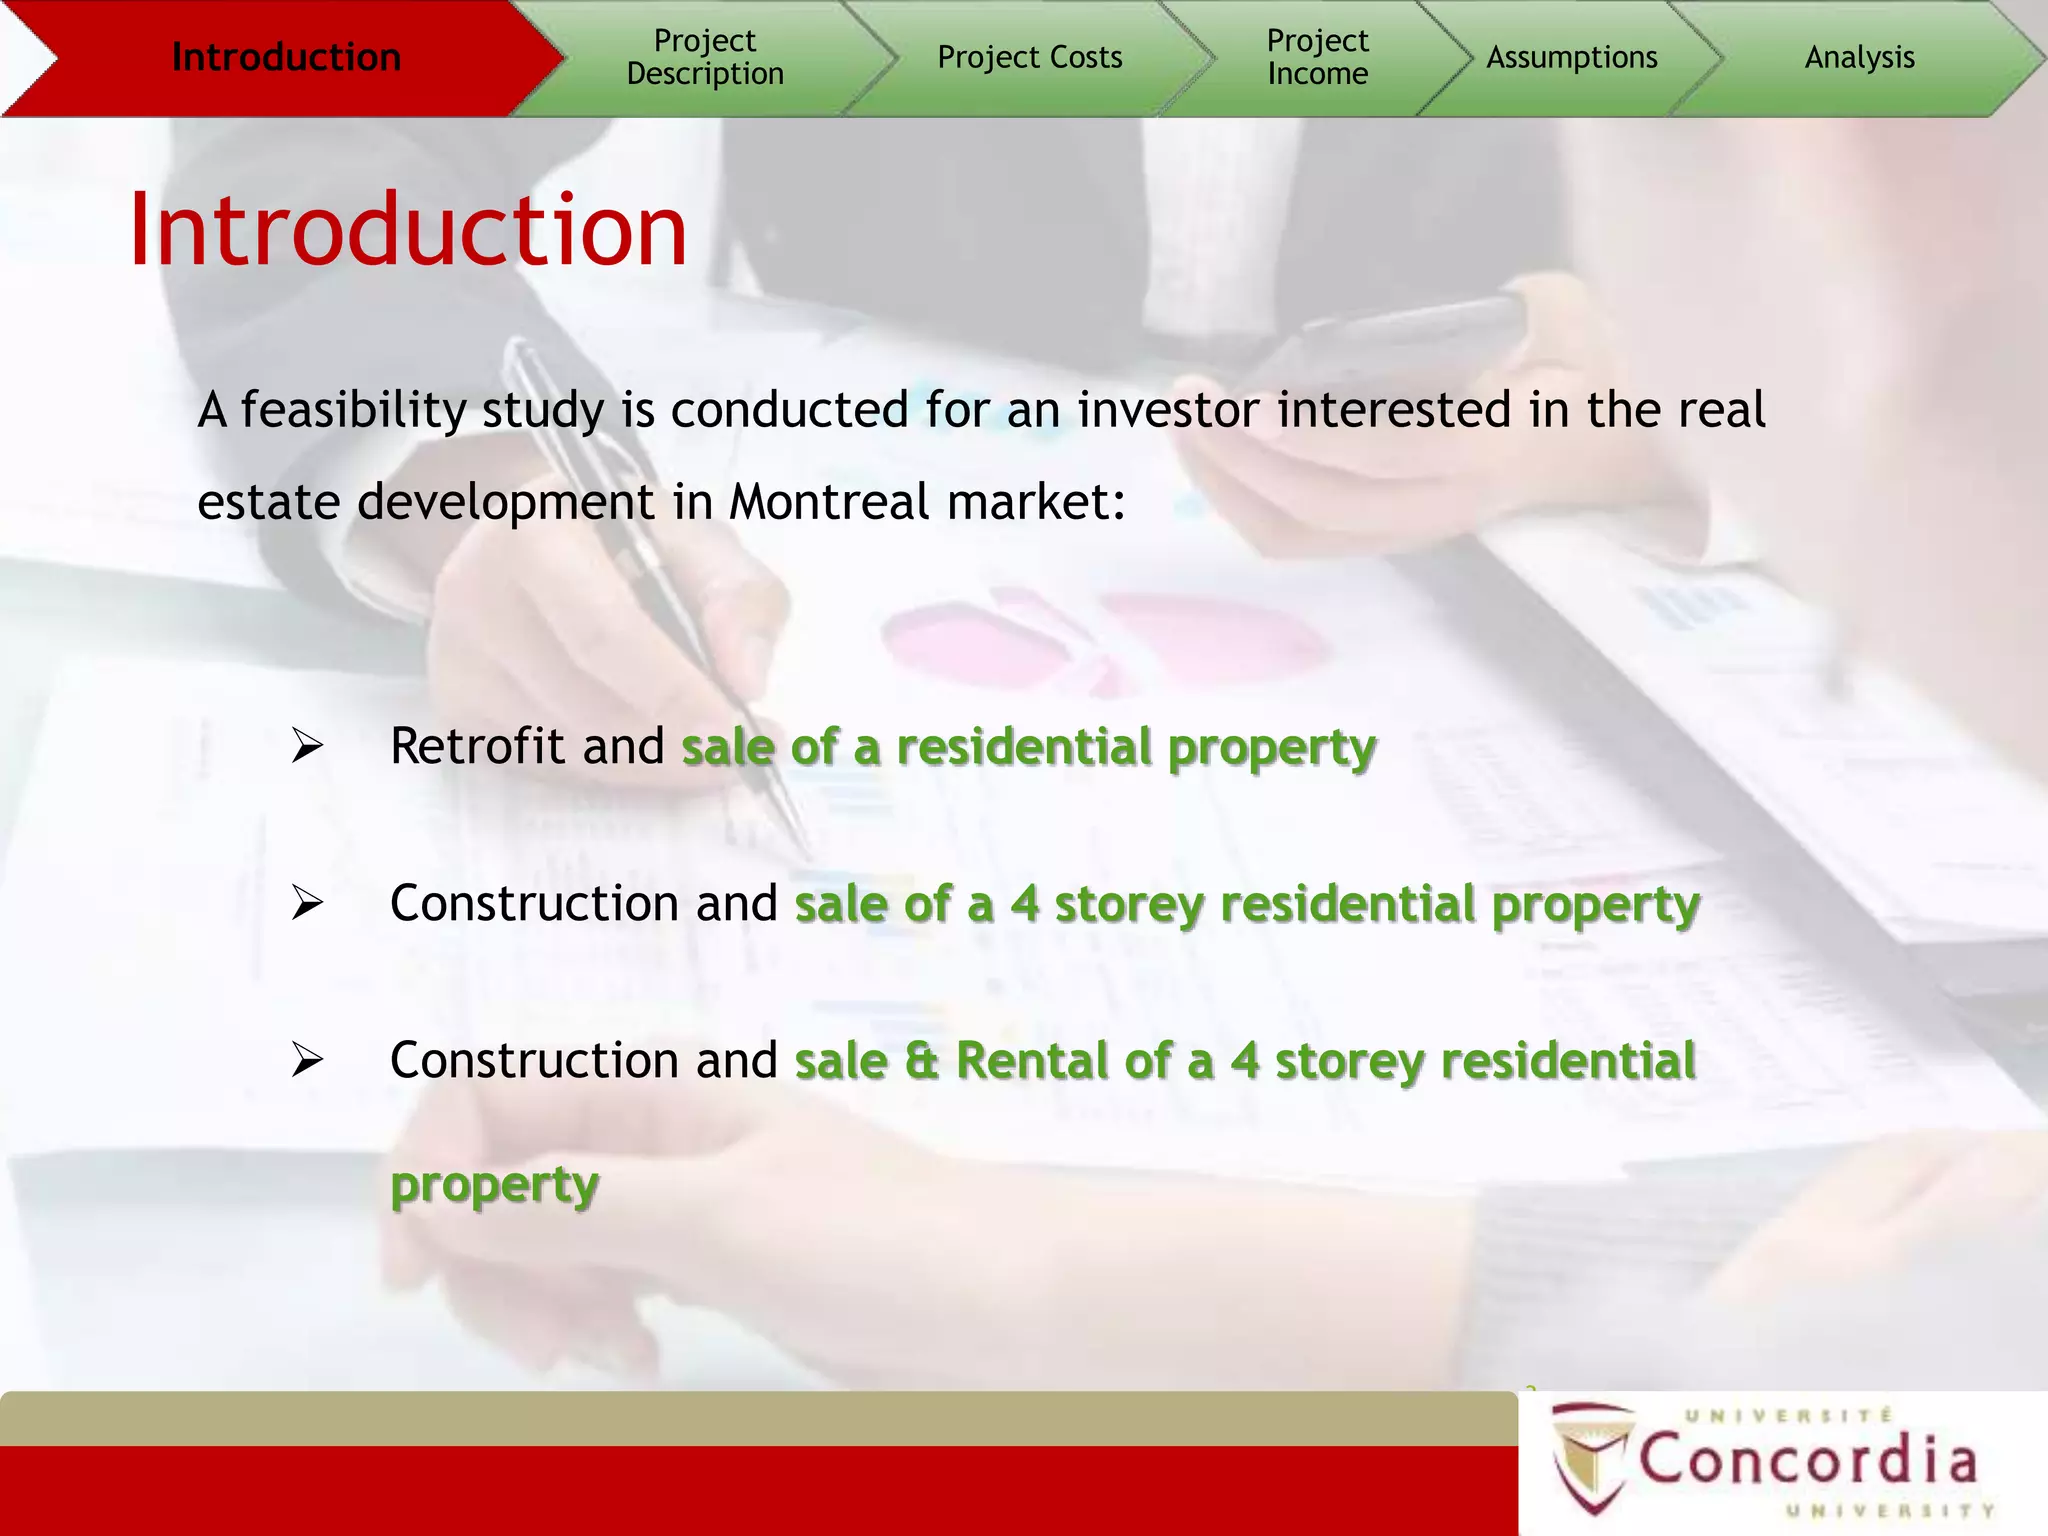
The document presents an economic feasibility study for three residential development alternatives in Montreal: 1) Retrofitting and selling an existing property, 2) Constructing and selling a new 4-storey building, and 3) Constructing and then selling and renting units in a new 4-storey building. It describes the proposed properties, provides cost and income projections for each alternative, lists key assumptions, and presents analyses of cash flows, returns, and risks for evaluating and comparing the alternatives.
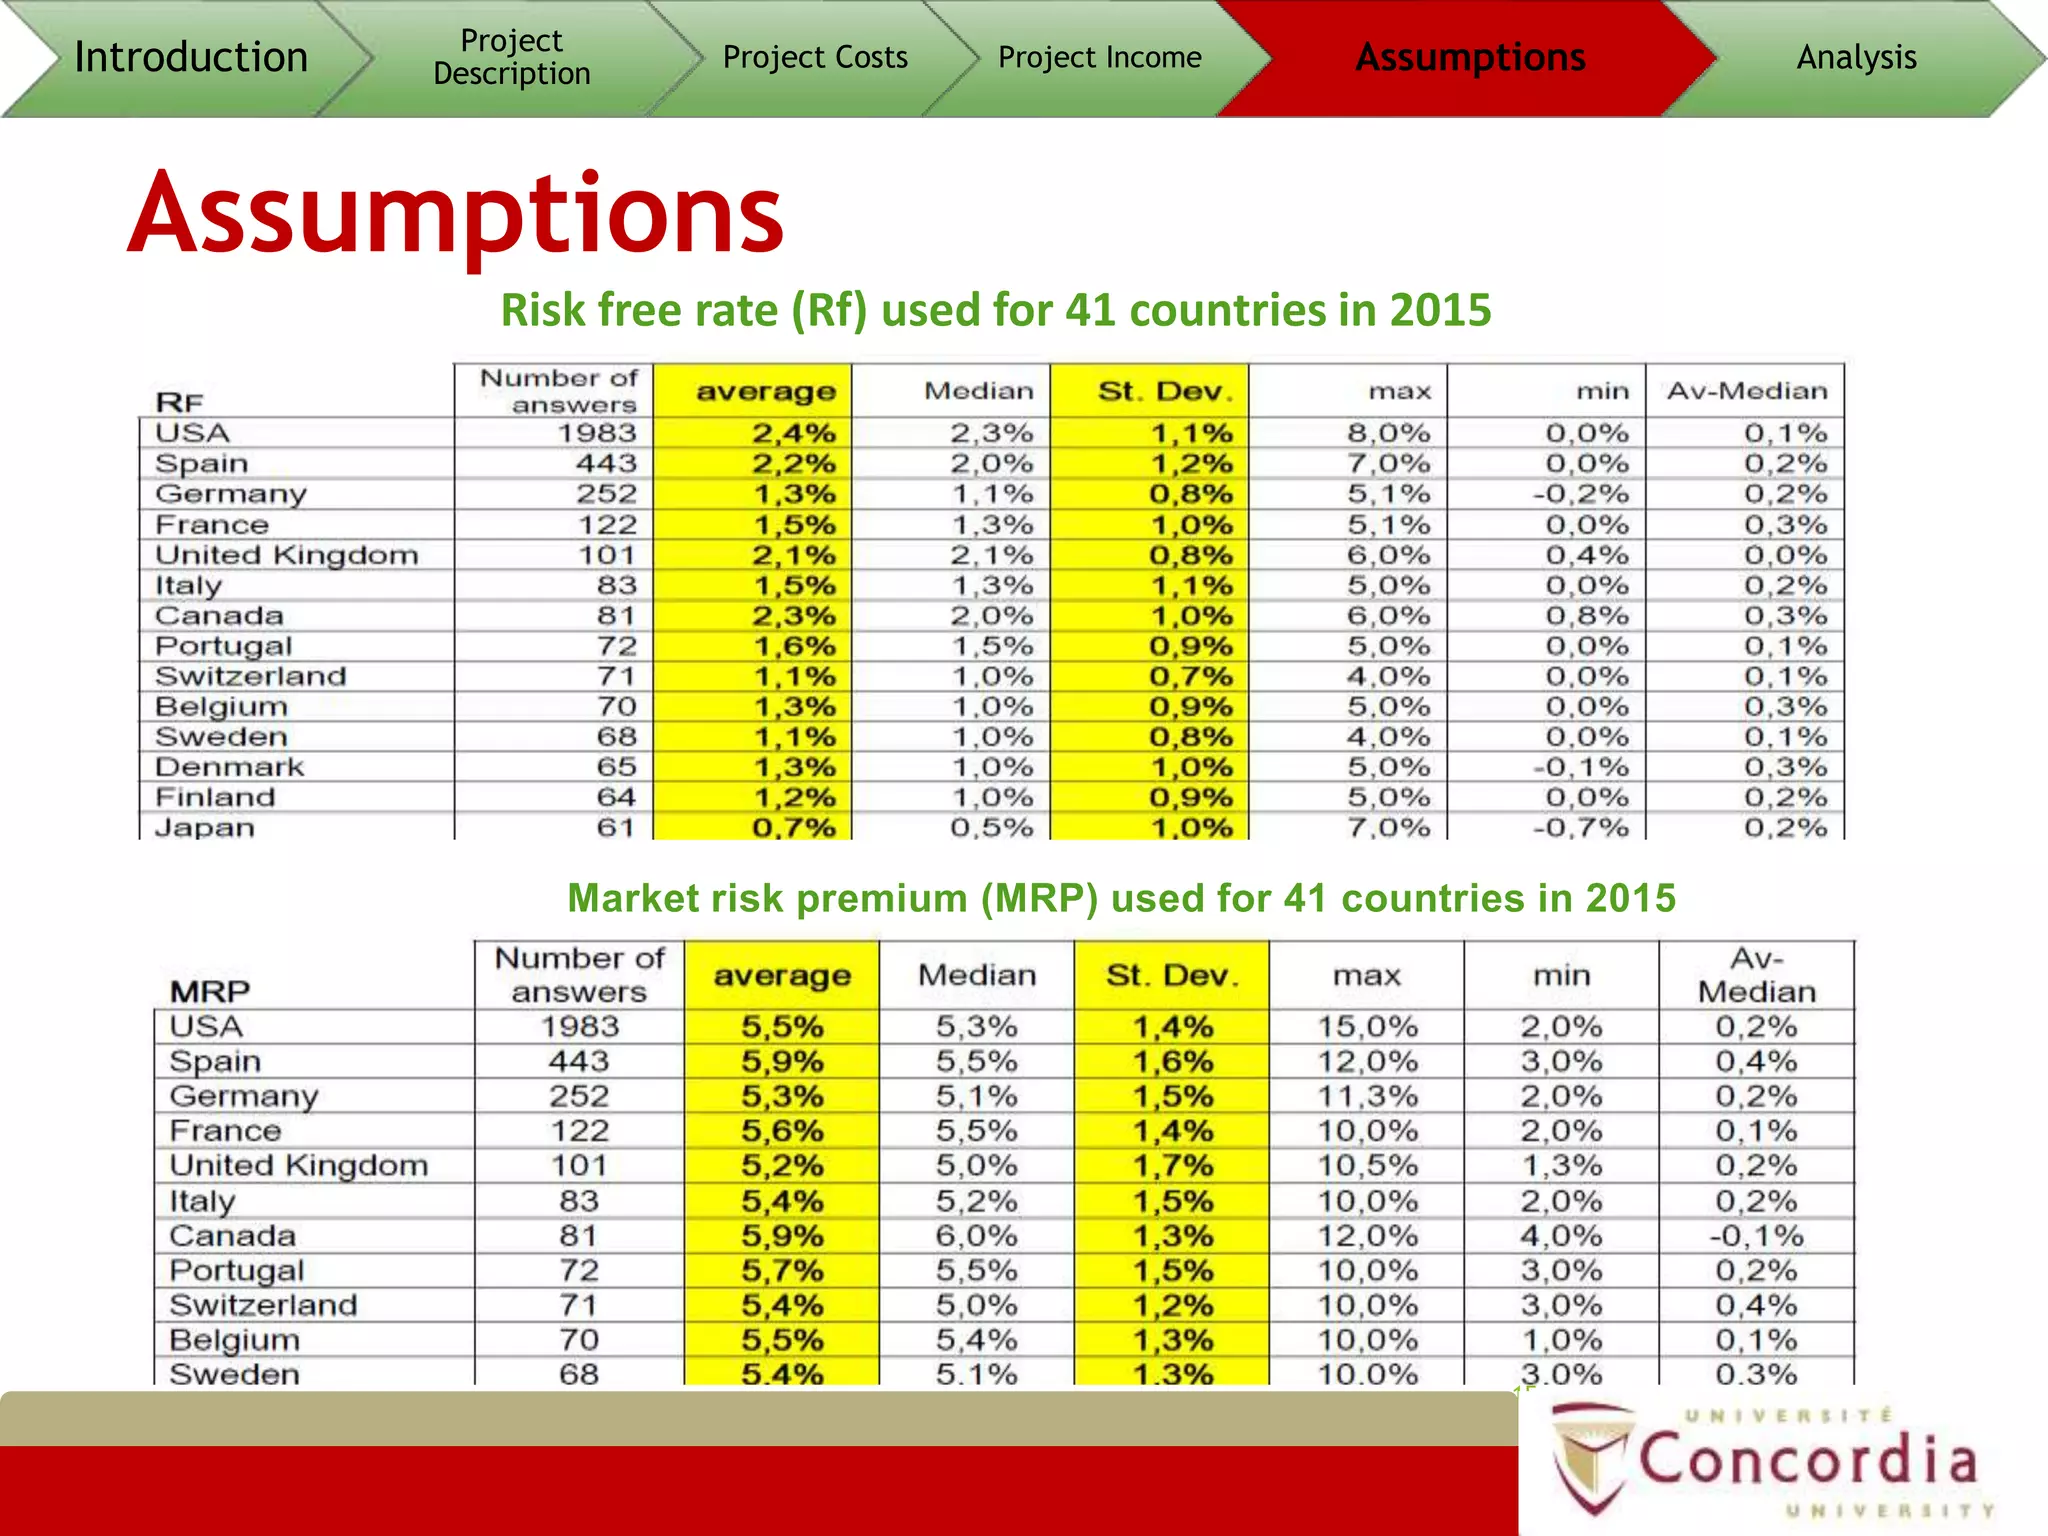
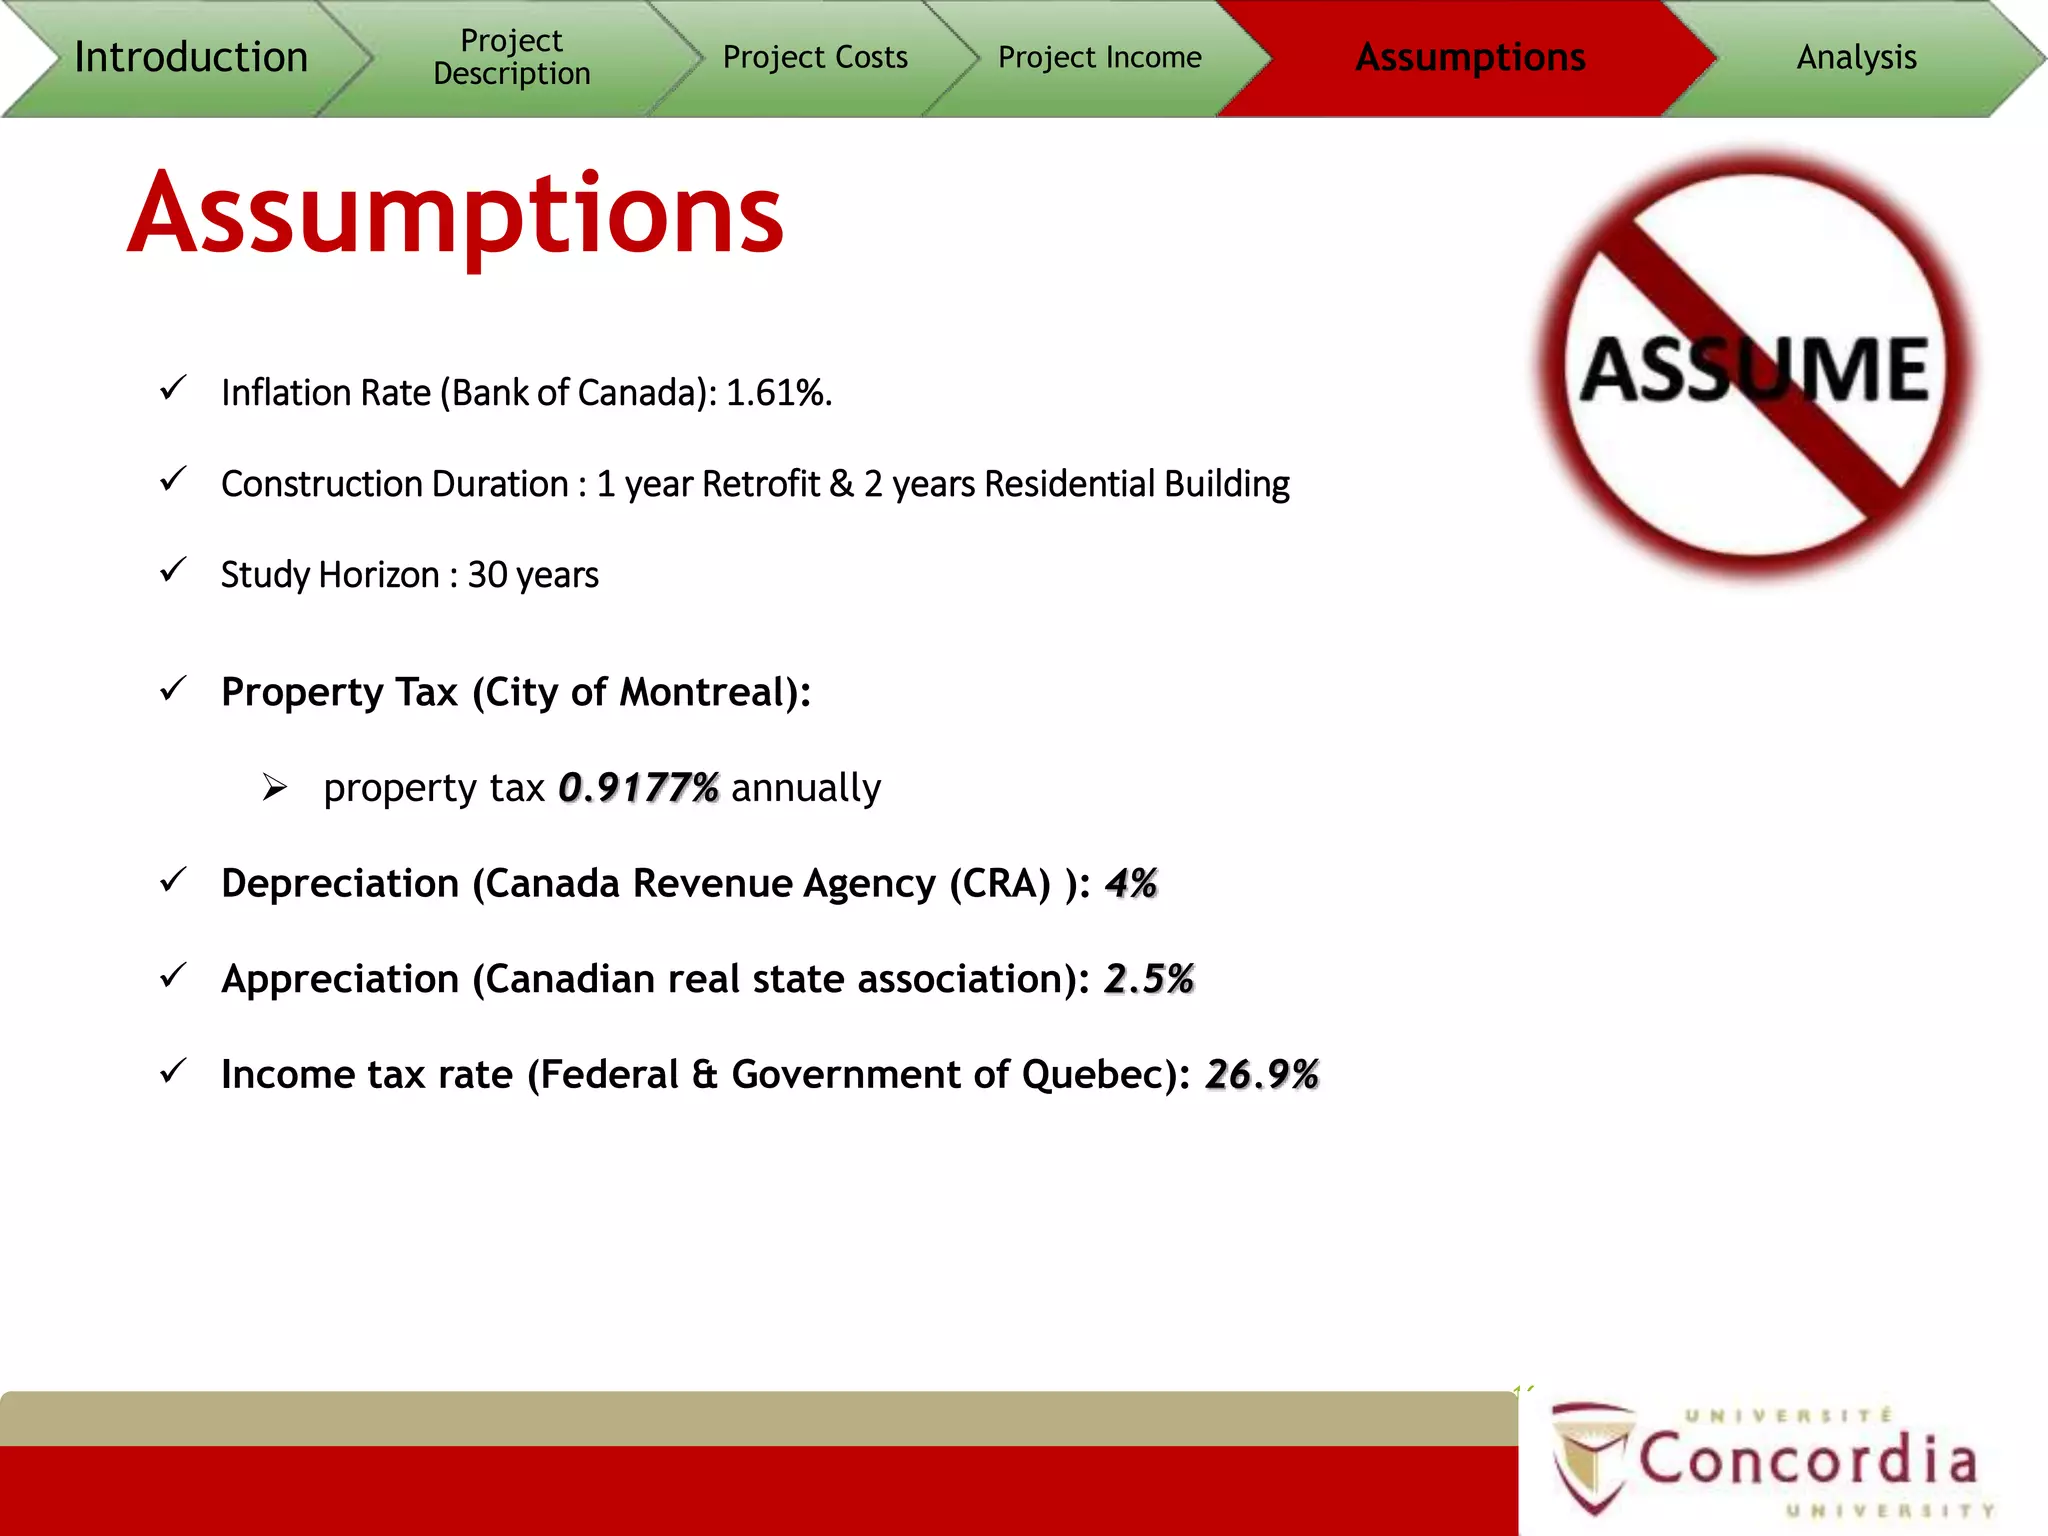
![Assumptions
14
MARR:
WACC = Debt Cost + Equity Cost
Debt Cost = %Debt * %Debt Interest Rate * [1-Tax Rate]
Equity Cost = %Equity * Factors,
Factors = Risk Free Rate + Beta*[Risk Market Rate – Risk Free Rate]
MARR = WACC + Profit Percentage
Introduction Project
Description
Project Costs Project Income Assumptions Analysis](https://image.slidesharecdn.com/6bc077ad-14b6-4d2b-9864-0e66fbc930fa-160419001347/75/building-group-5-14-2048.jpg)