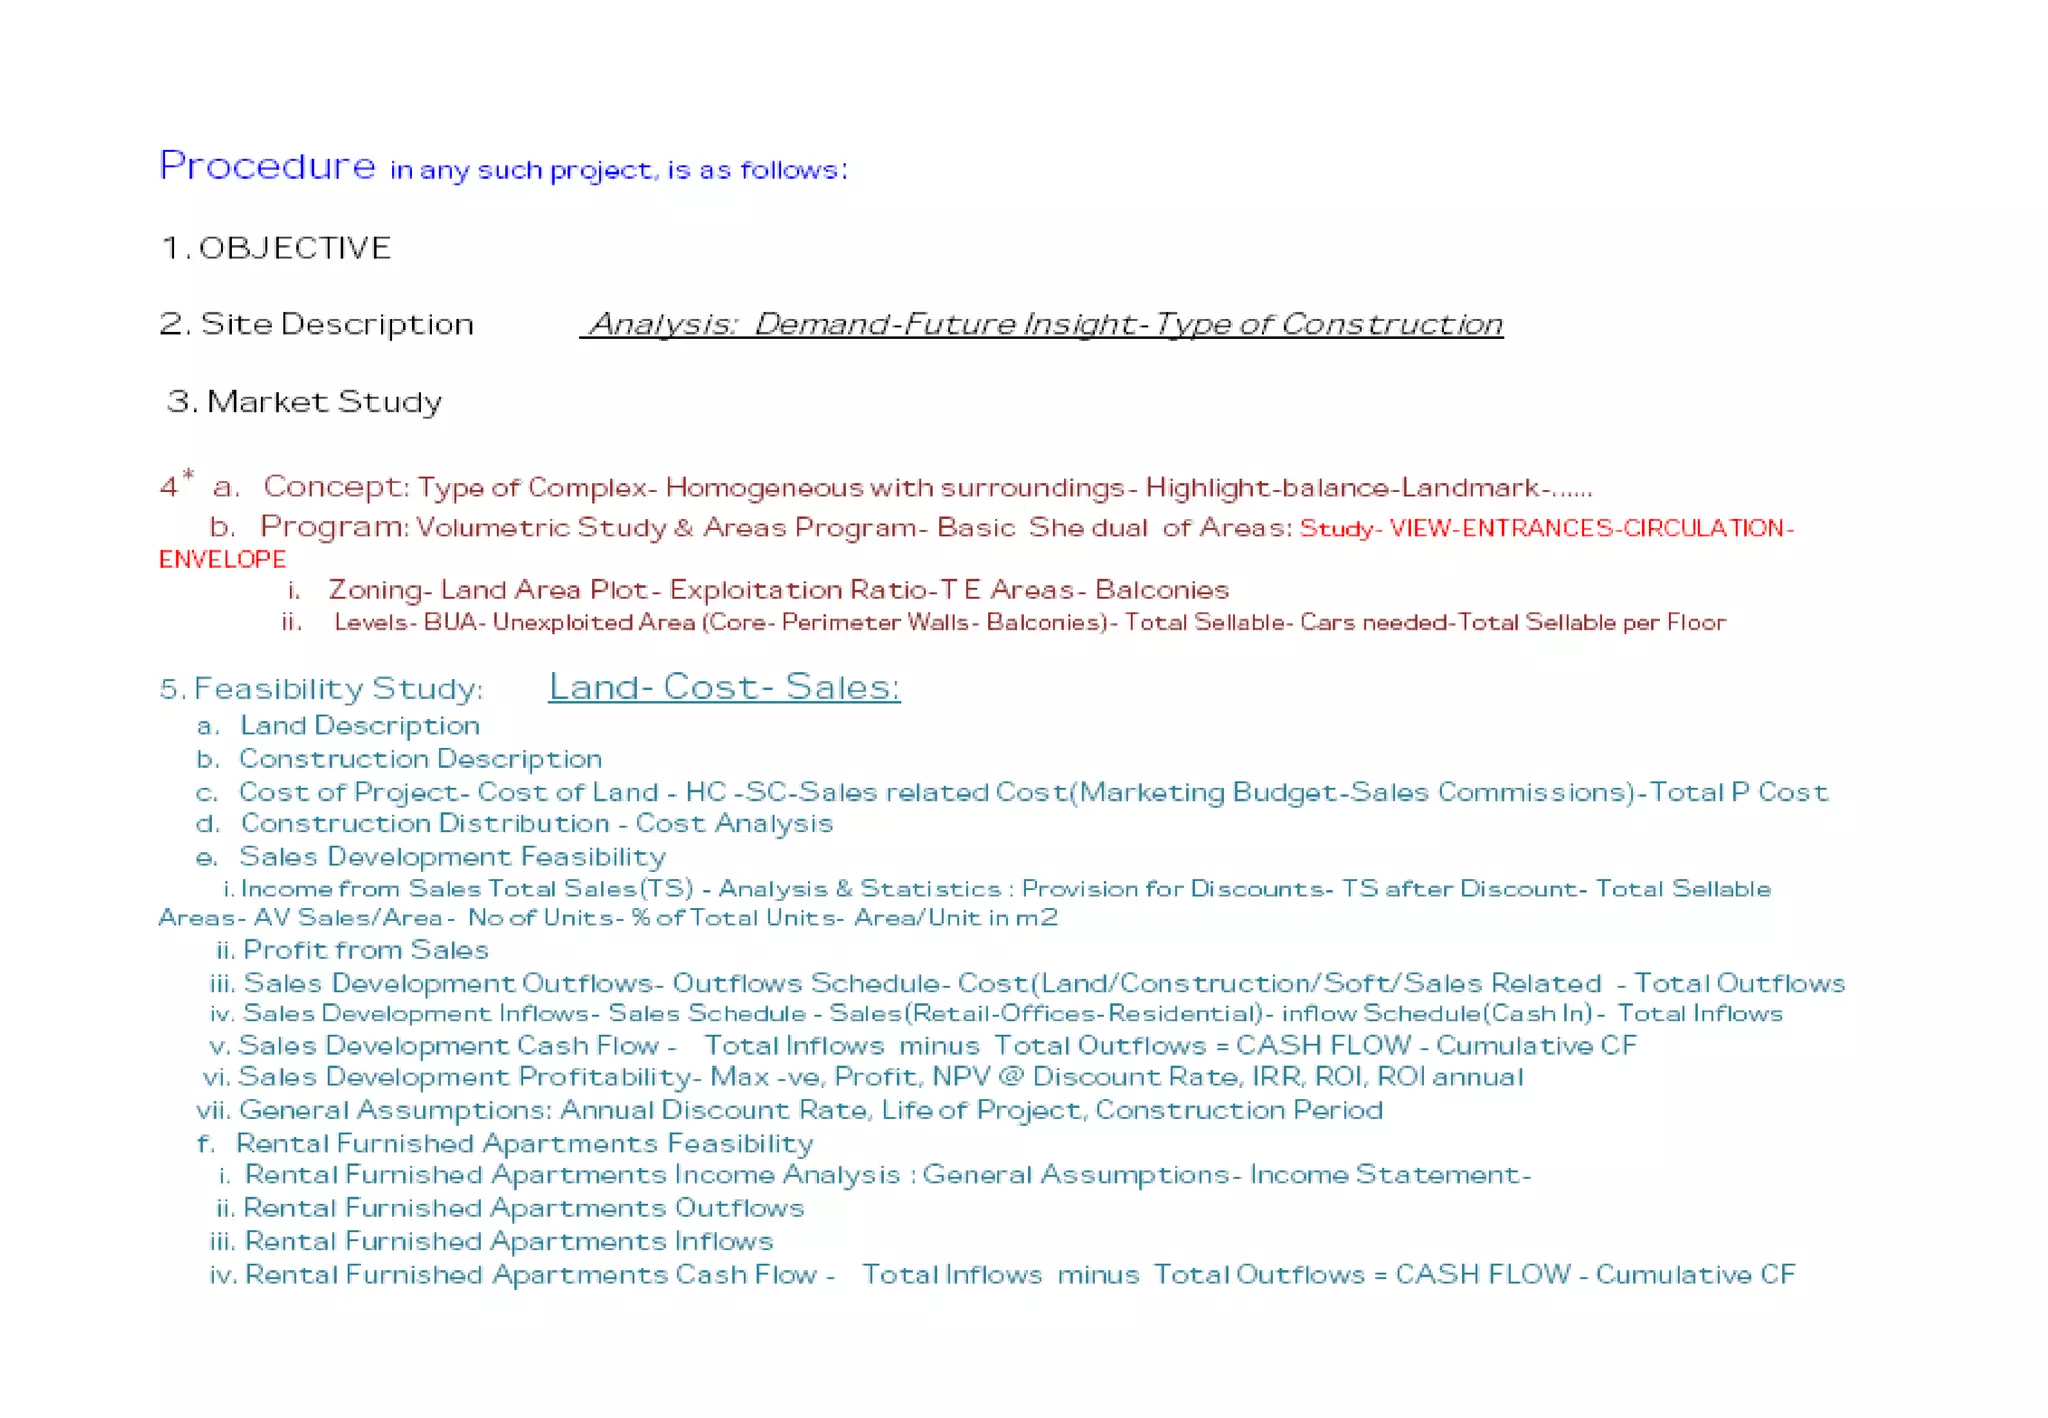
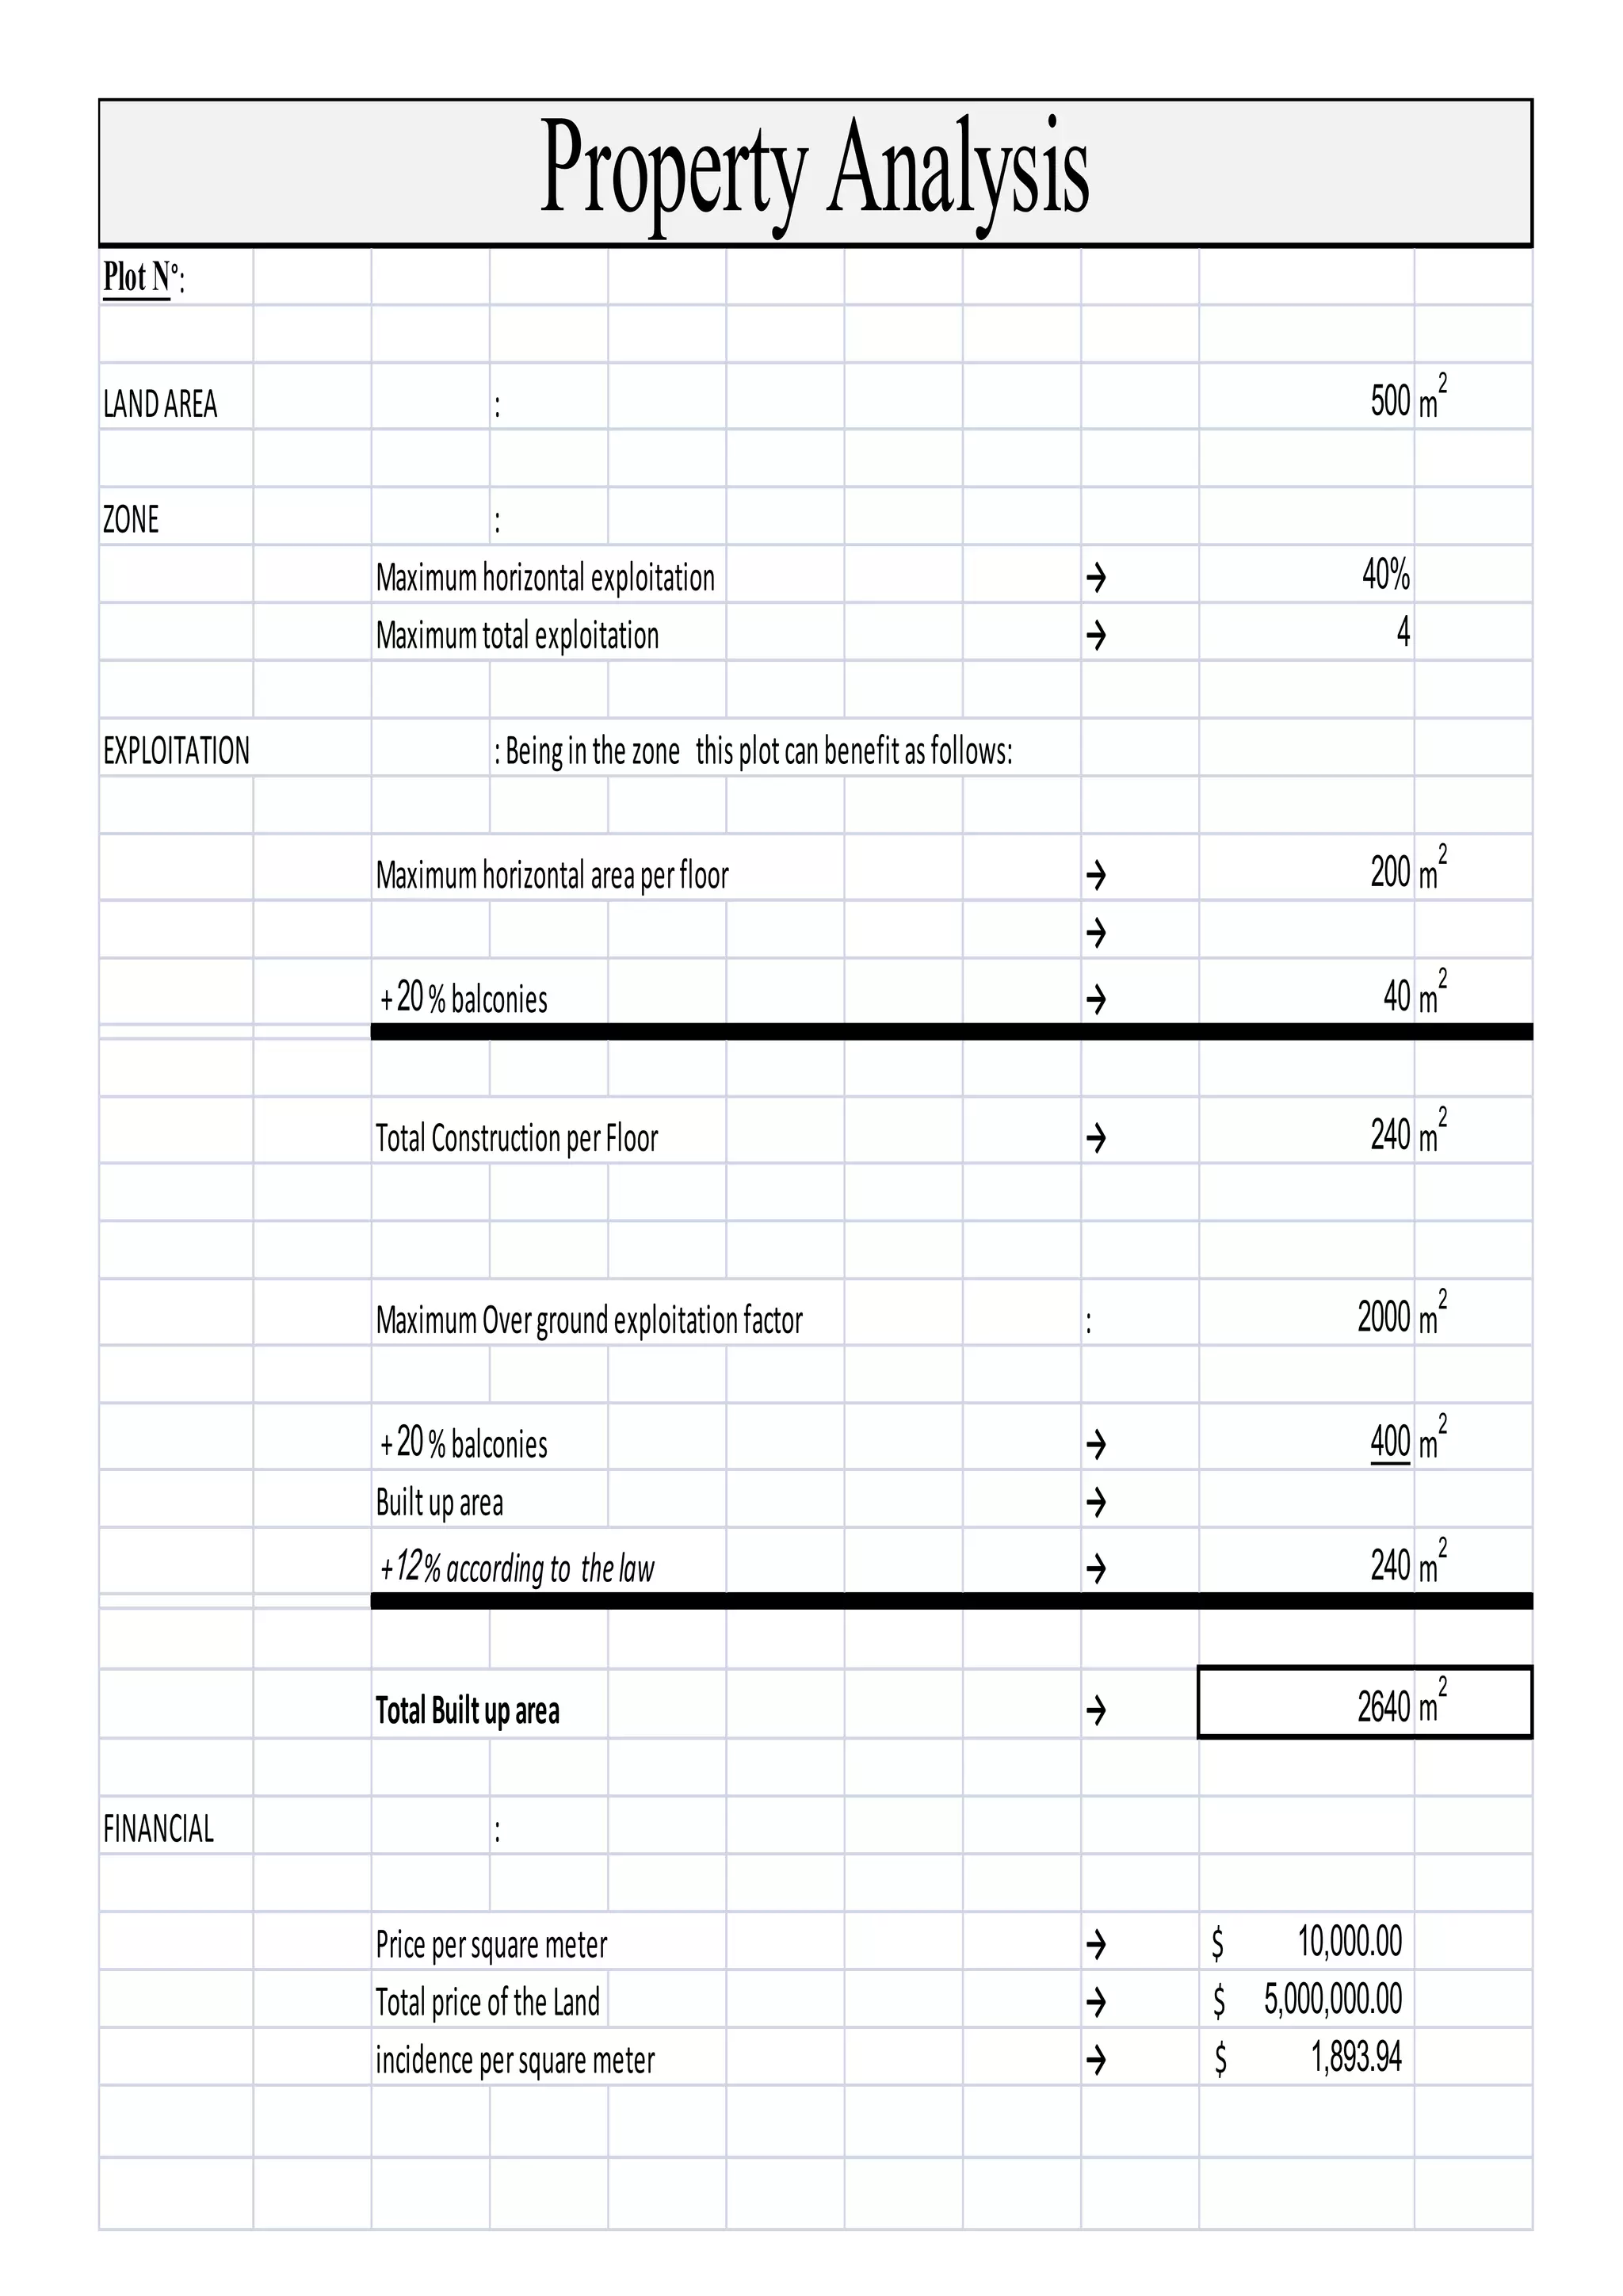
This document summarizes the key development details and financial projections for a 500 sqm residential/commercial plot of land zoned for a maximum exploitation of 4000 sqm. Key points include:
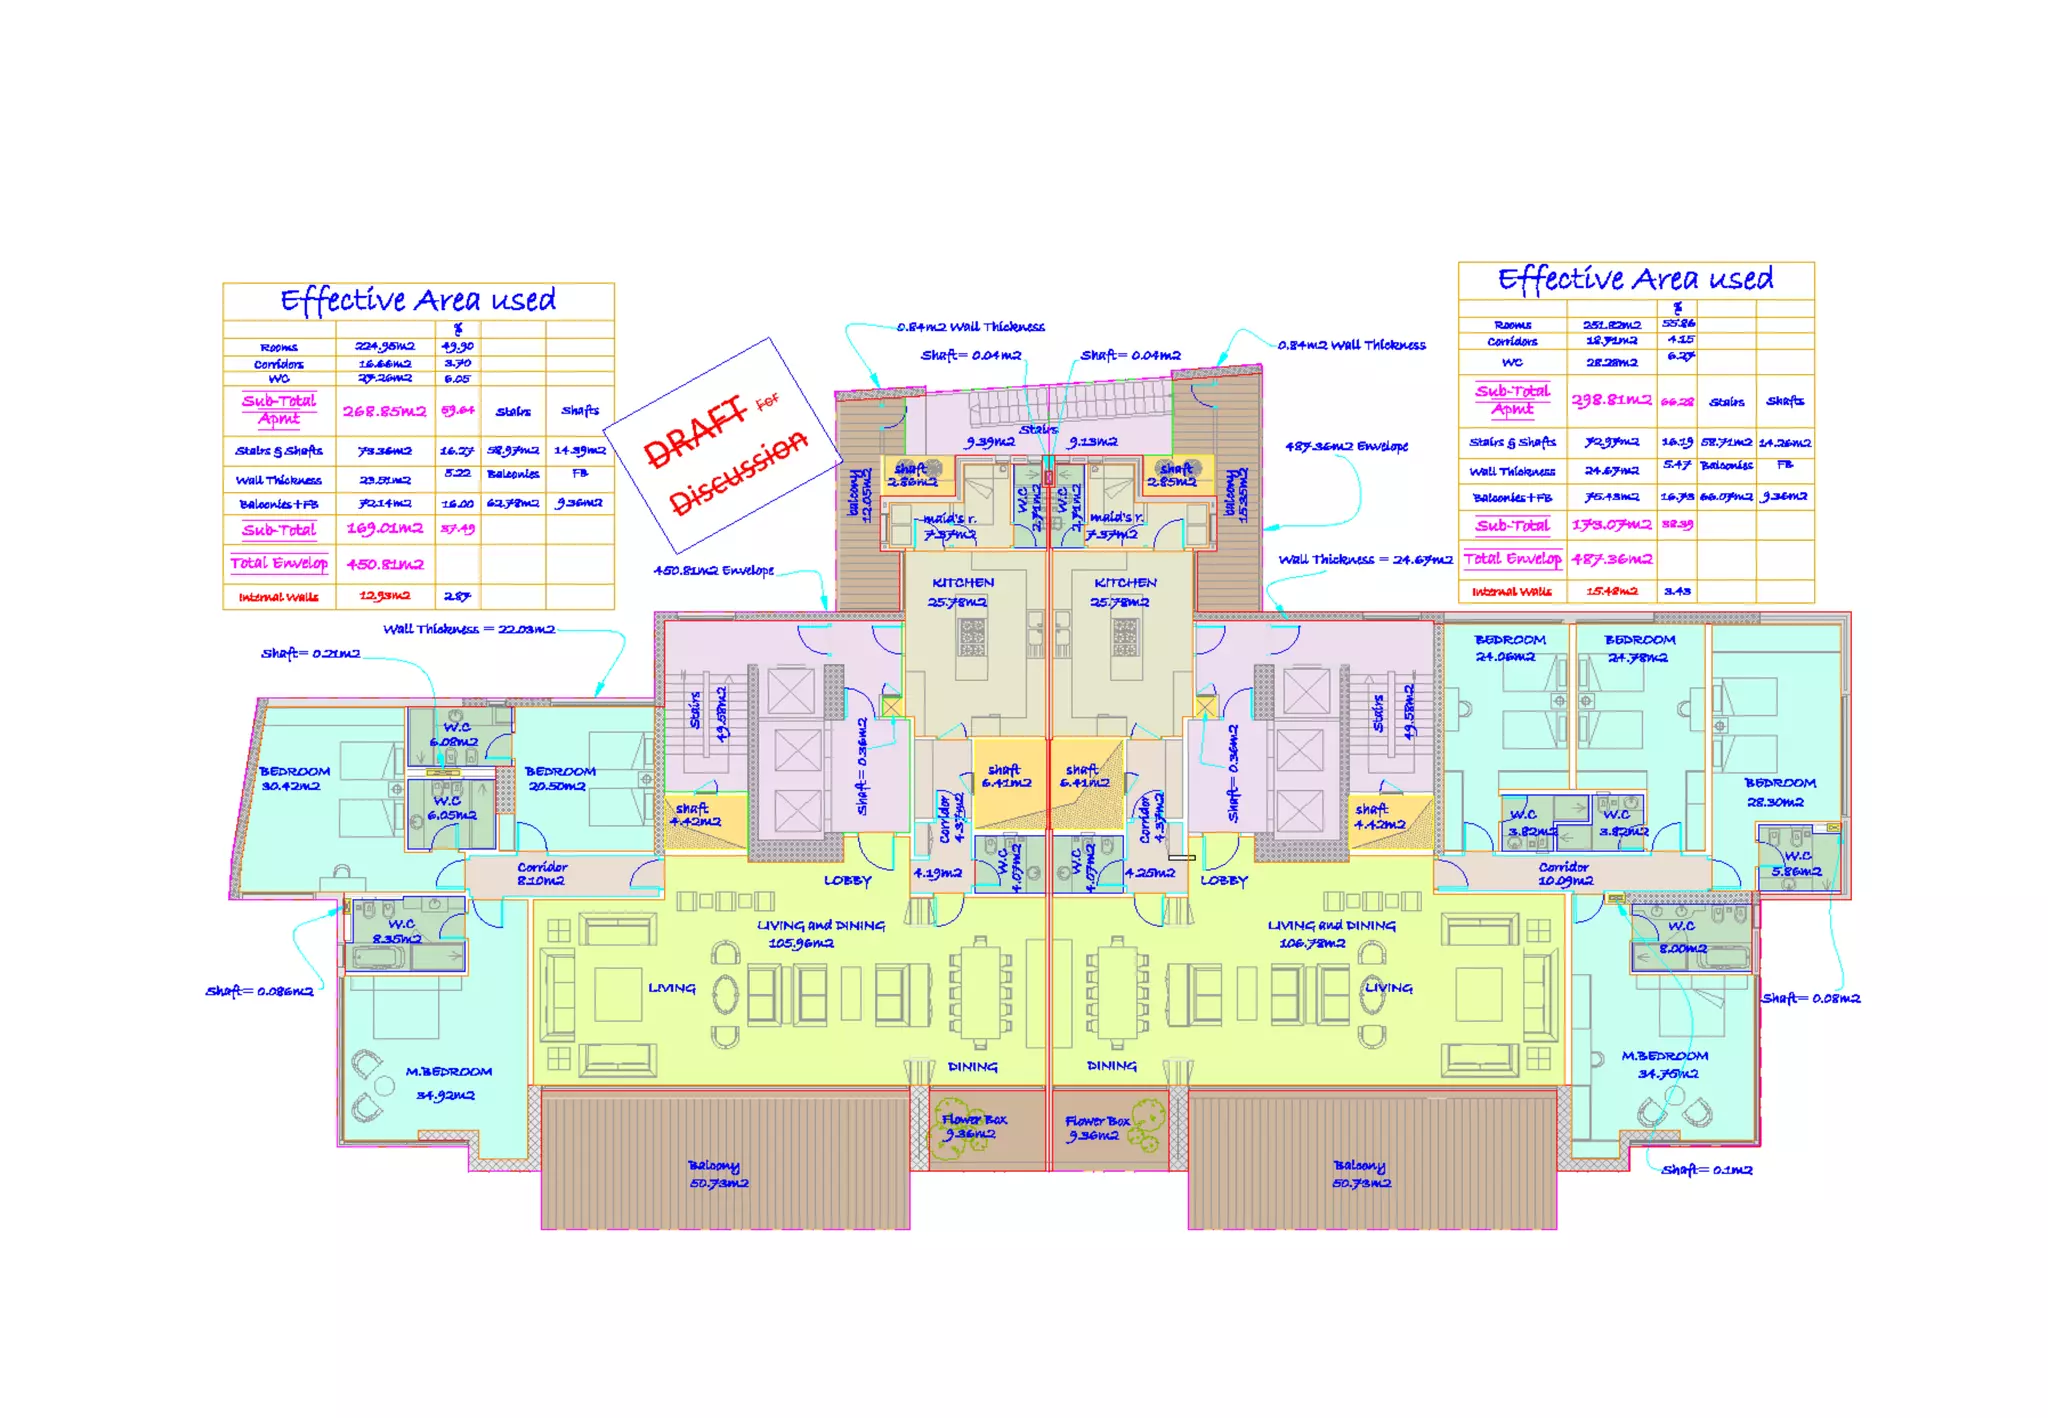
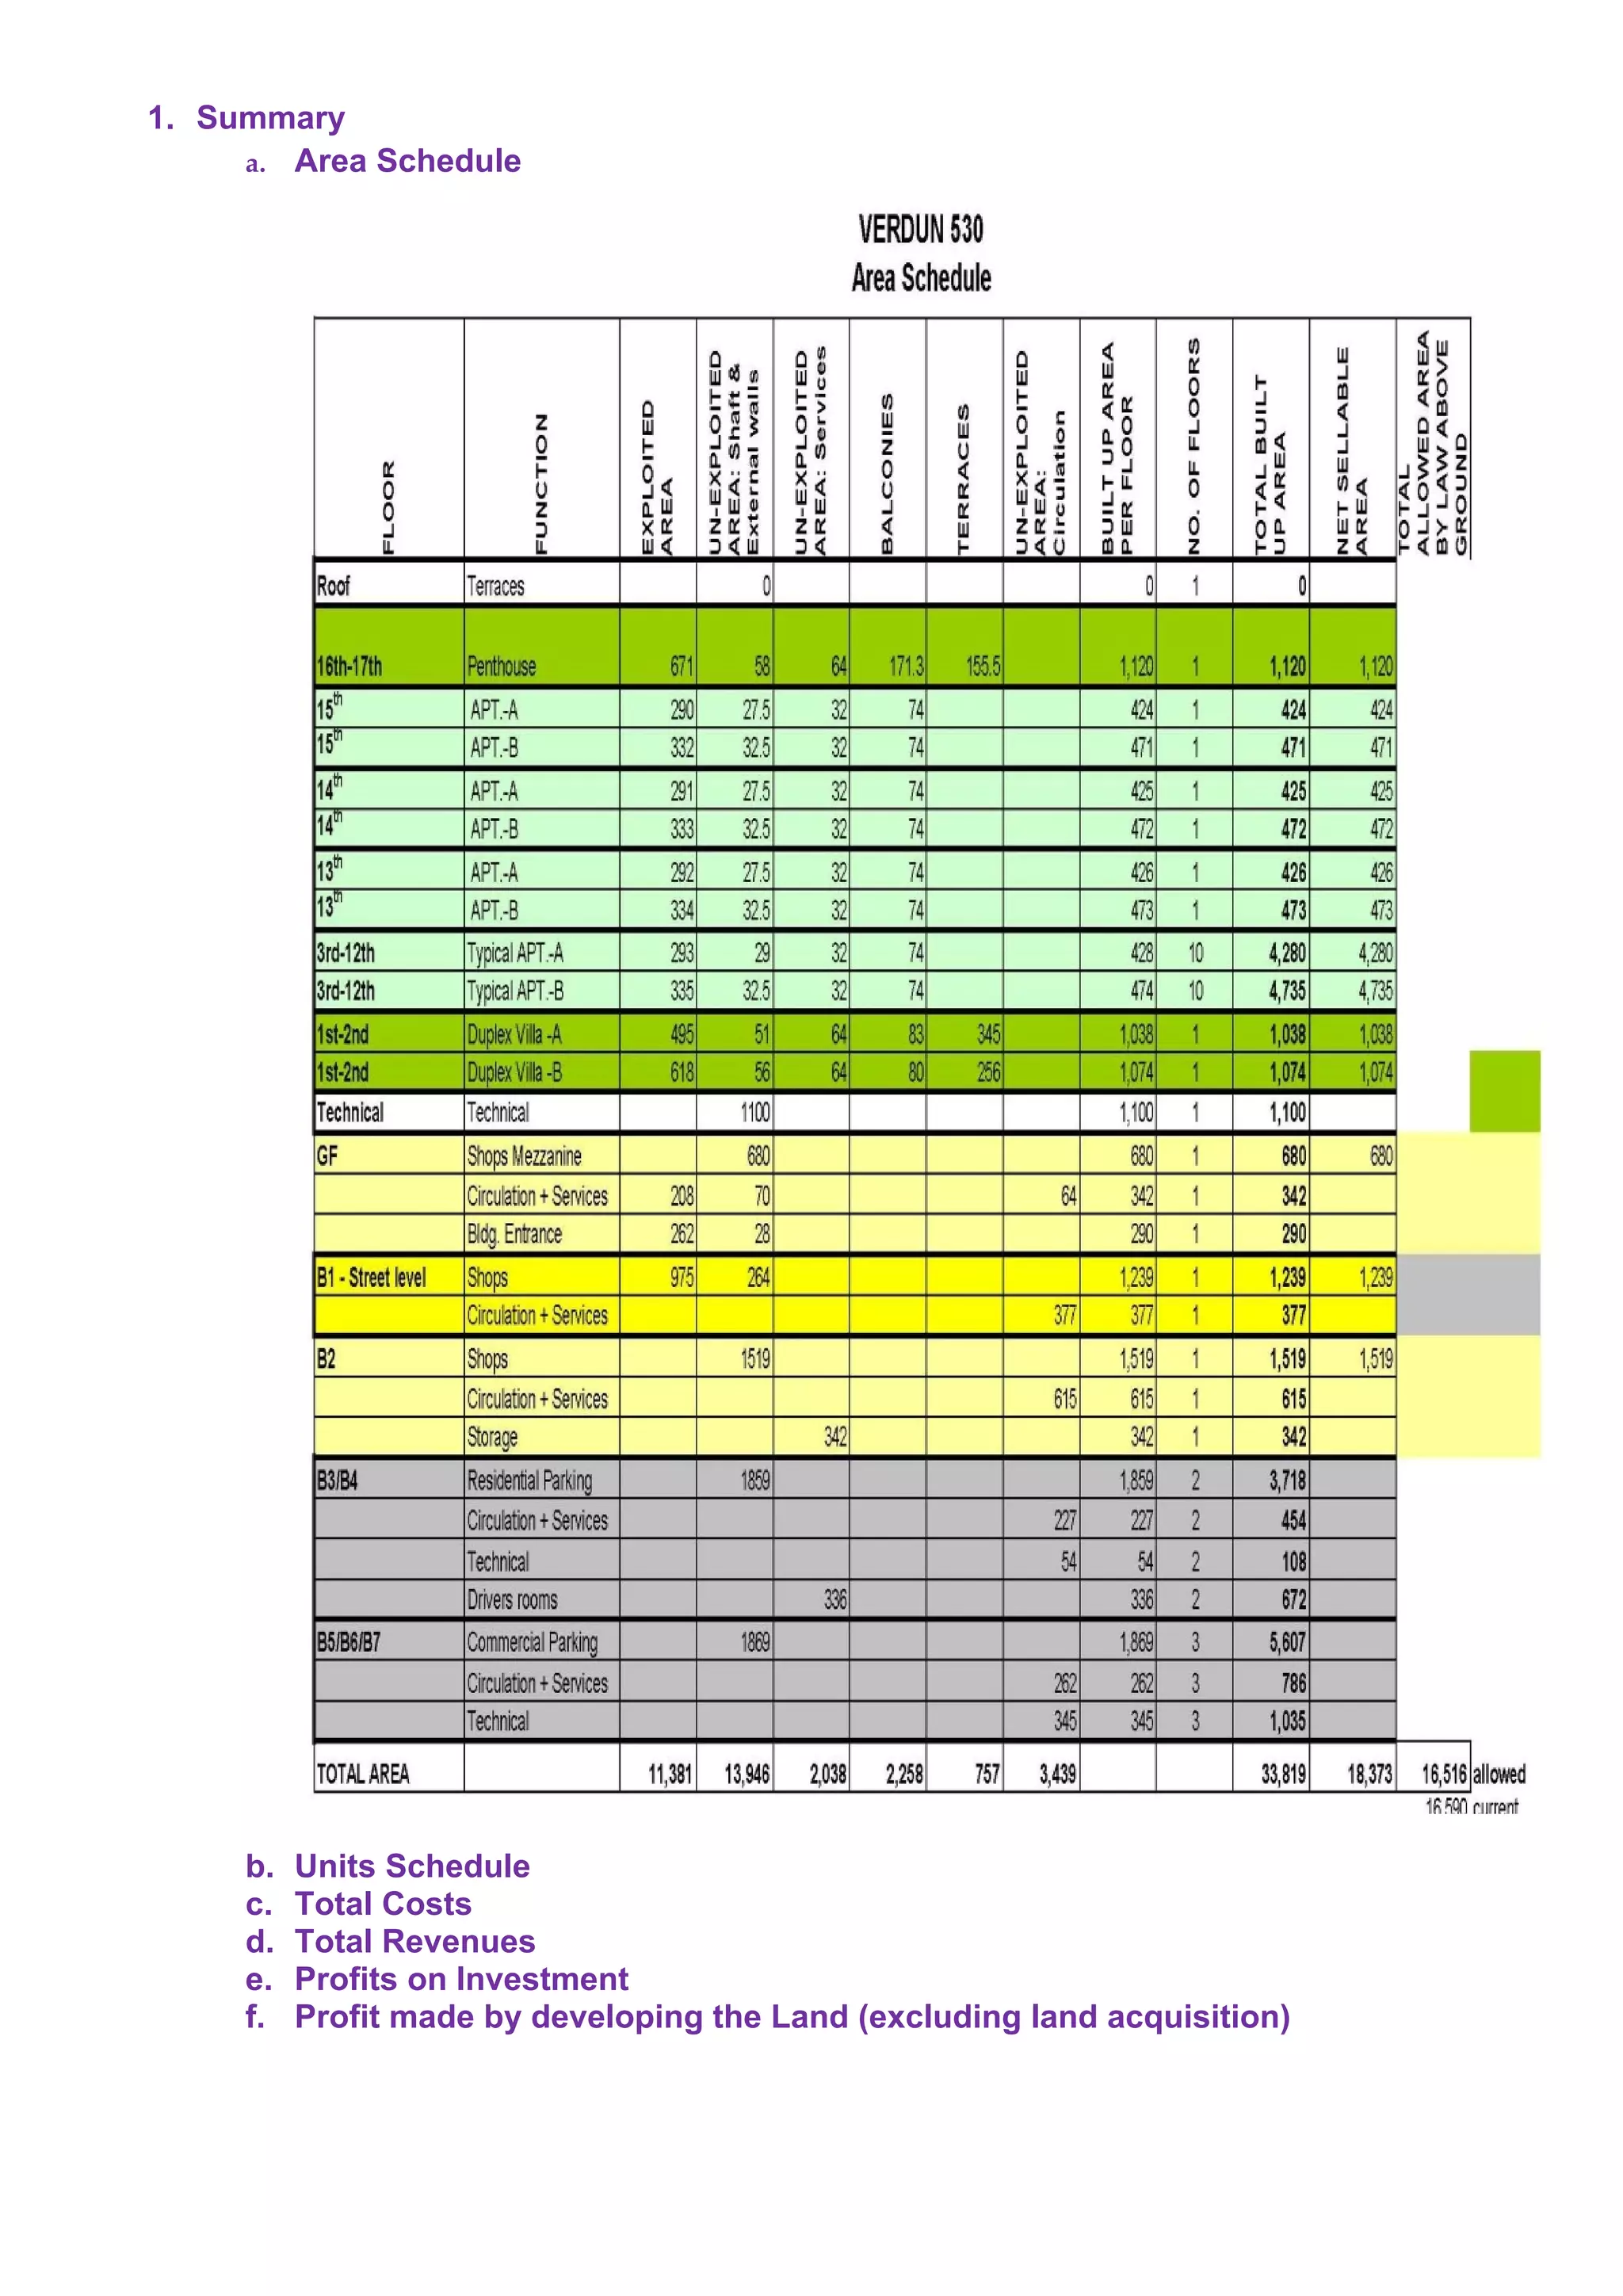
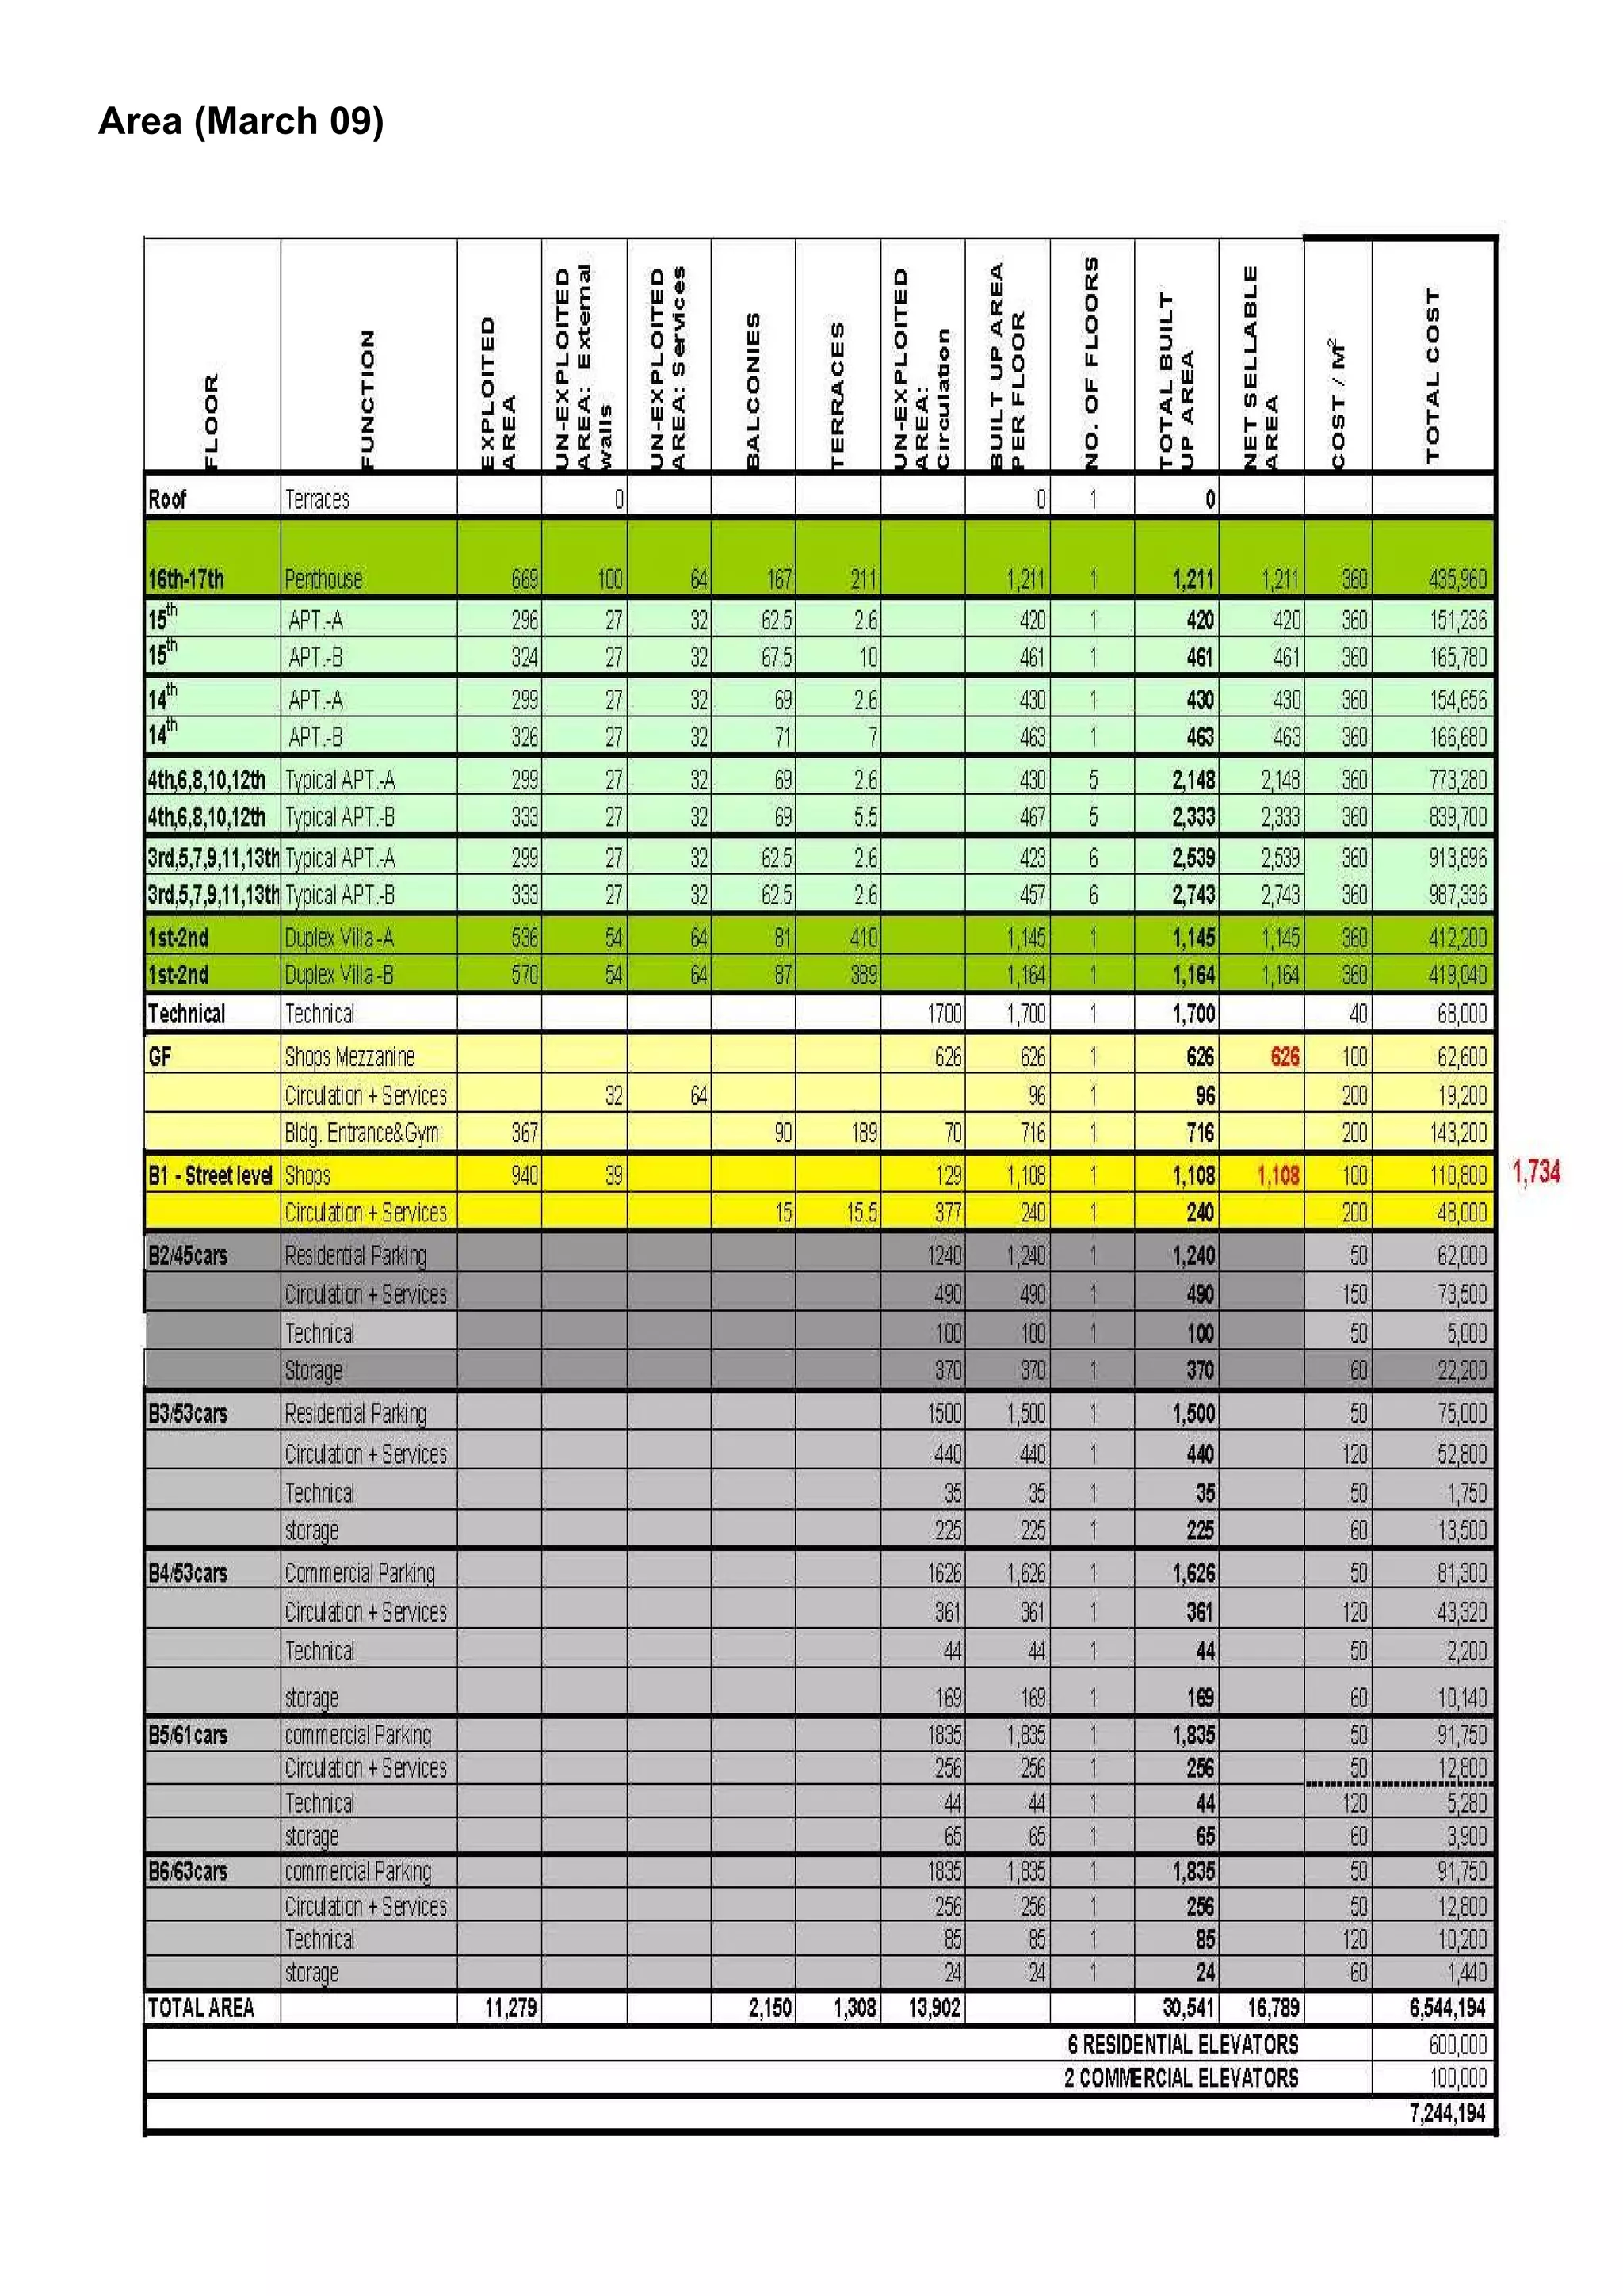
1) The plot can be developed to a maximum horizontal area of 200 sqm per floor and total construction of 2640 sqm.
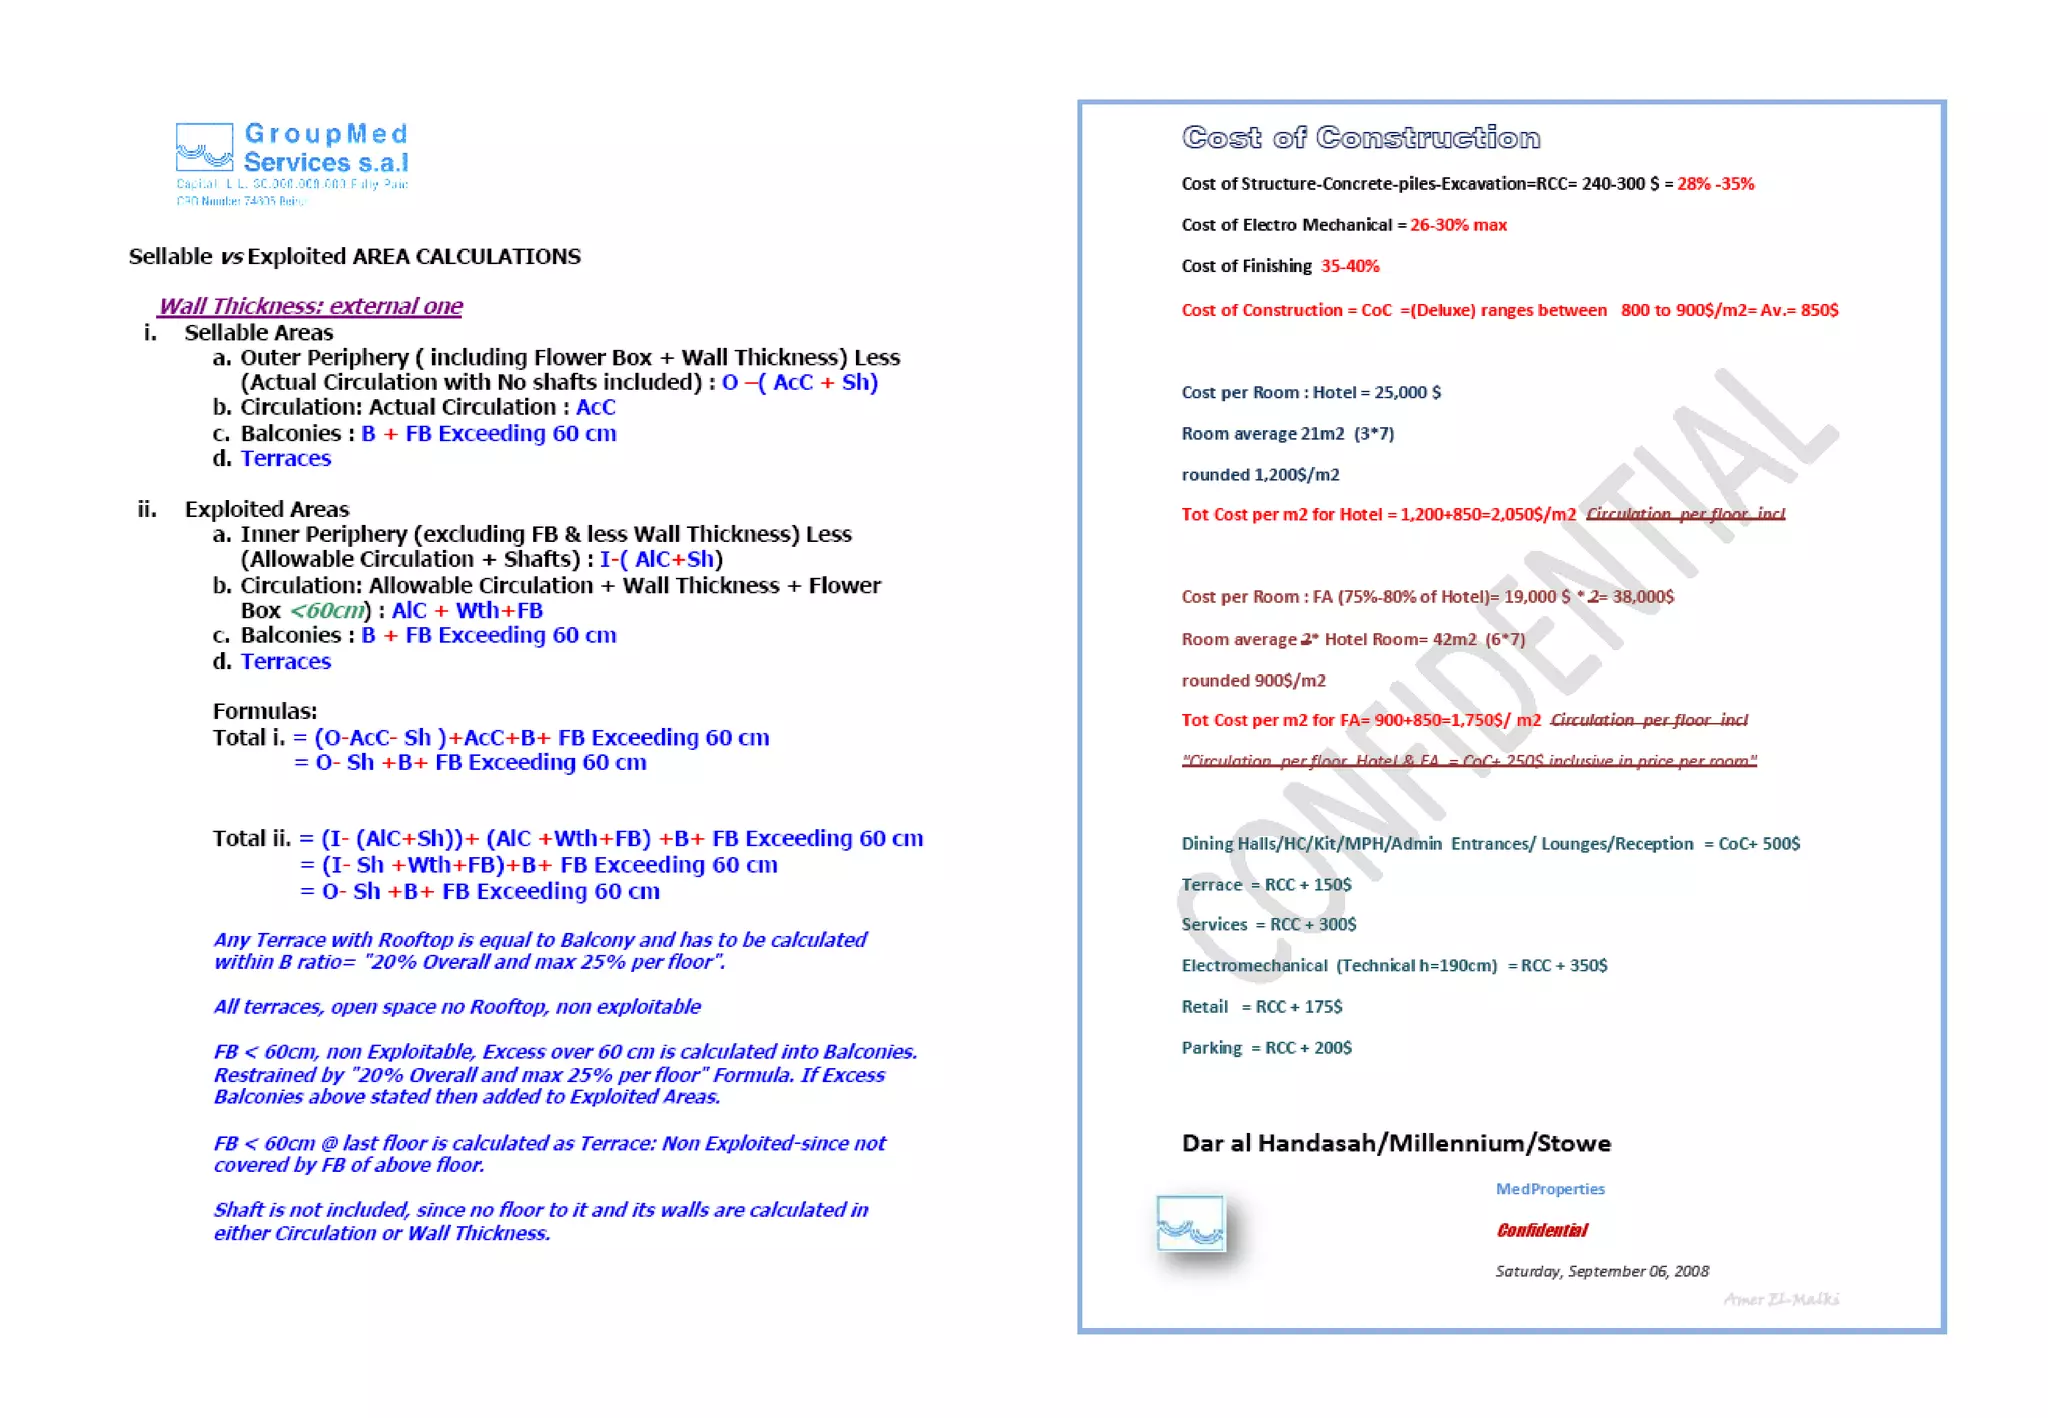
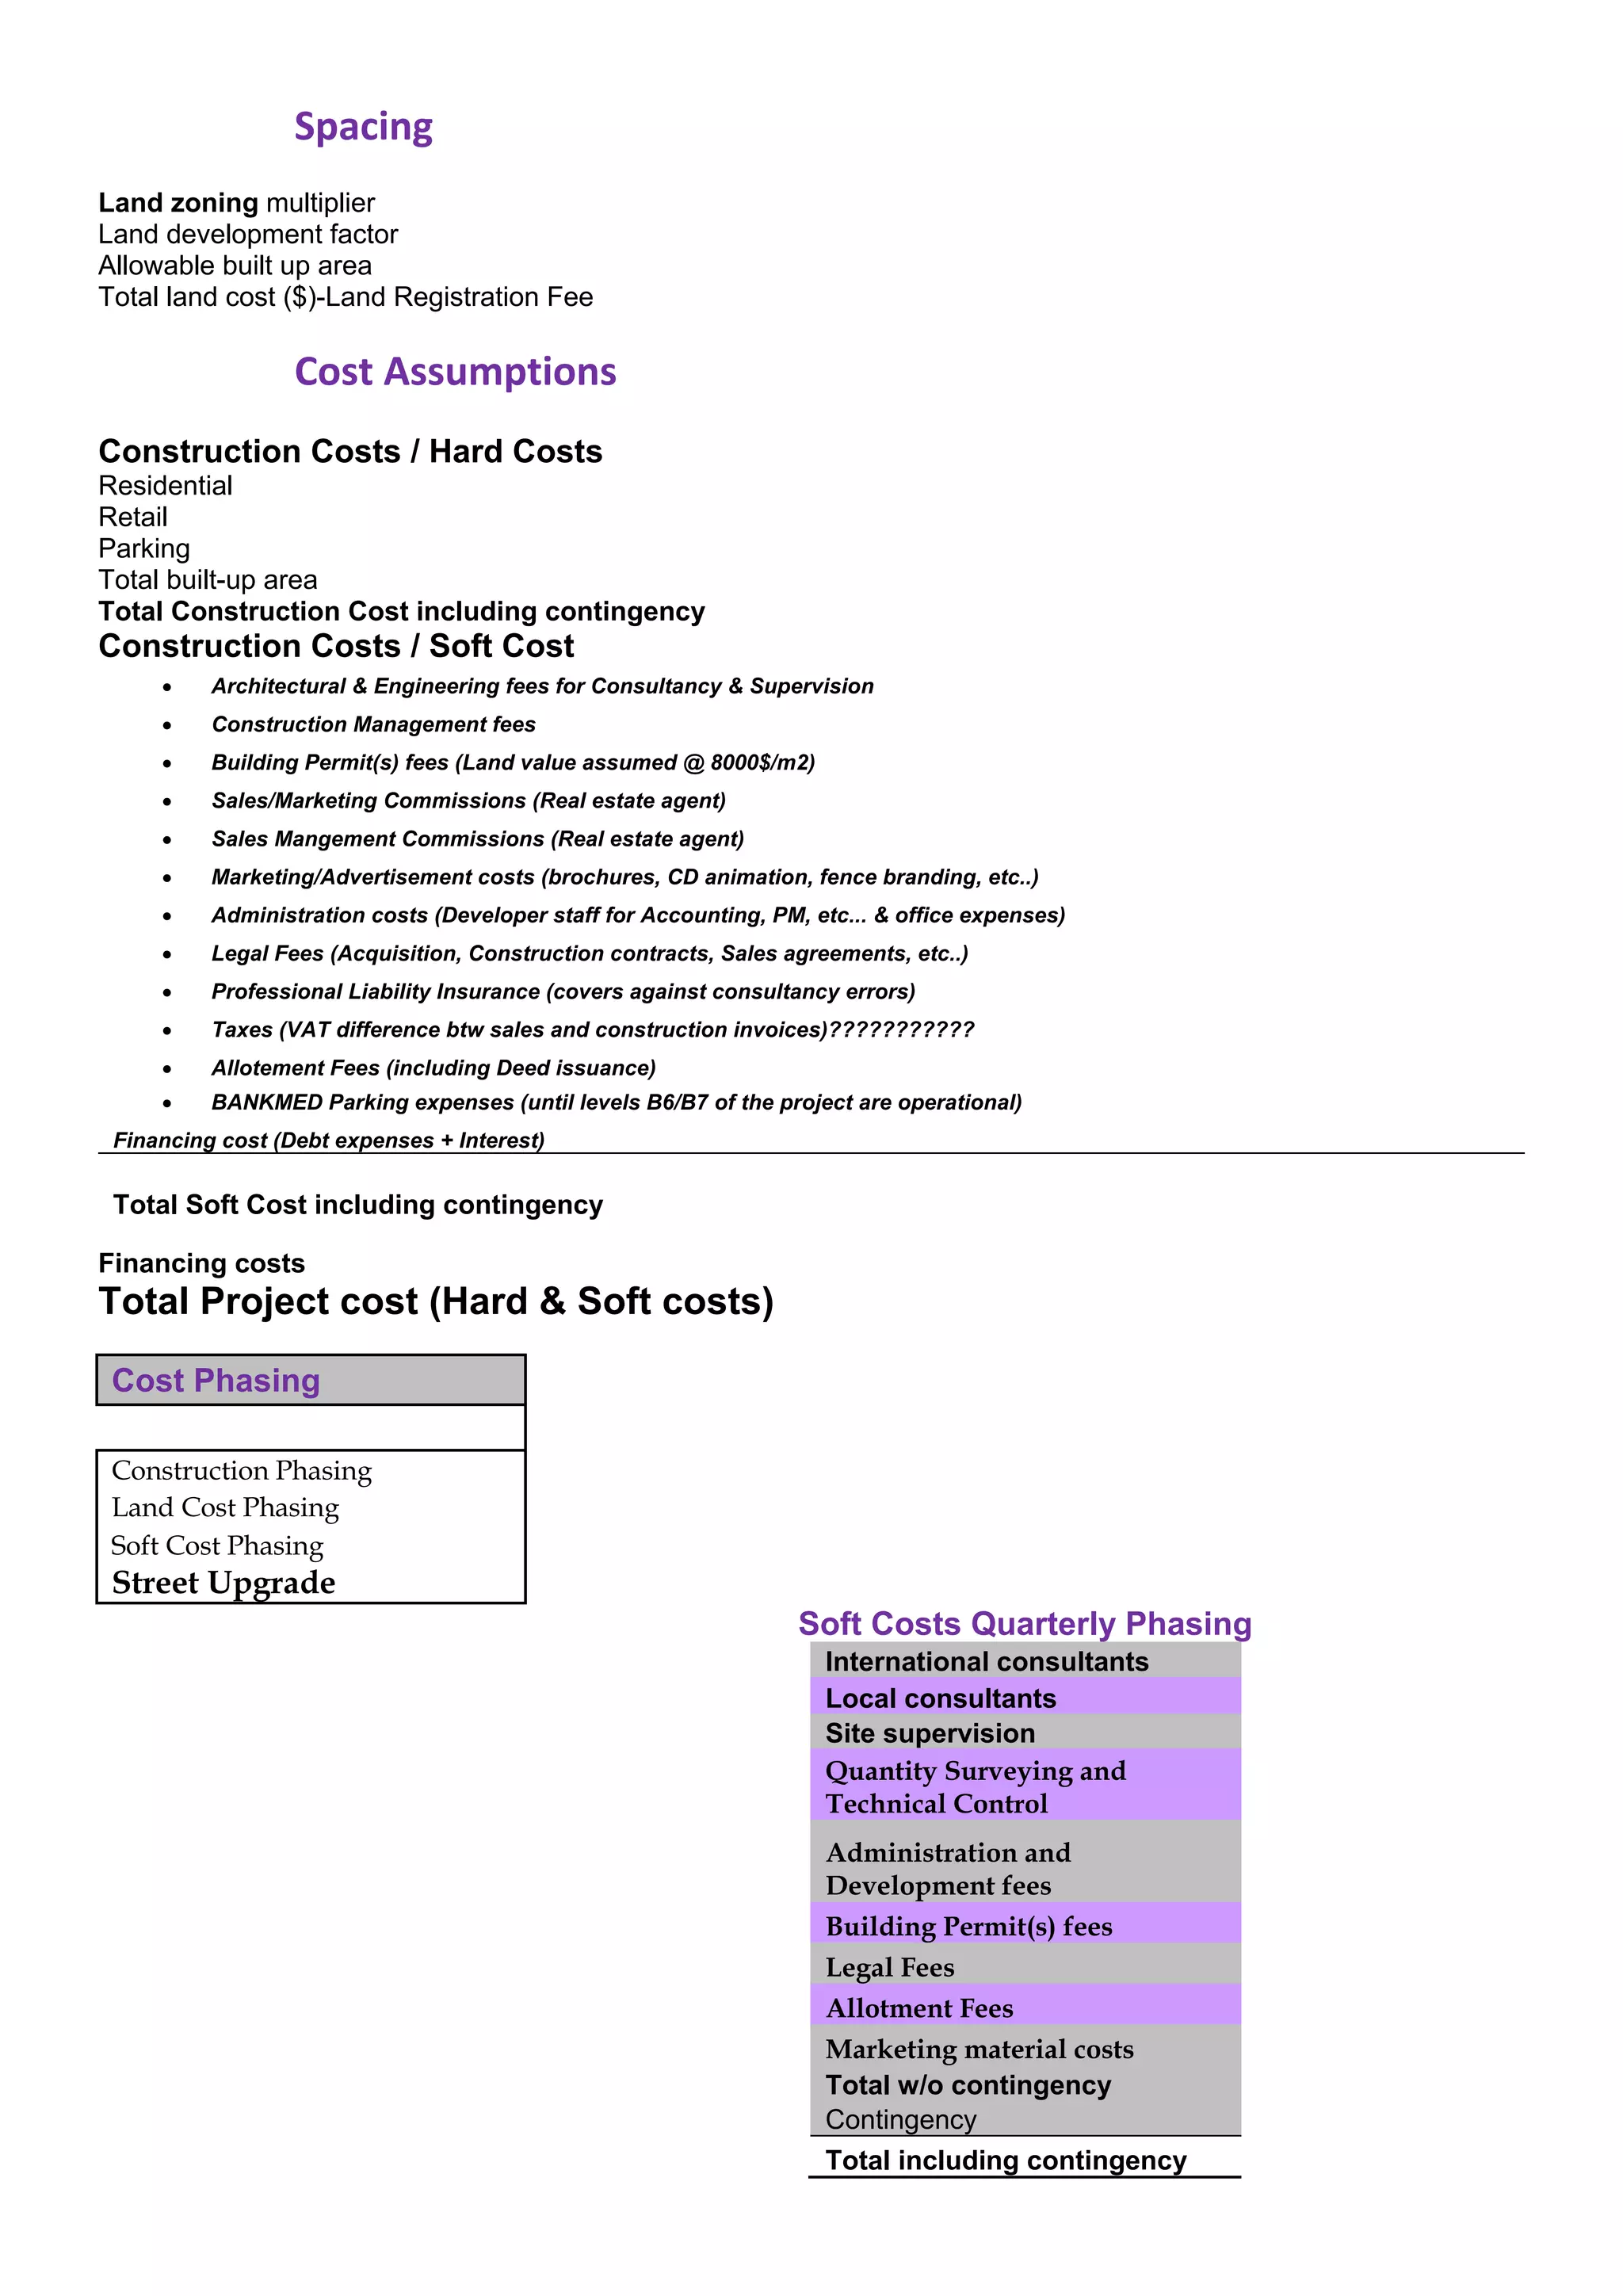
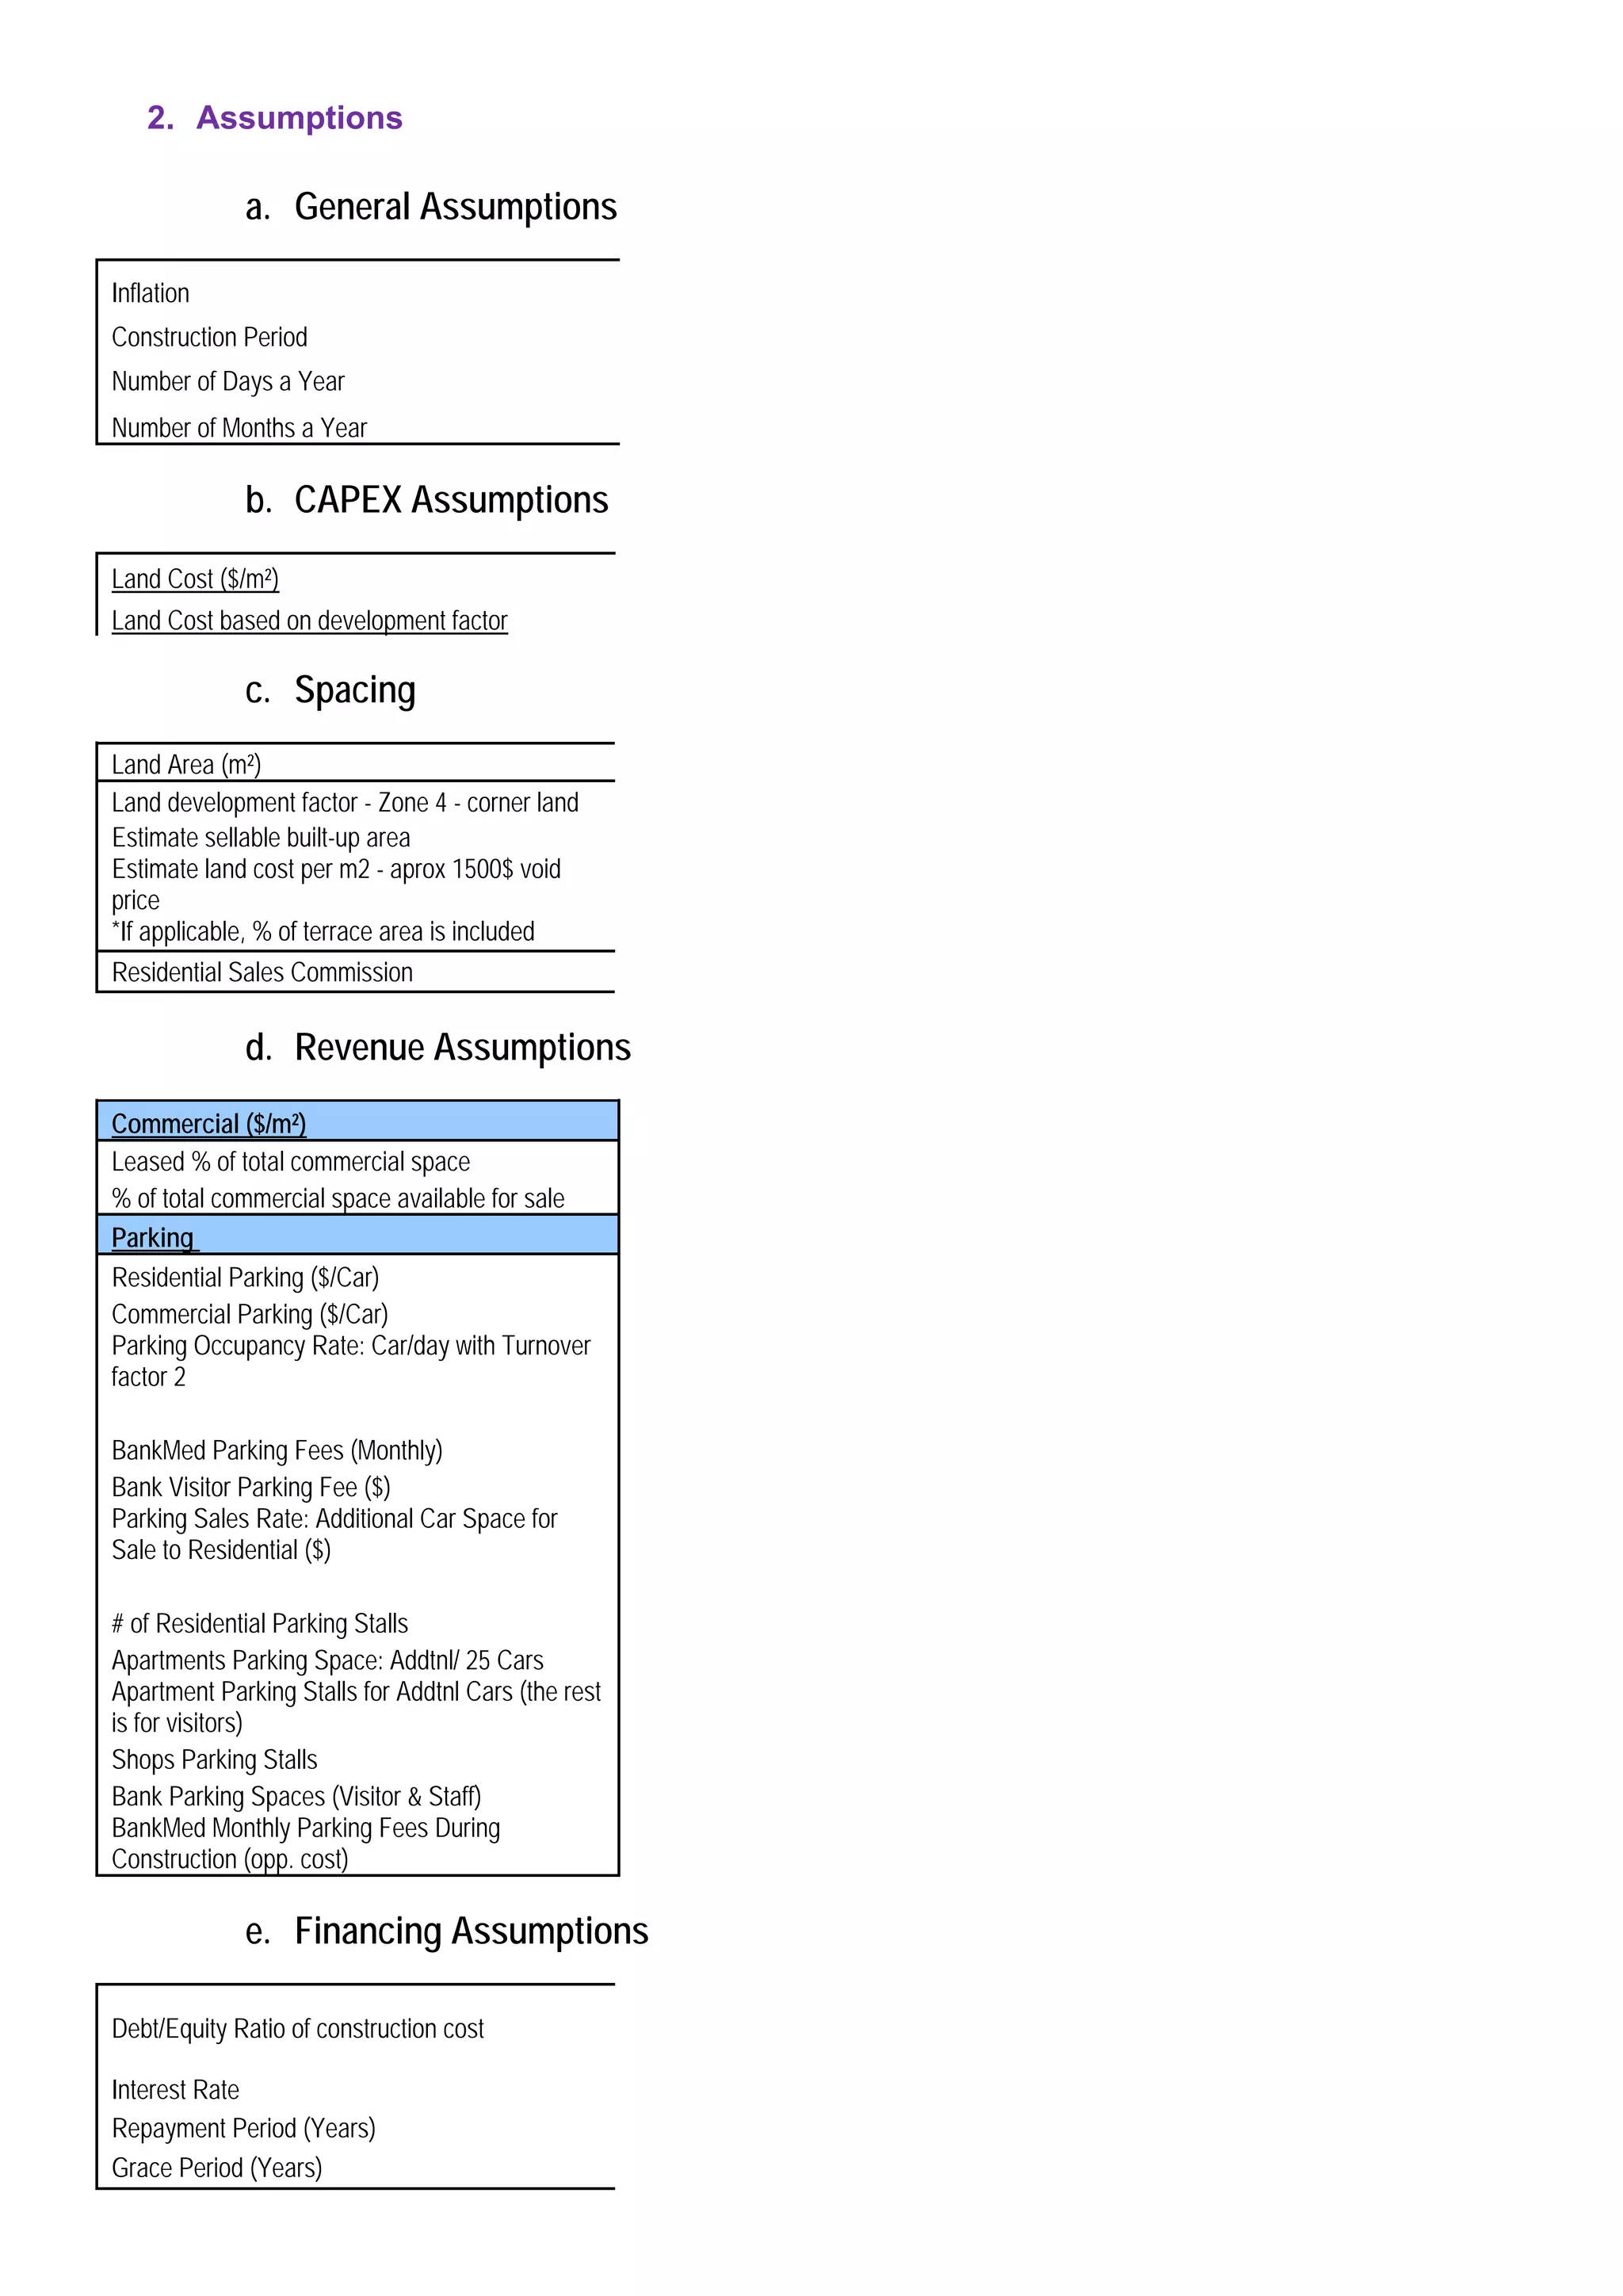
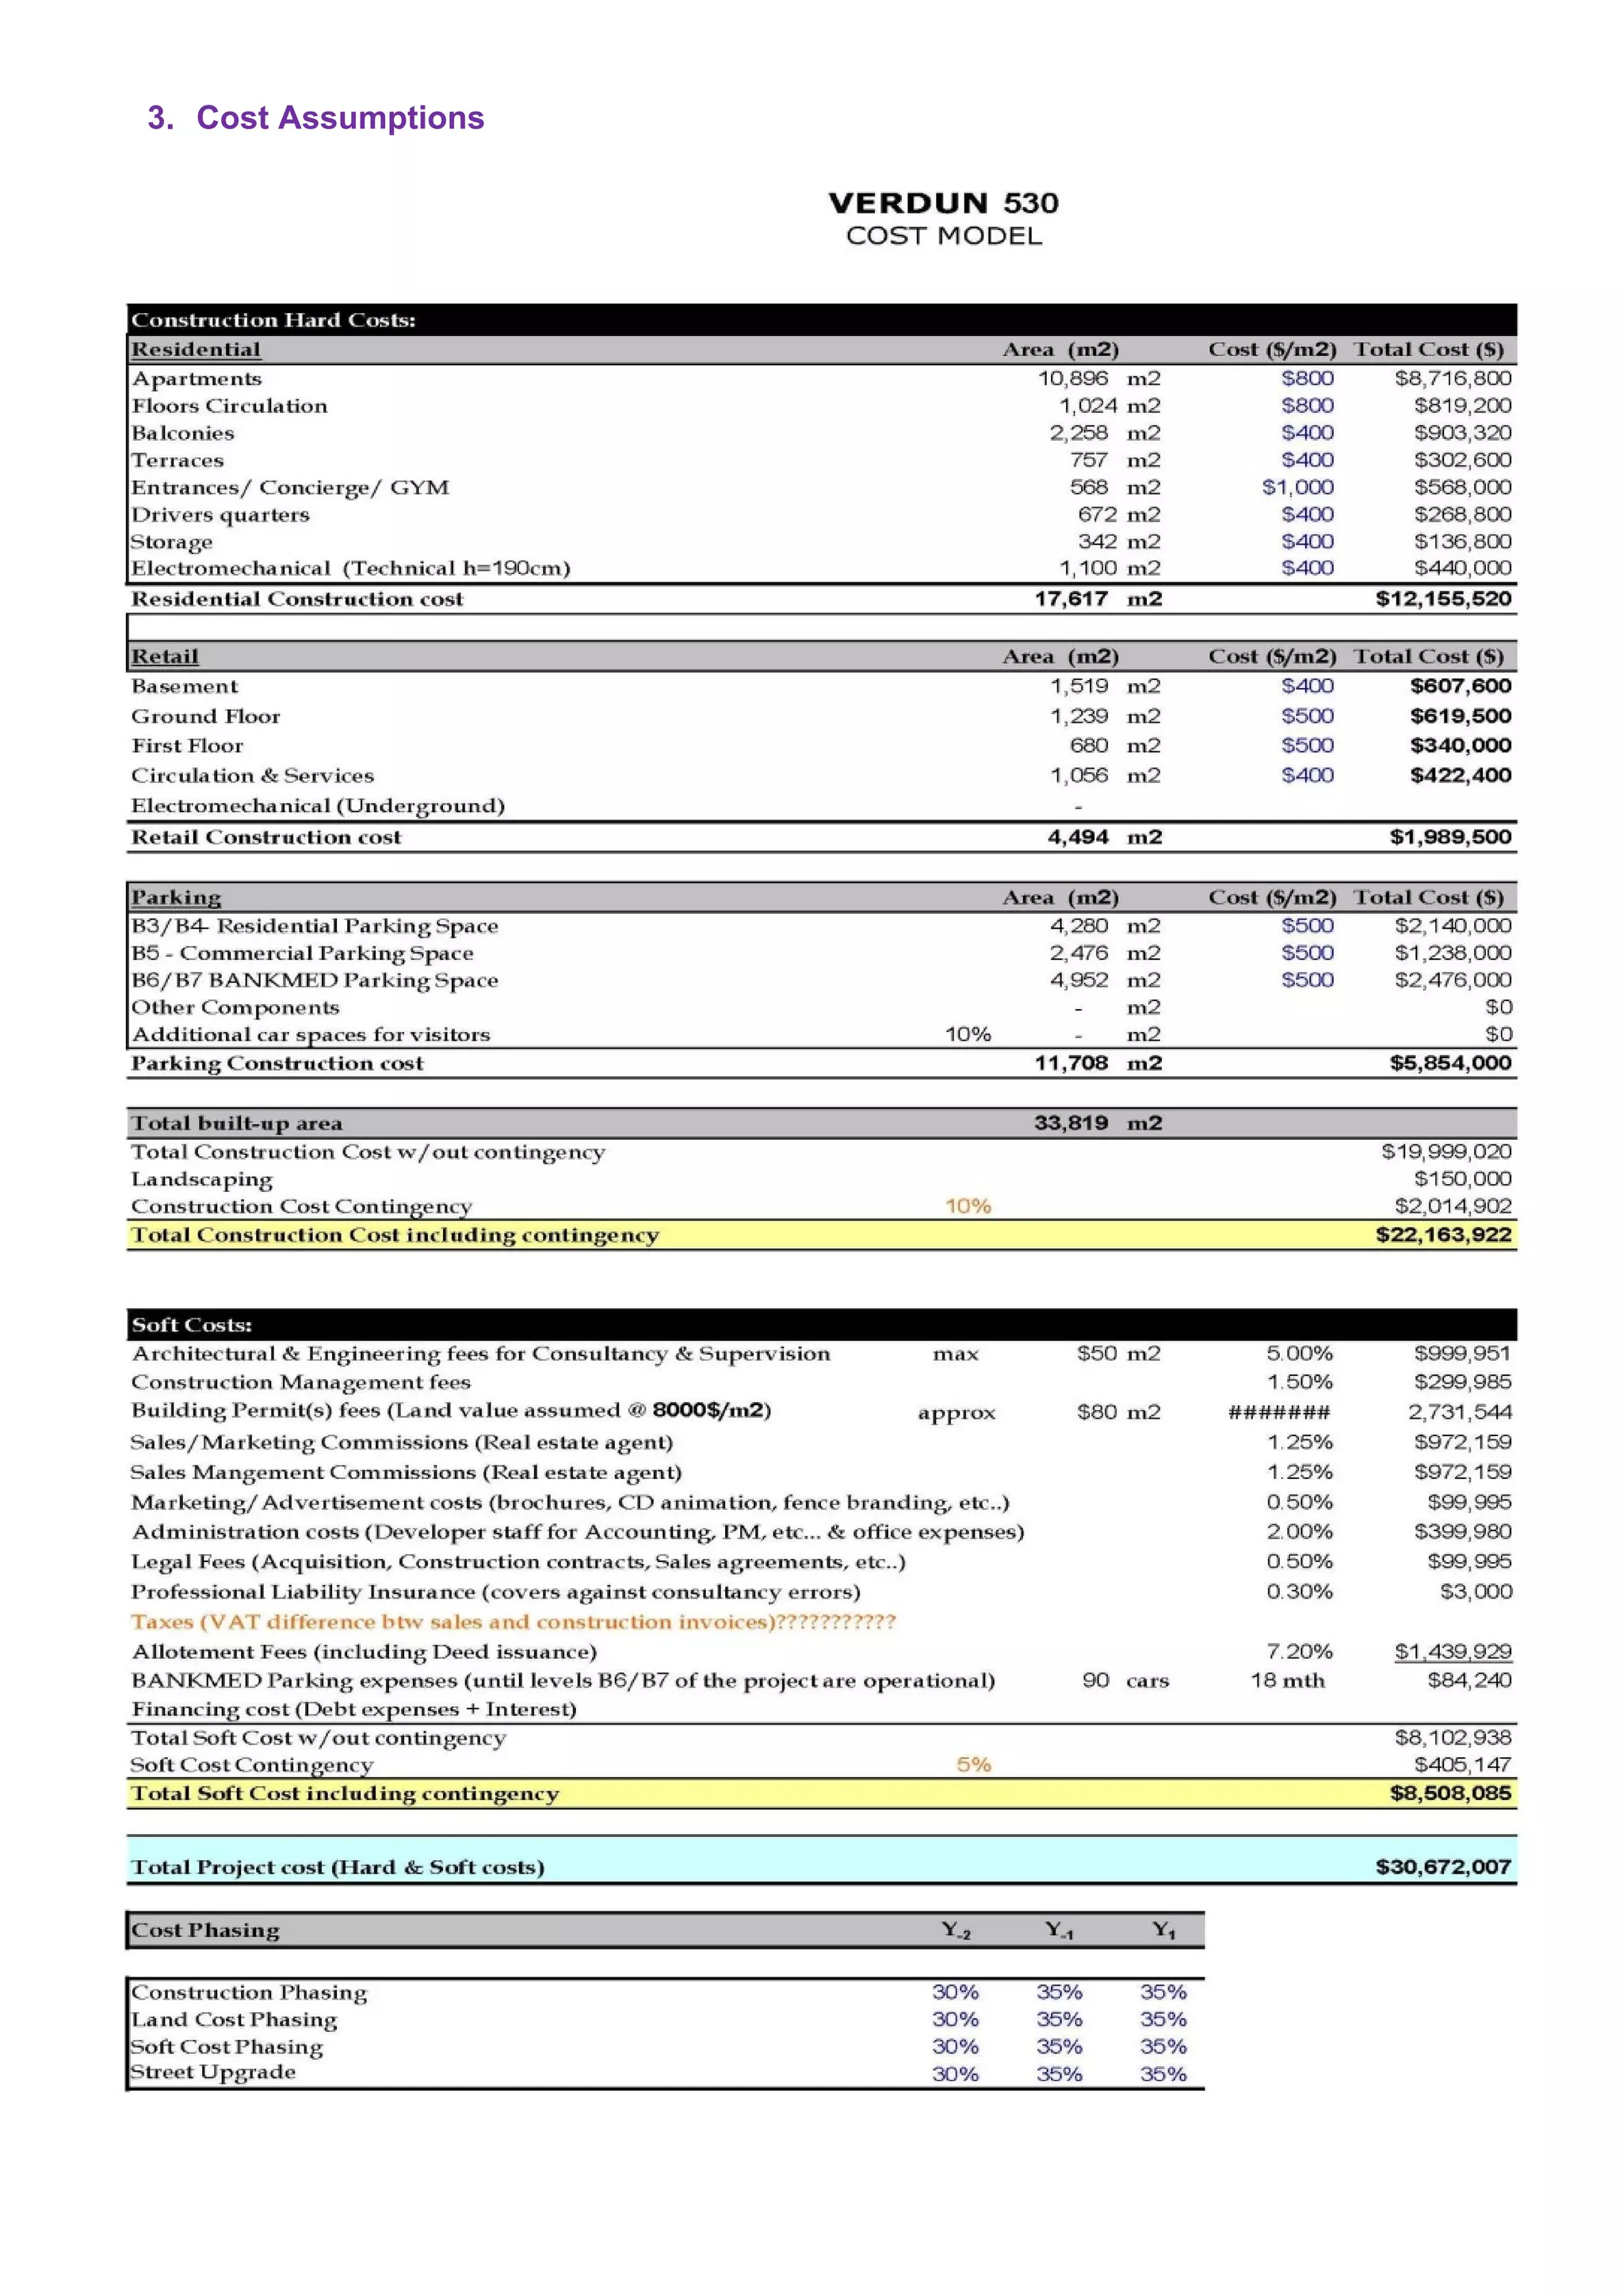
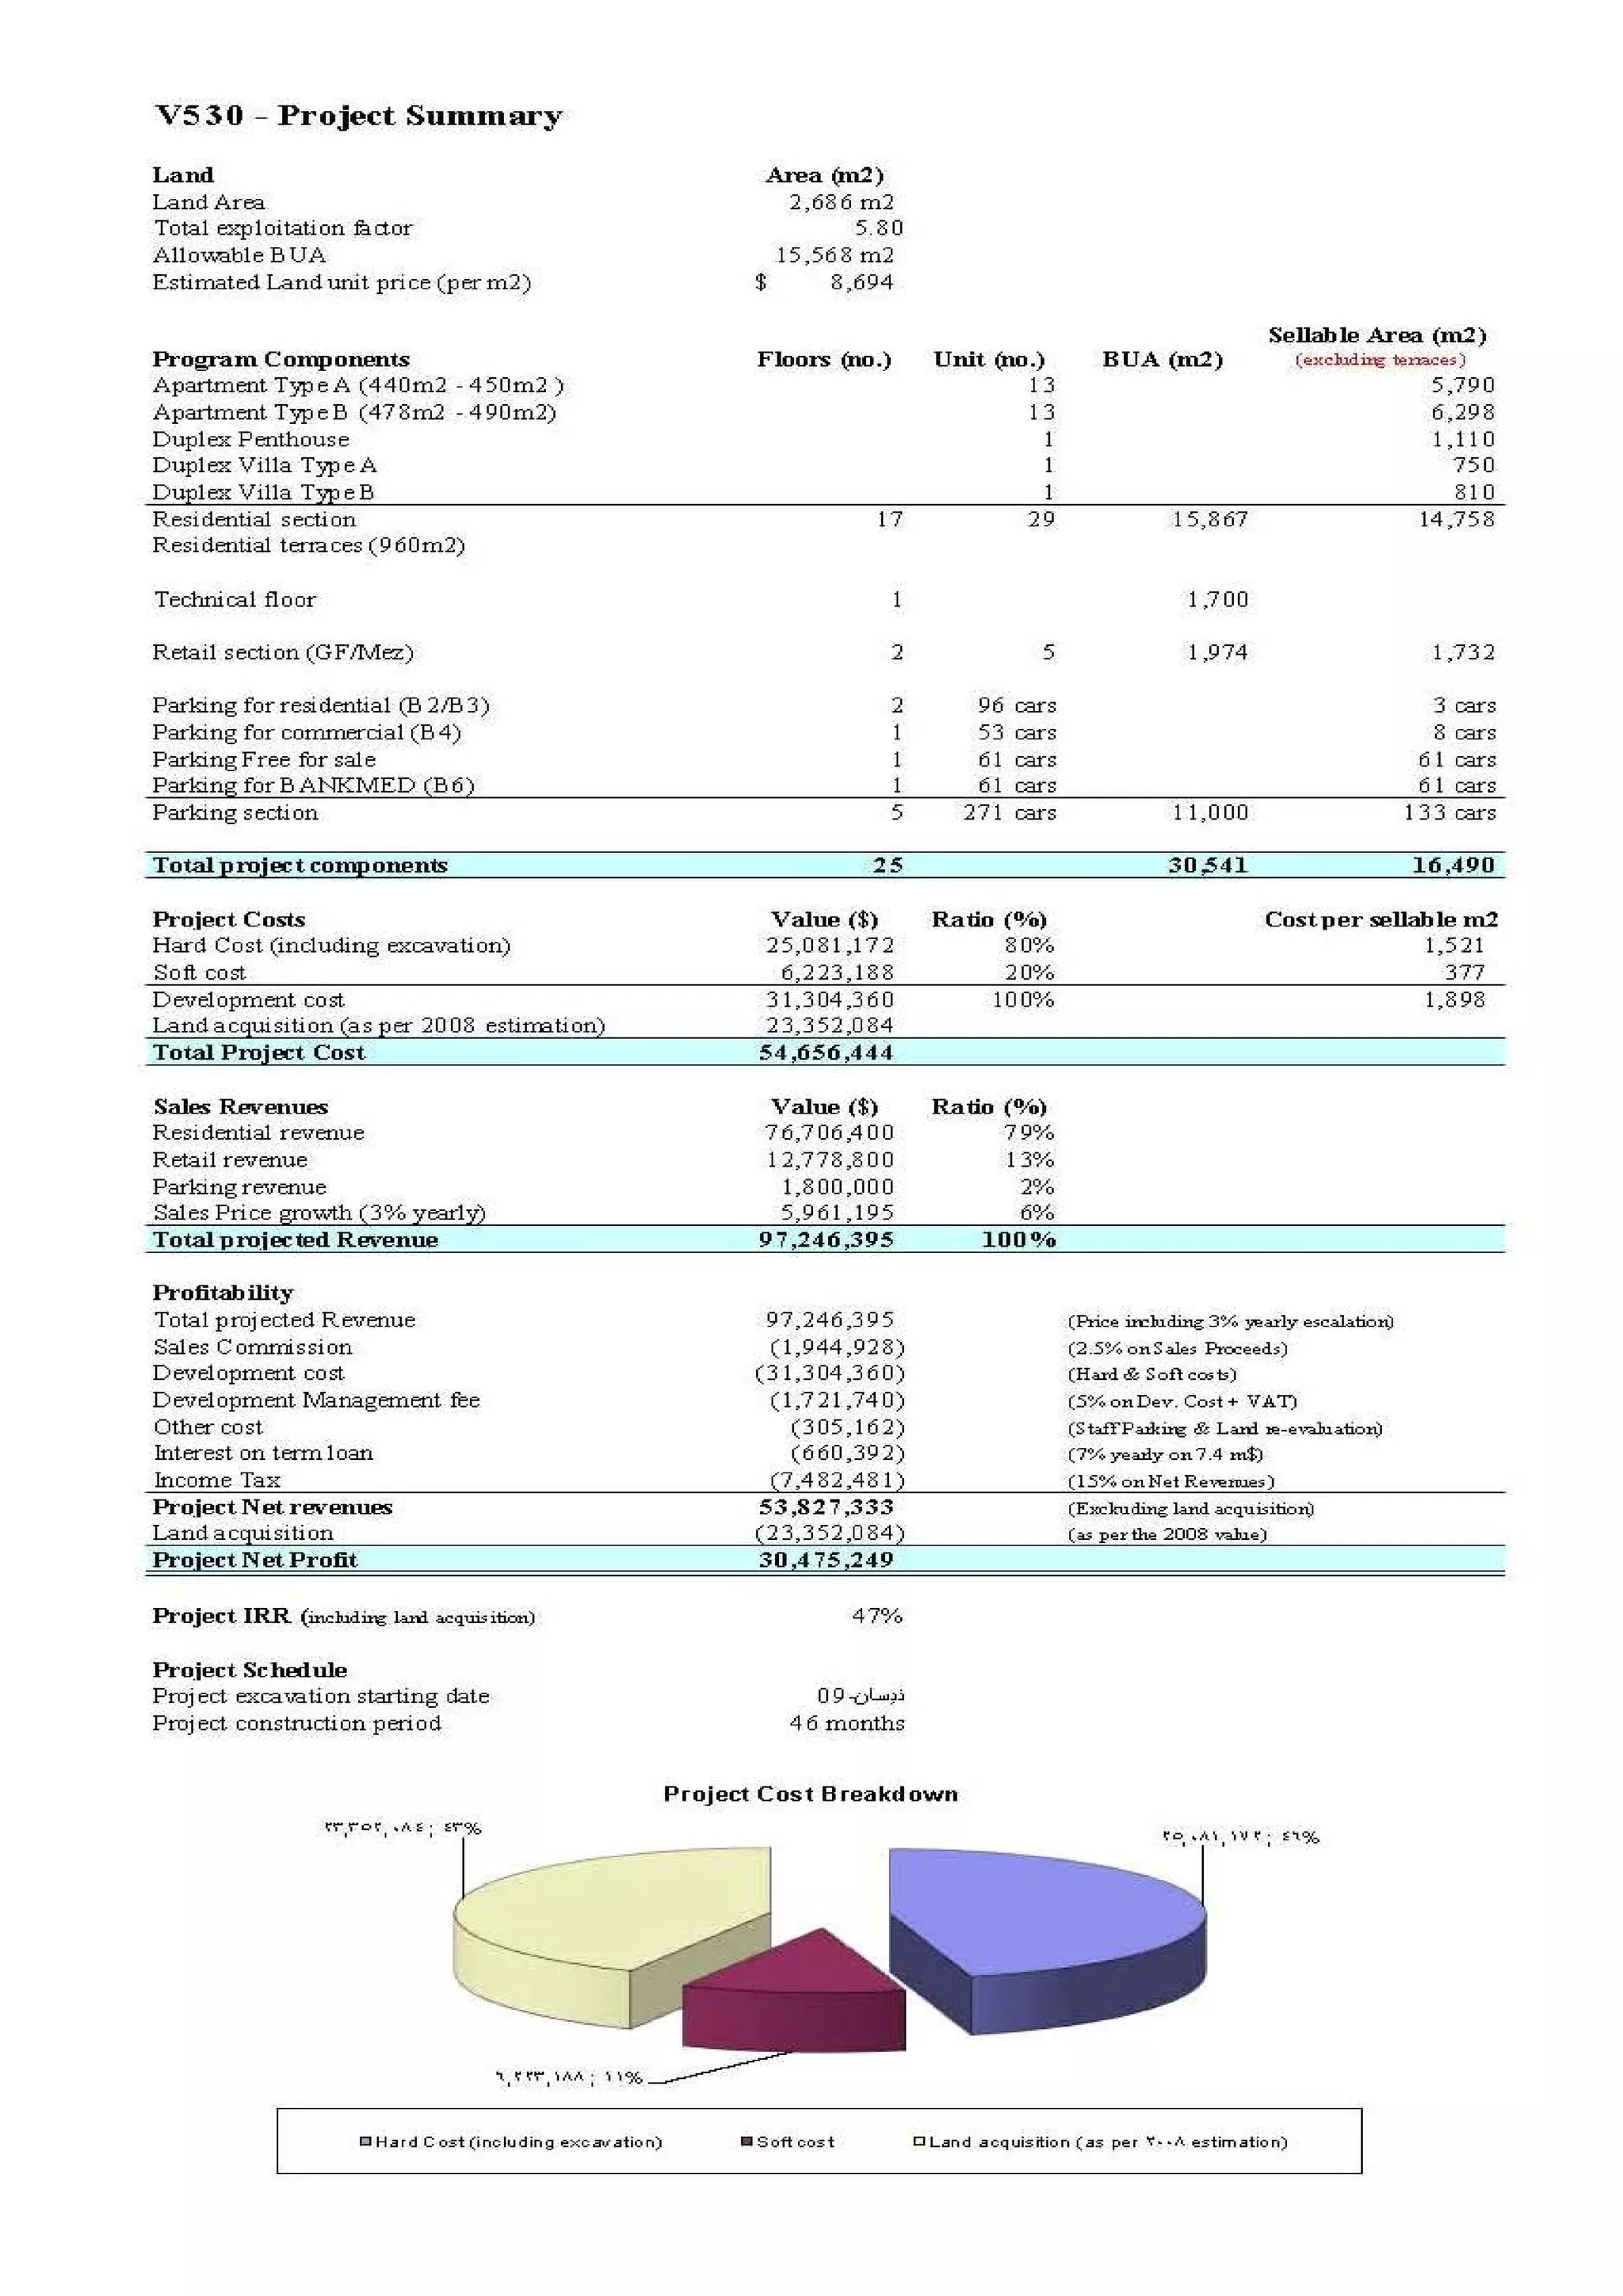
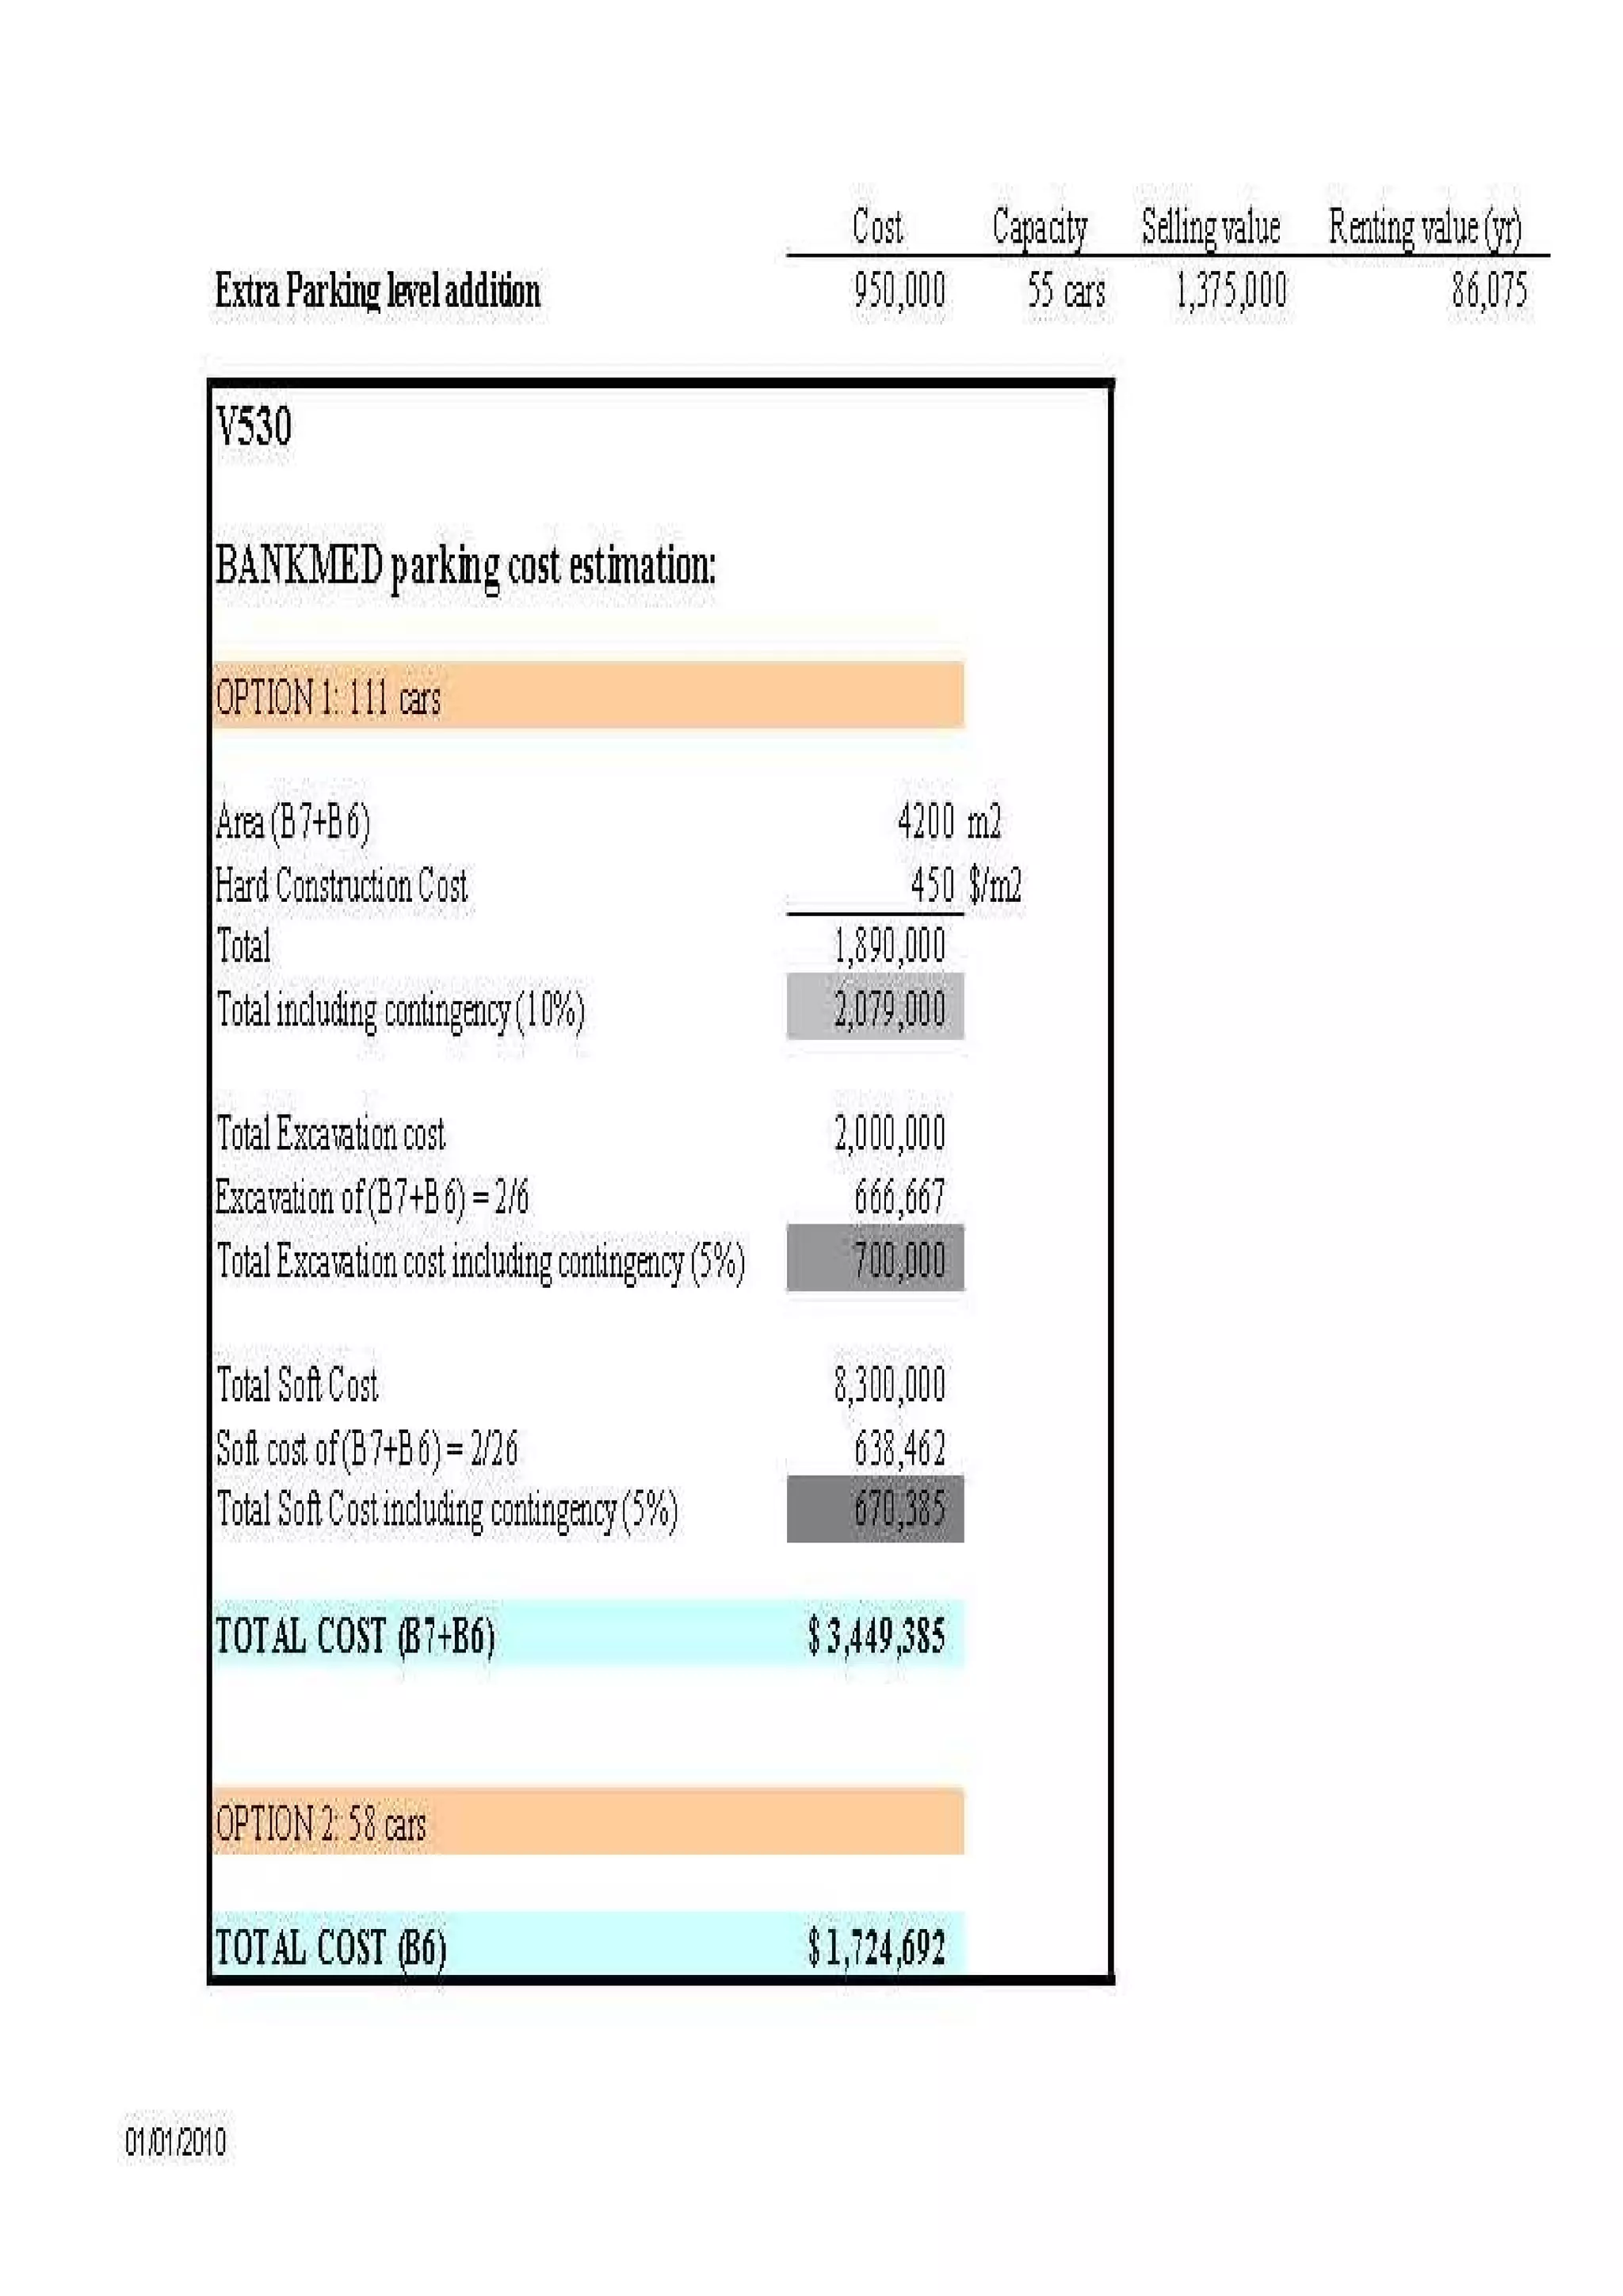
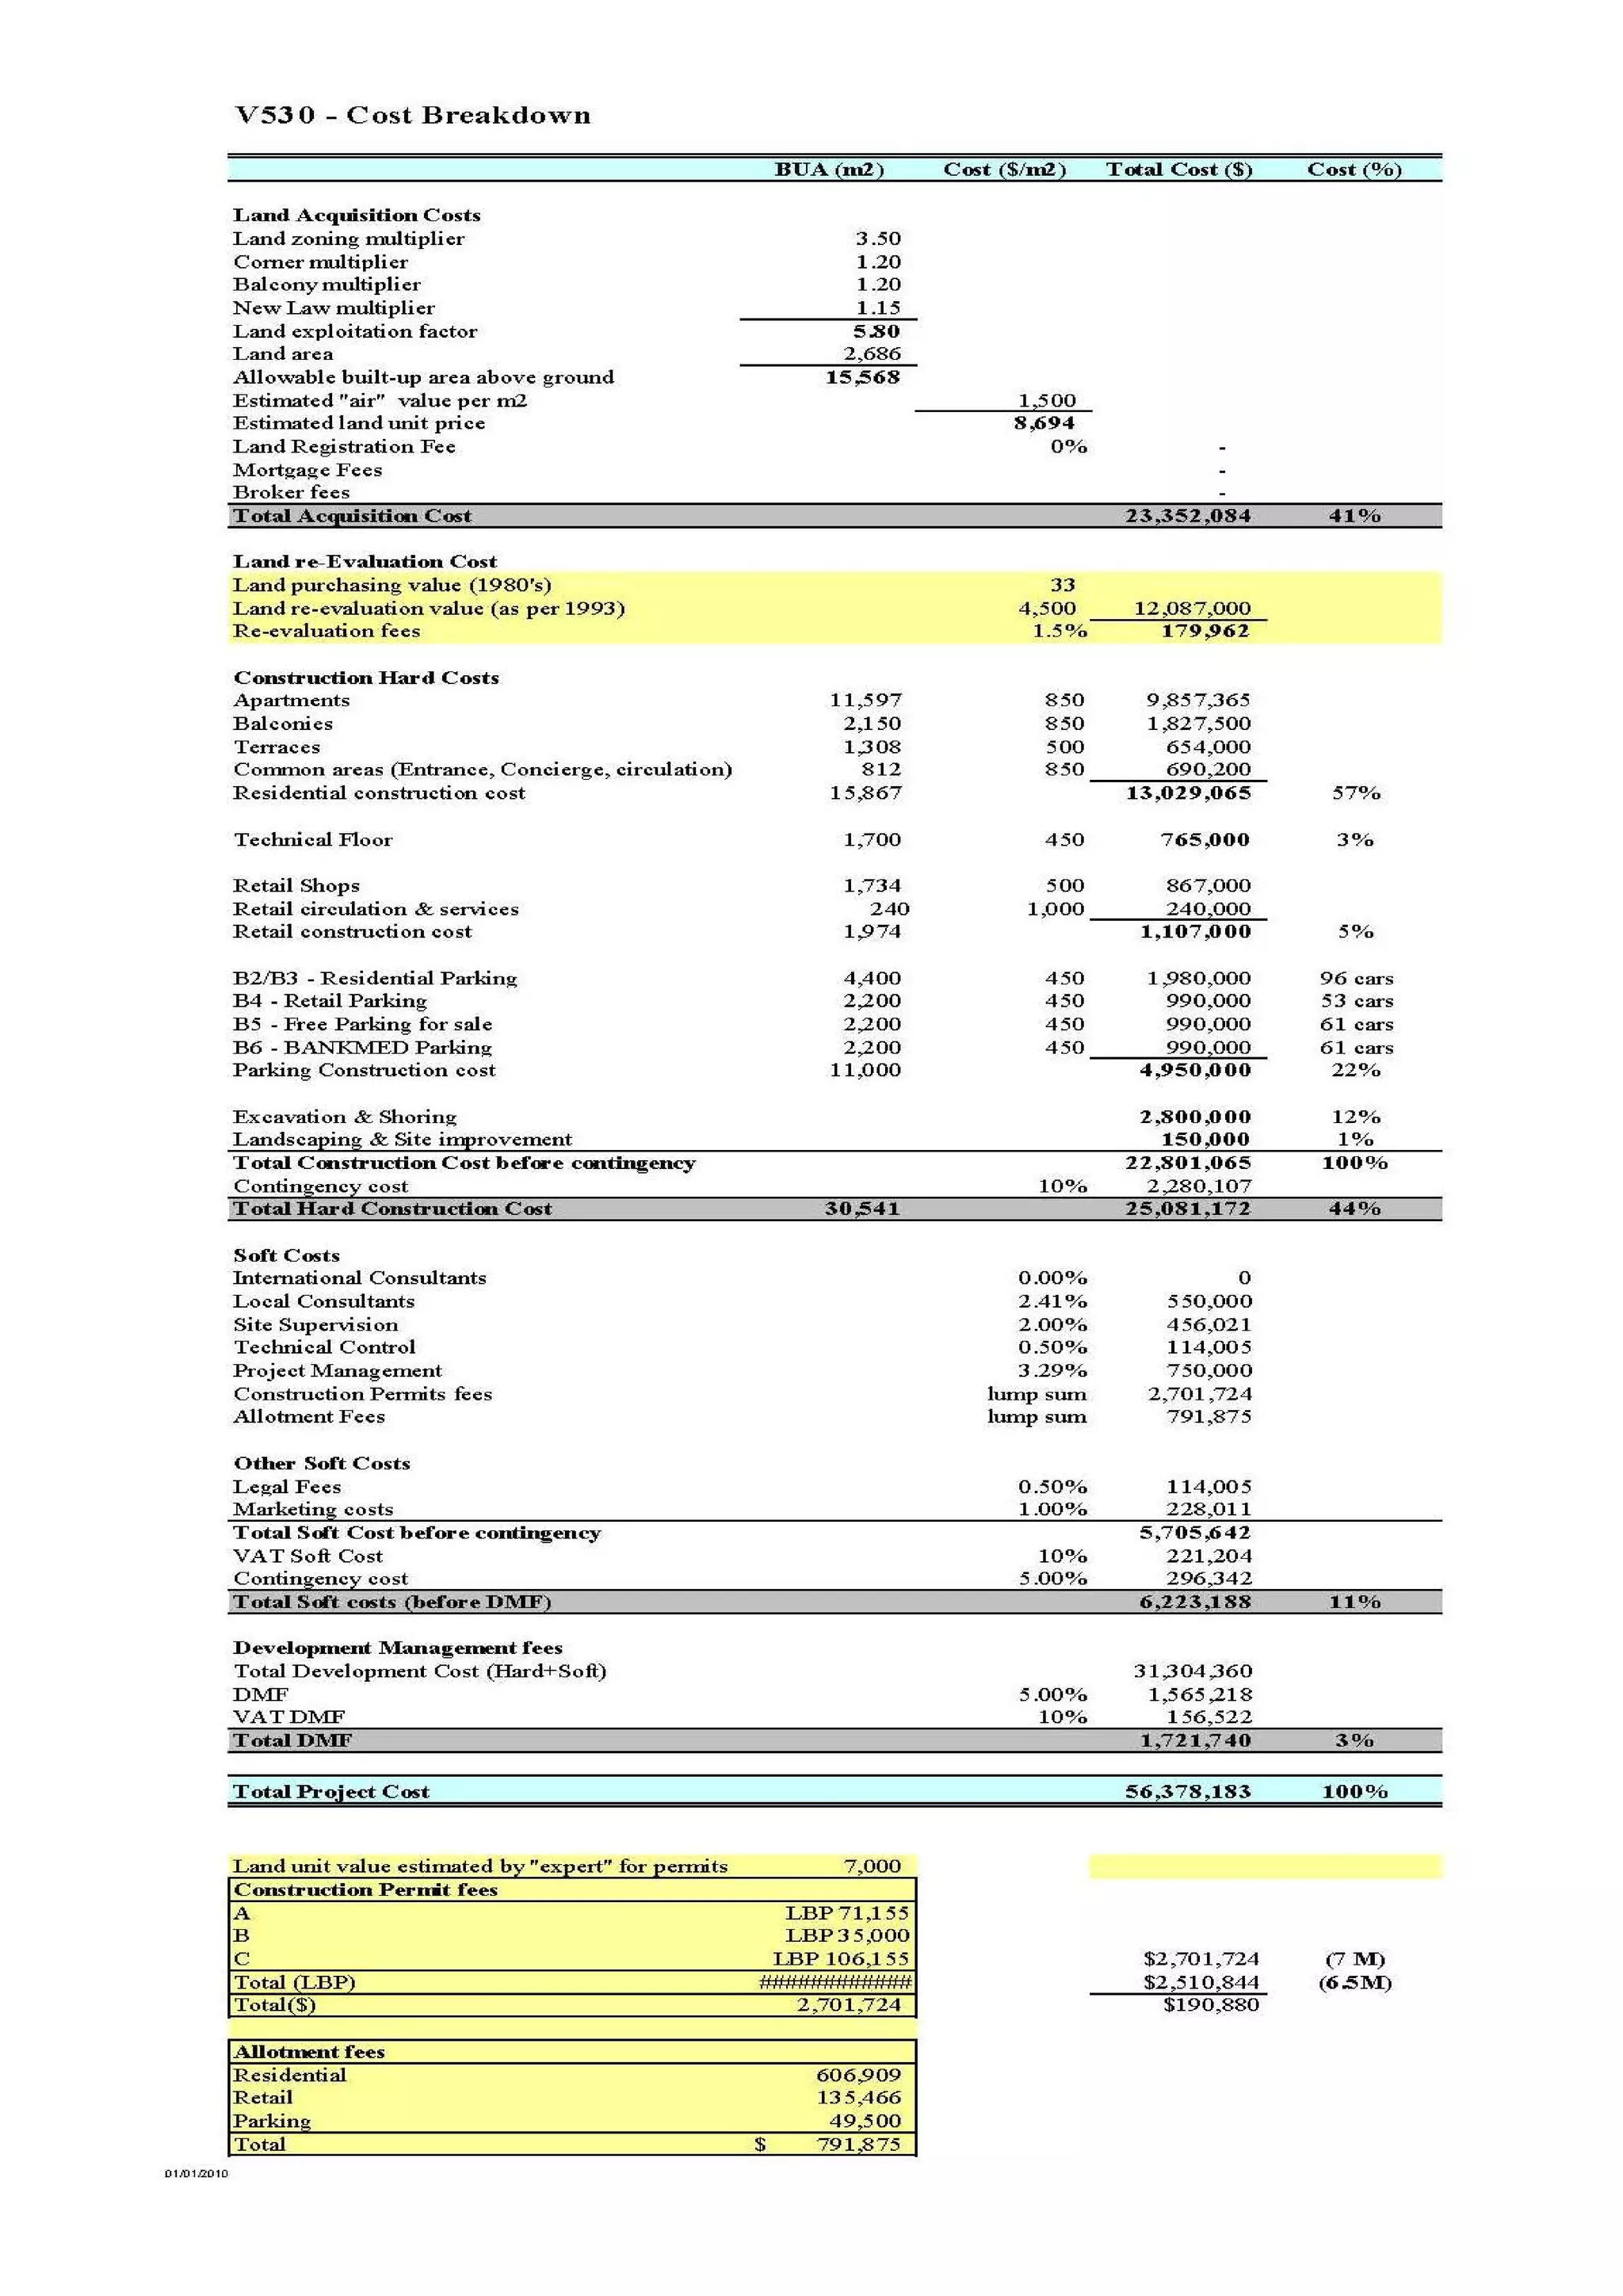
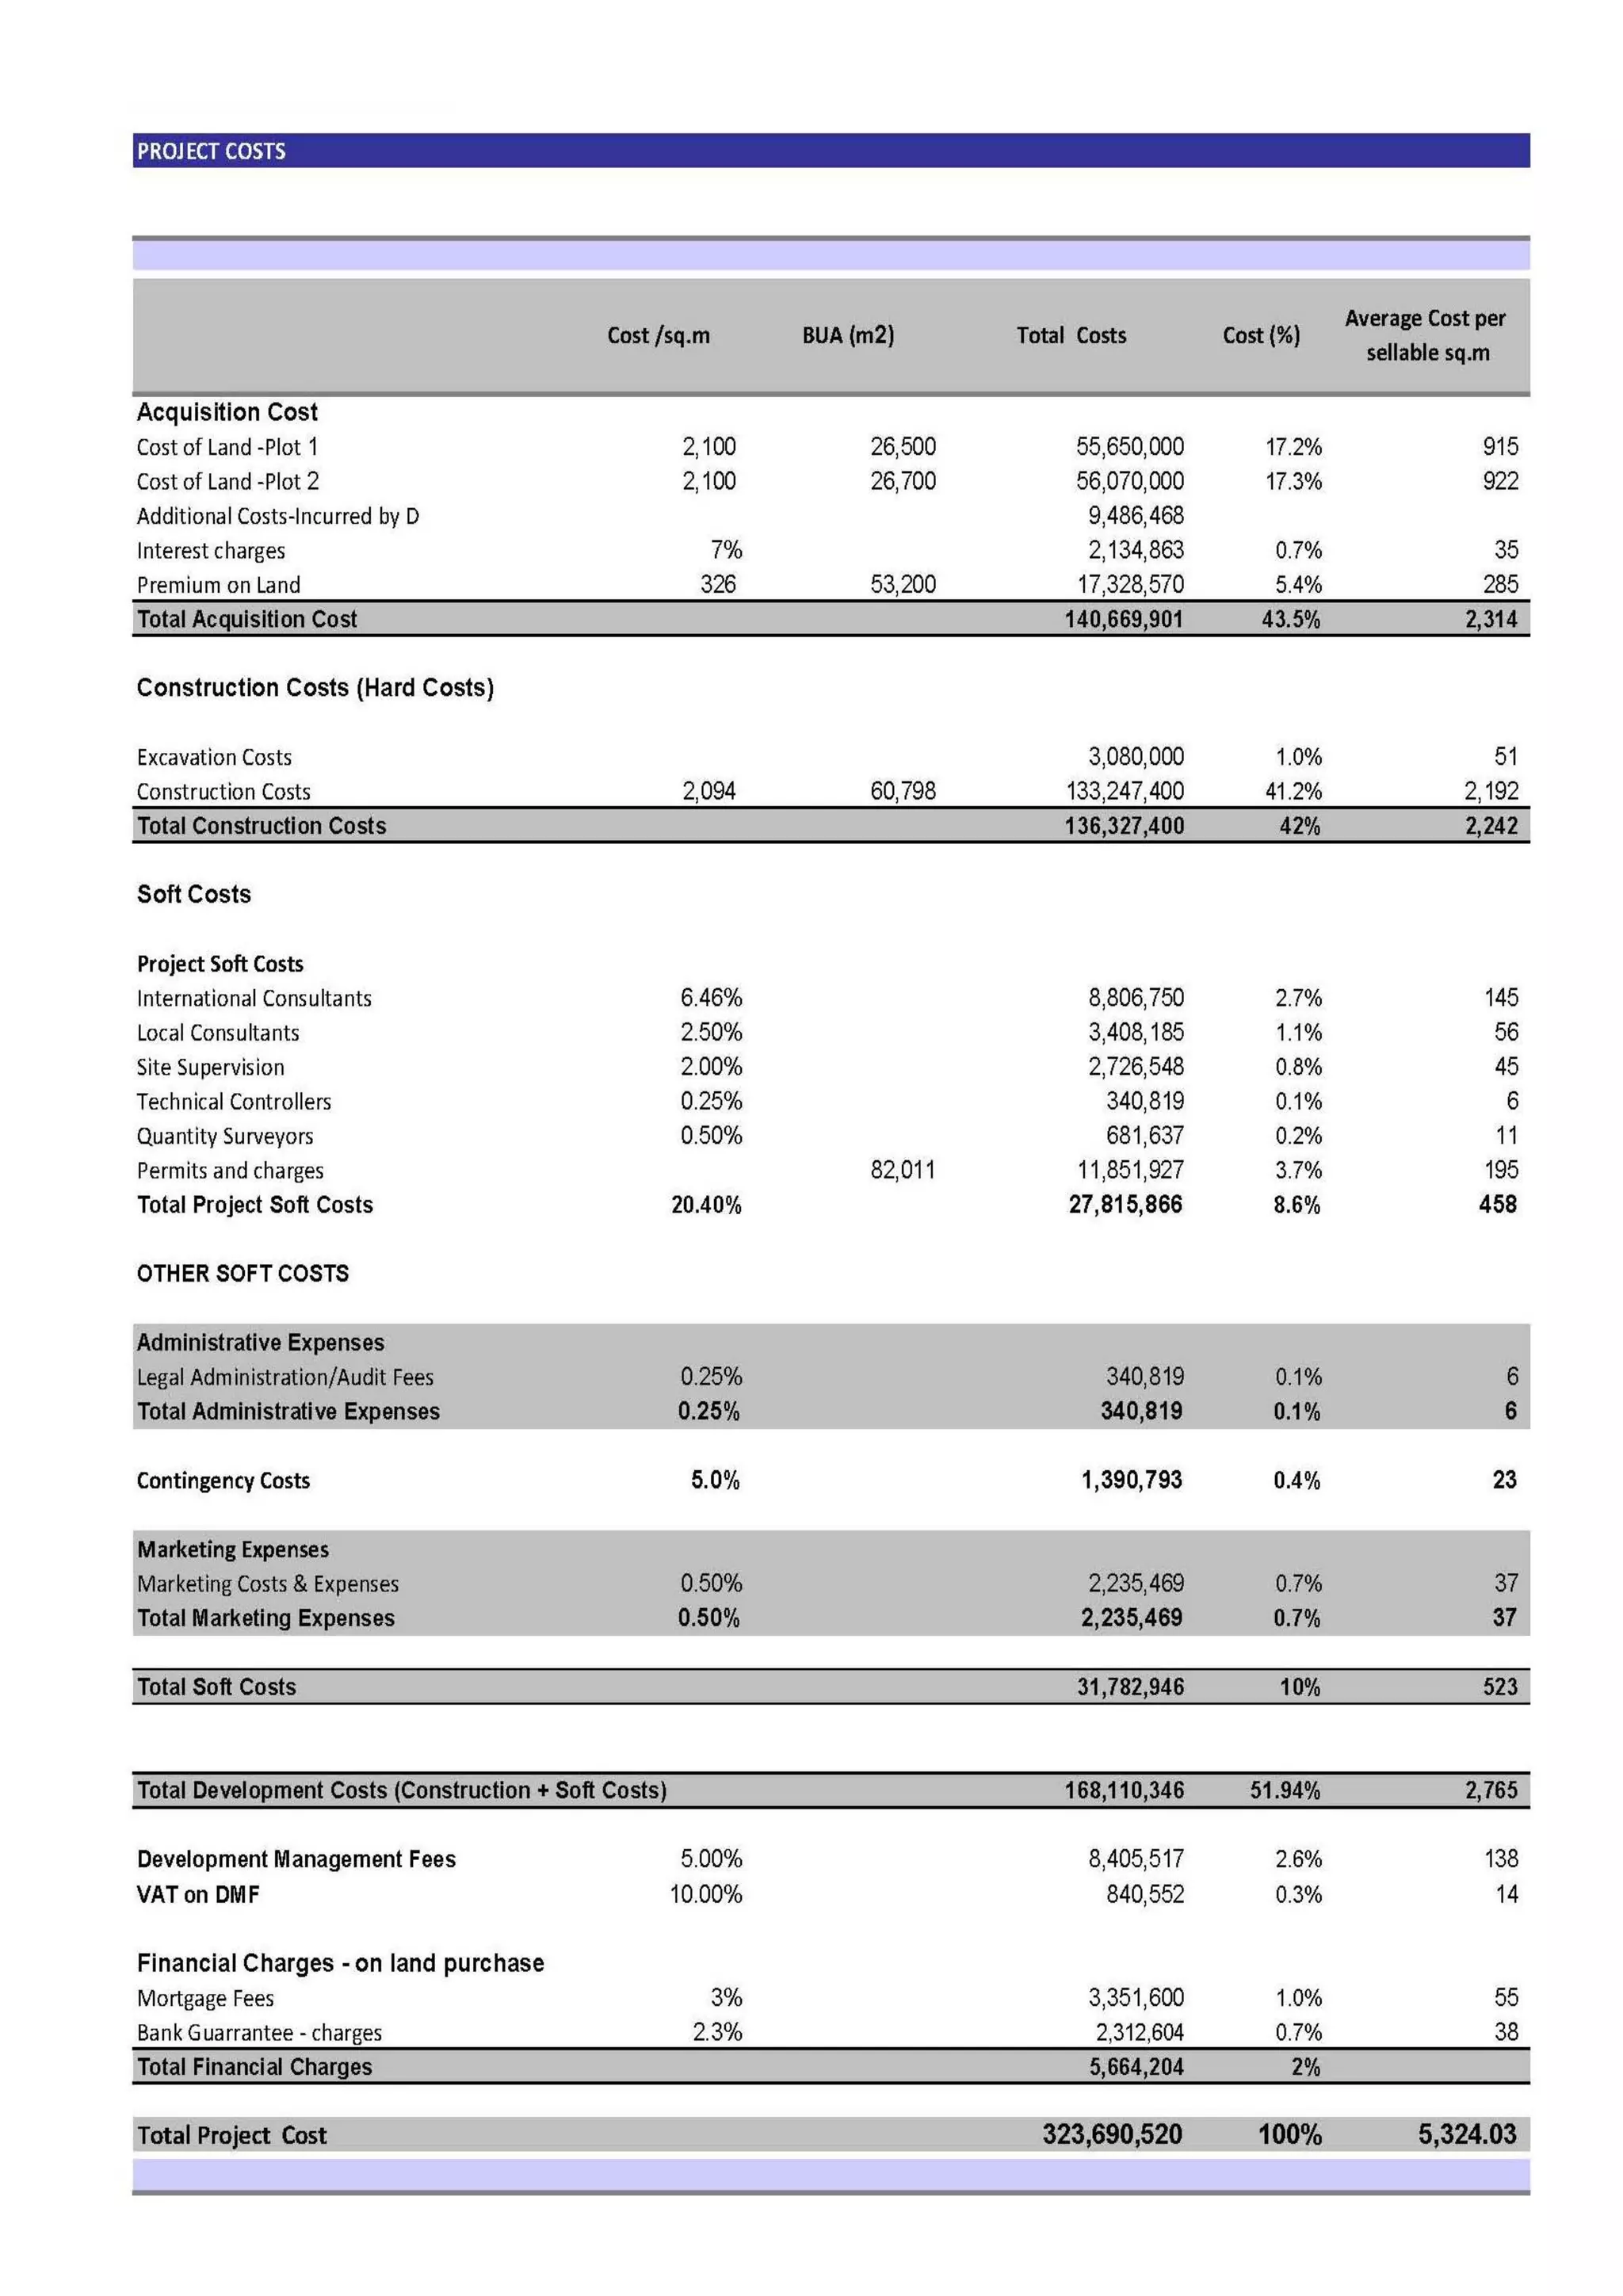
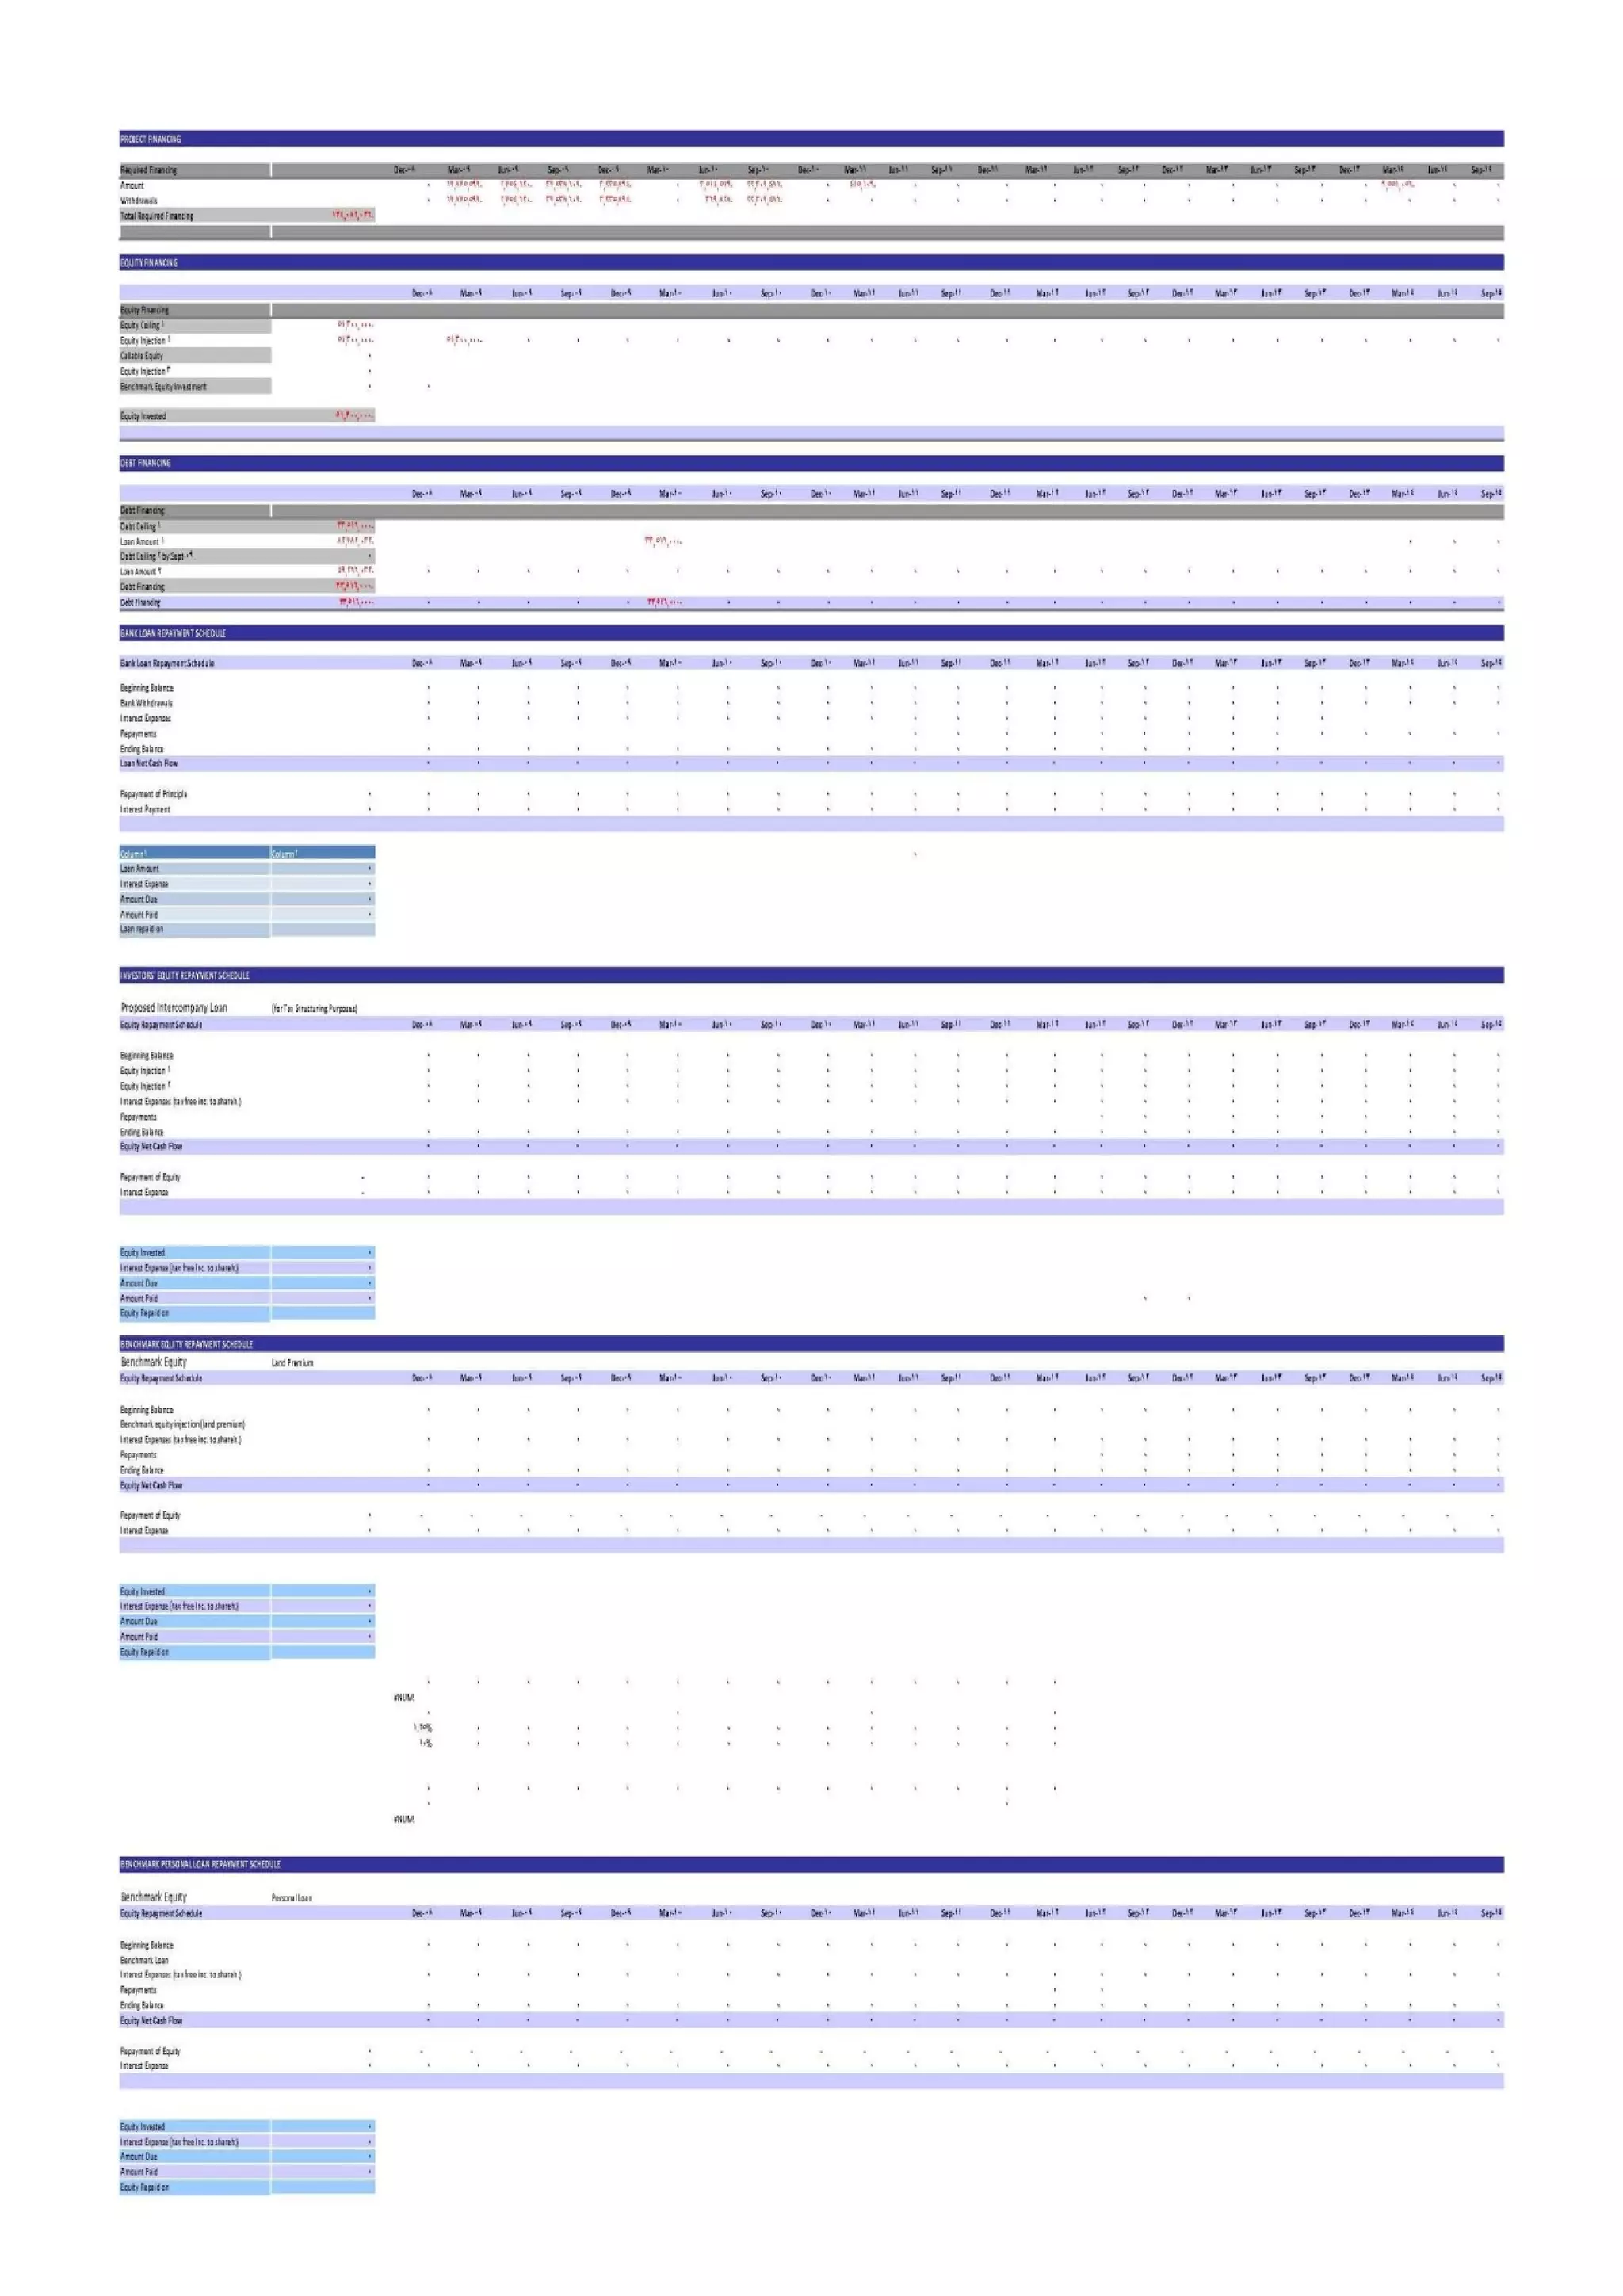
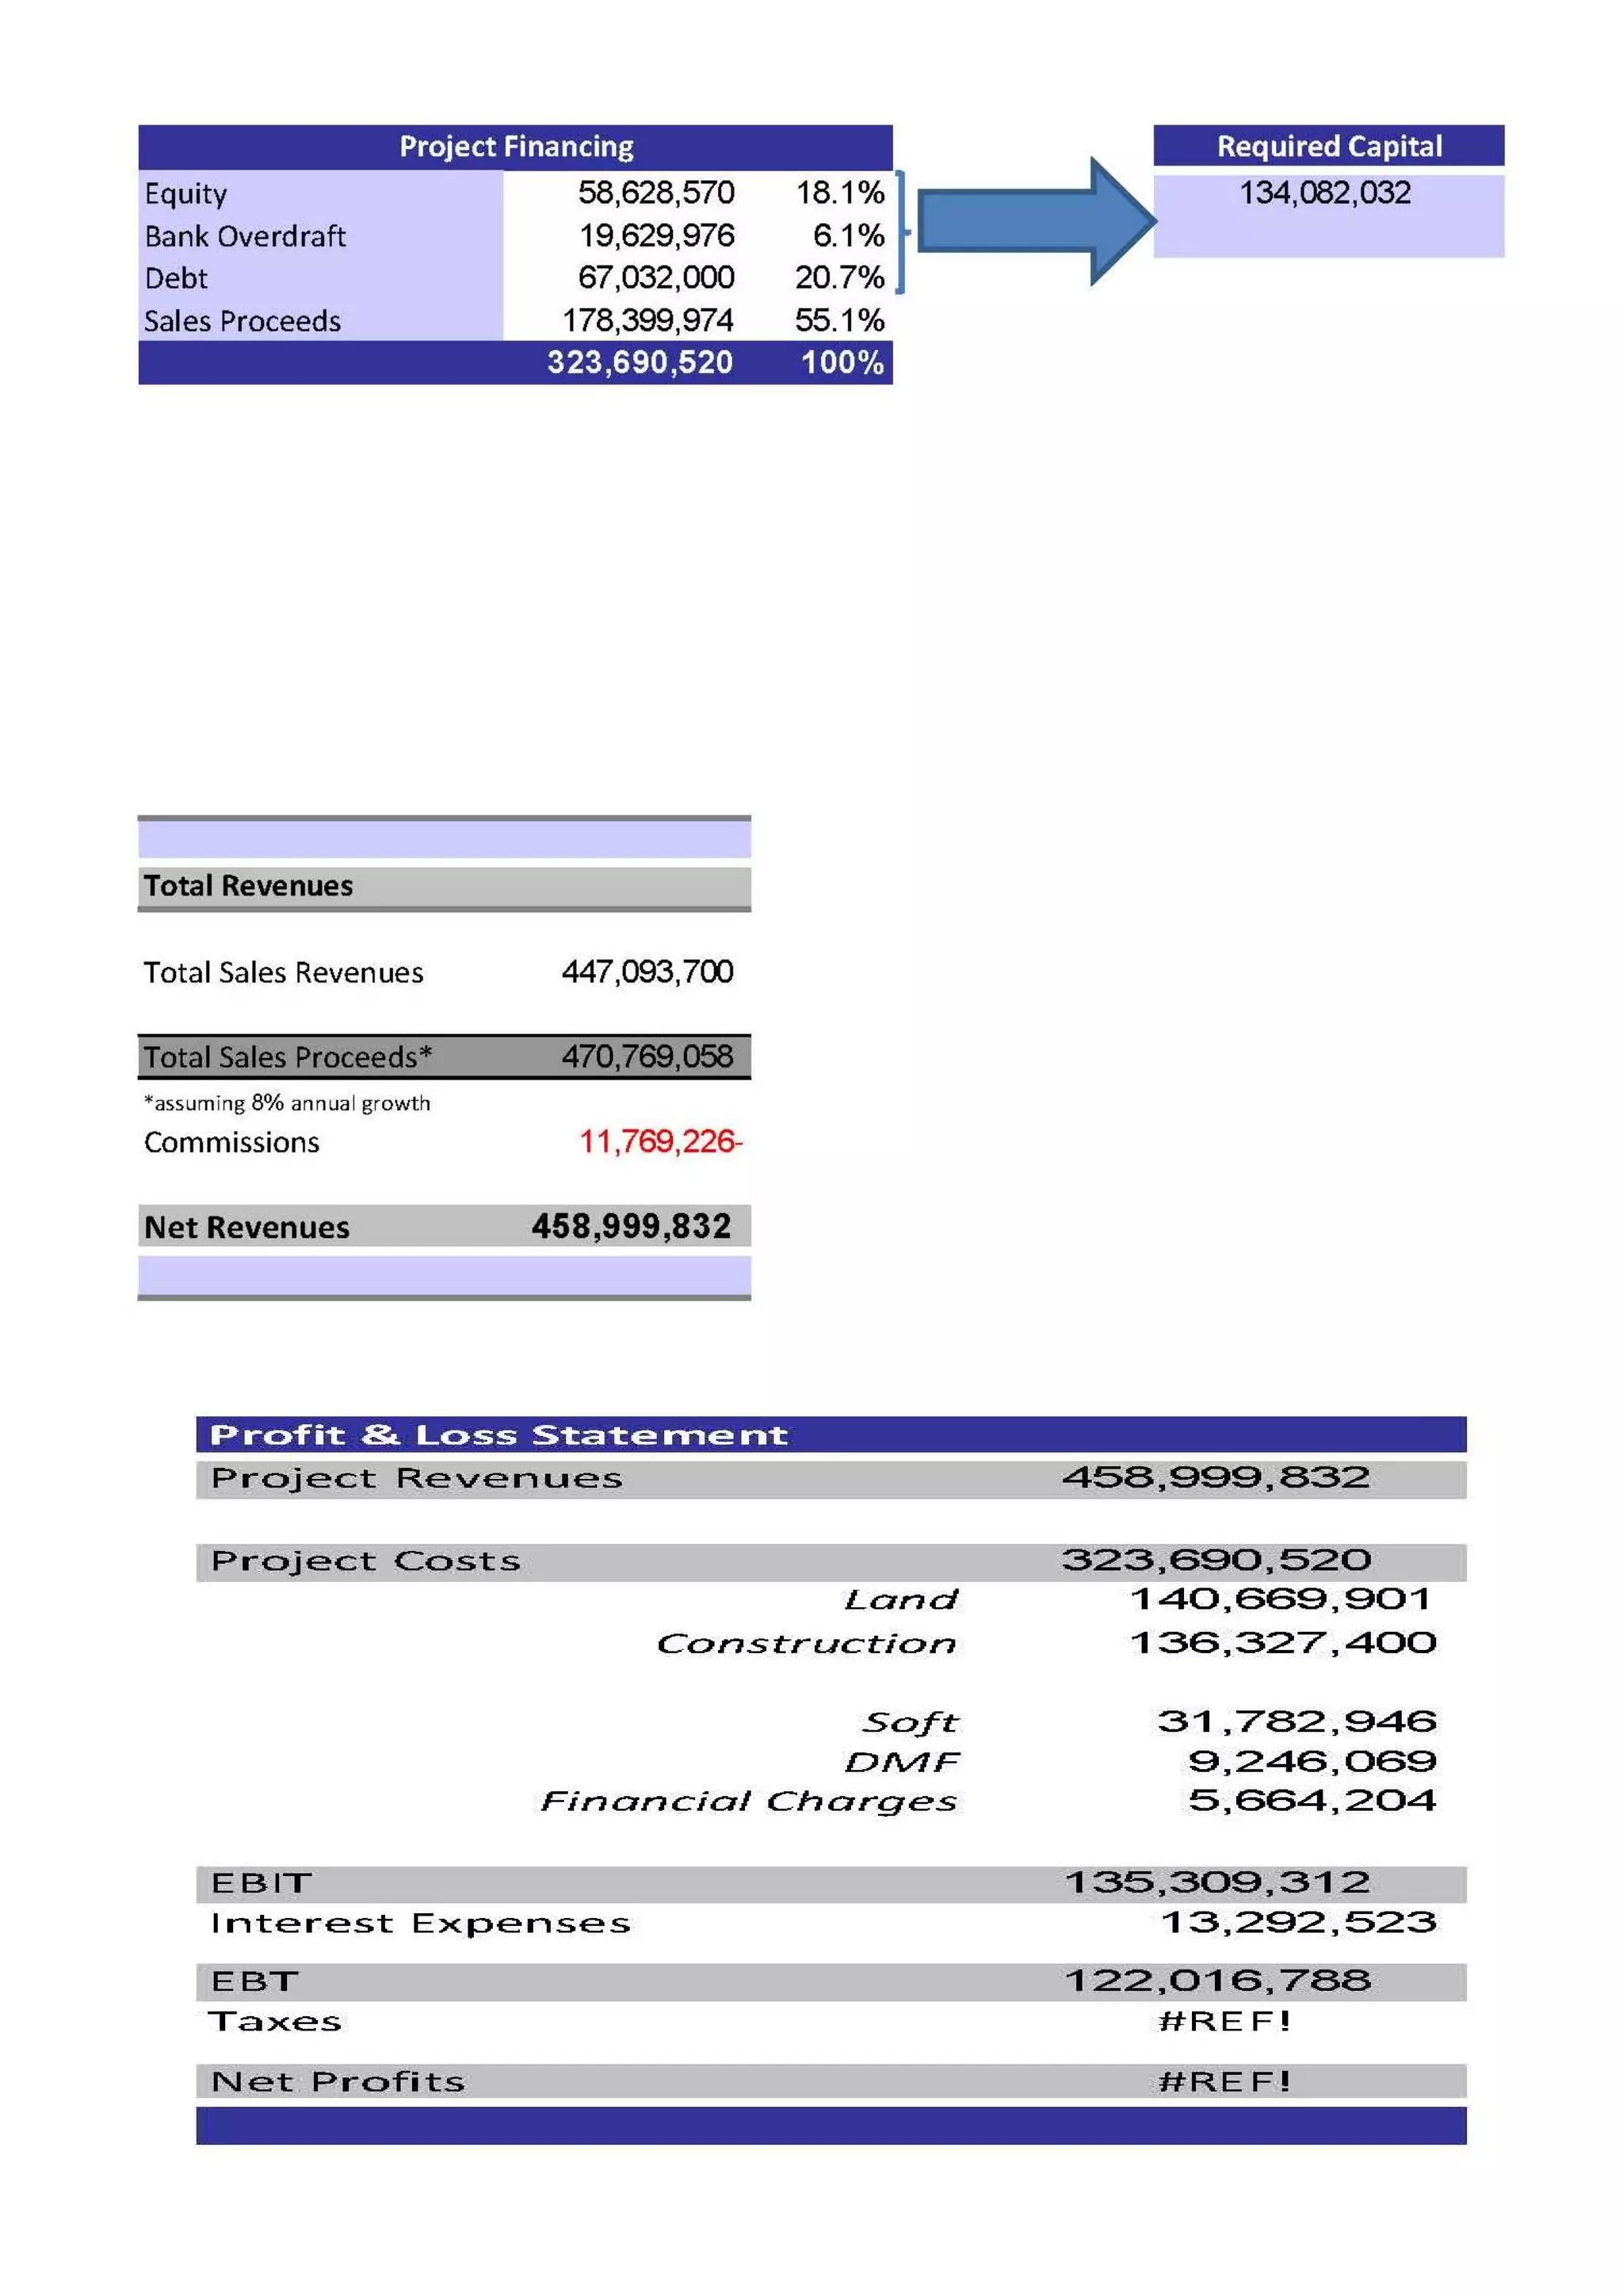
2) The total estimated project cost is over $10 million, including $5 million for the land cost, $4 million in construction costs, and $1 million in soft costs like permits and marketing.
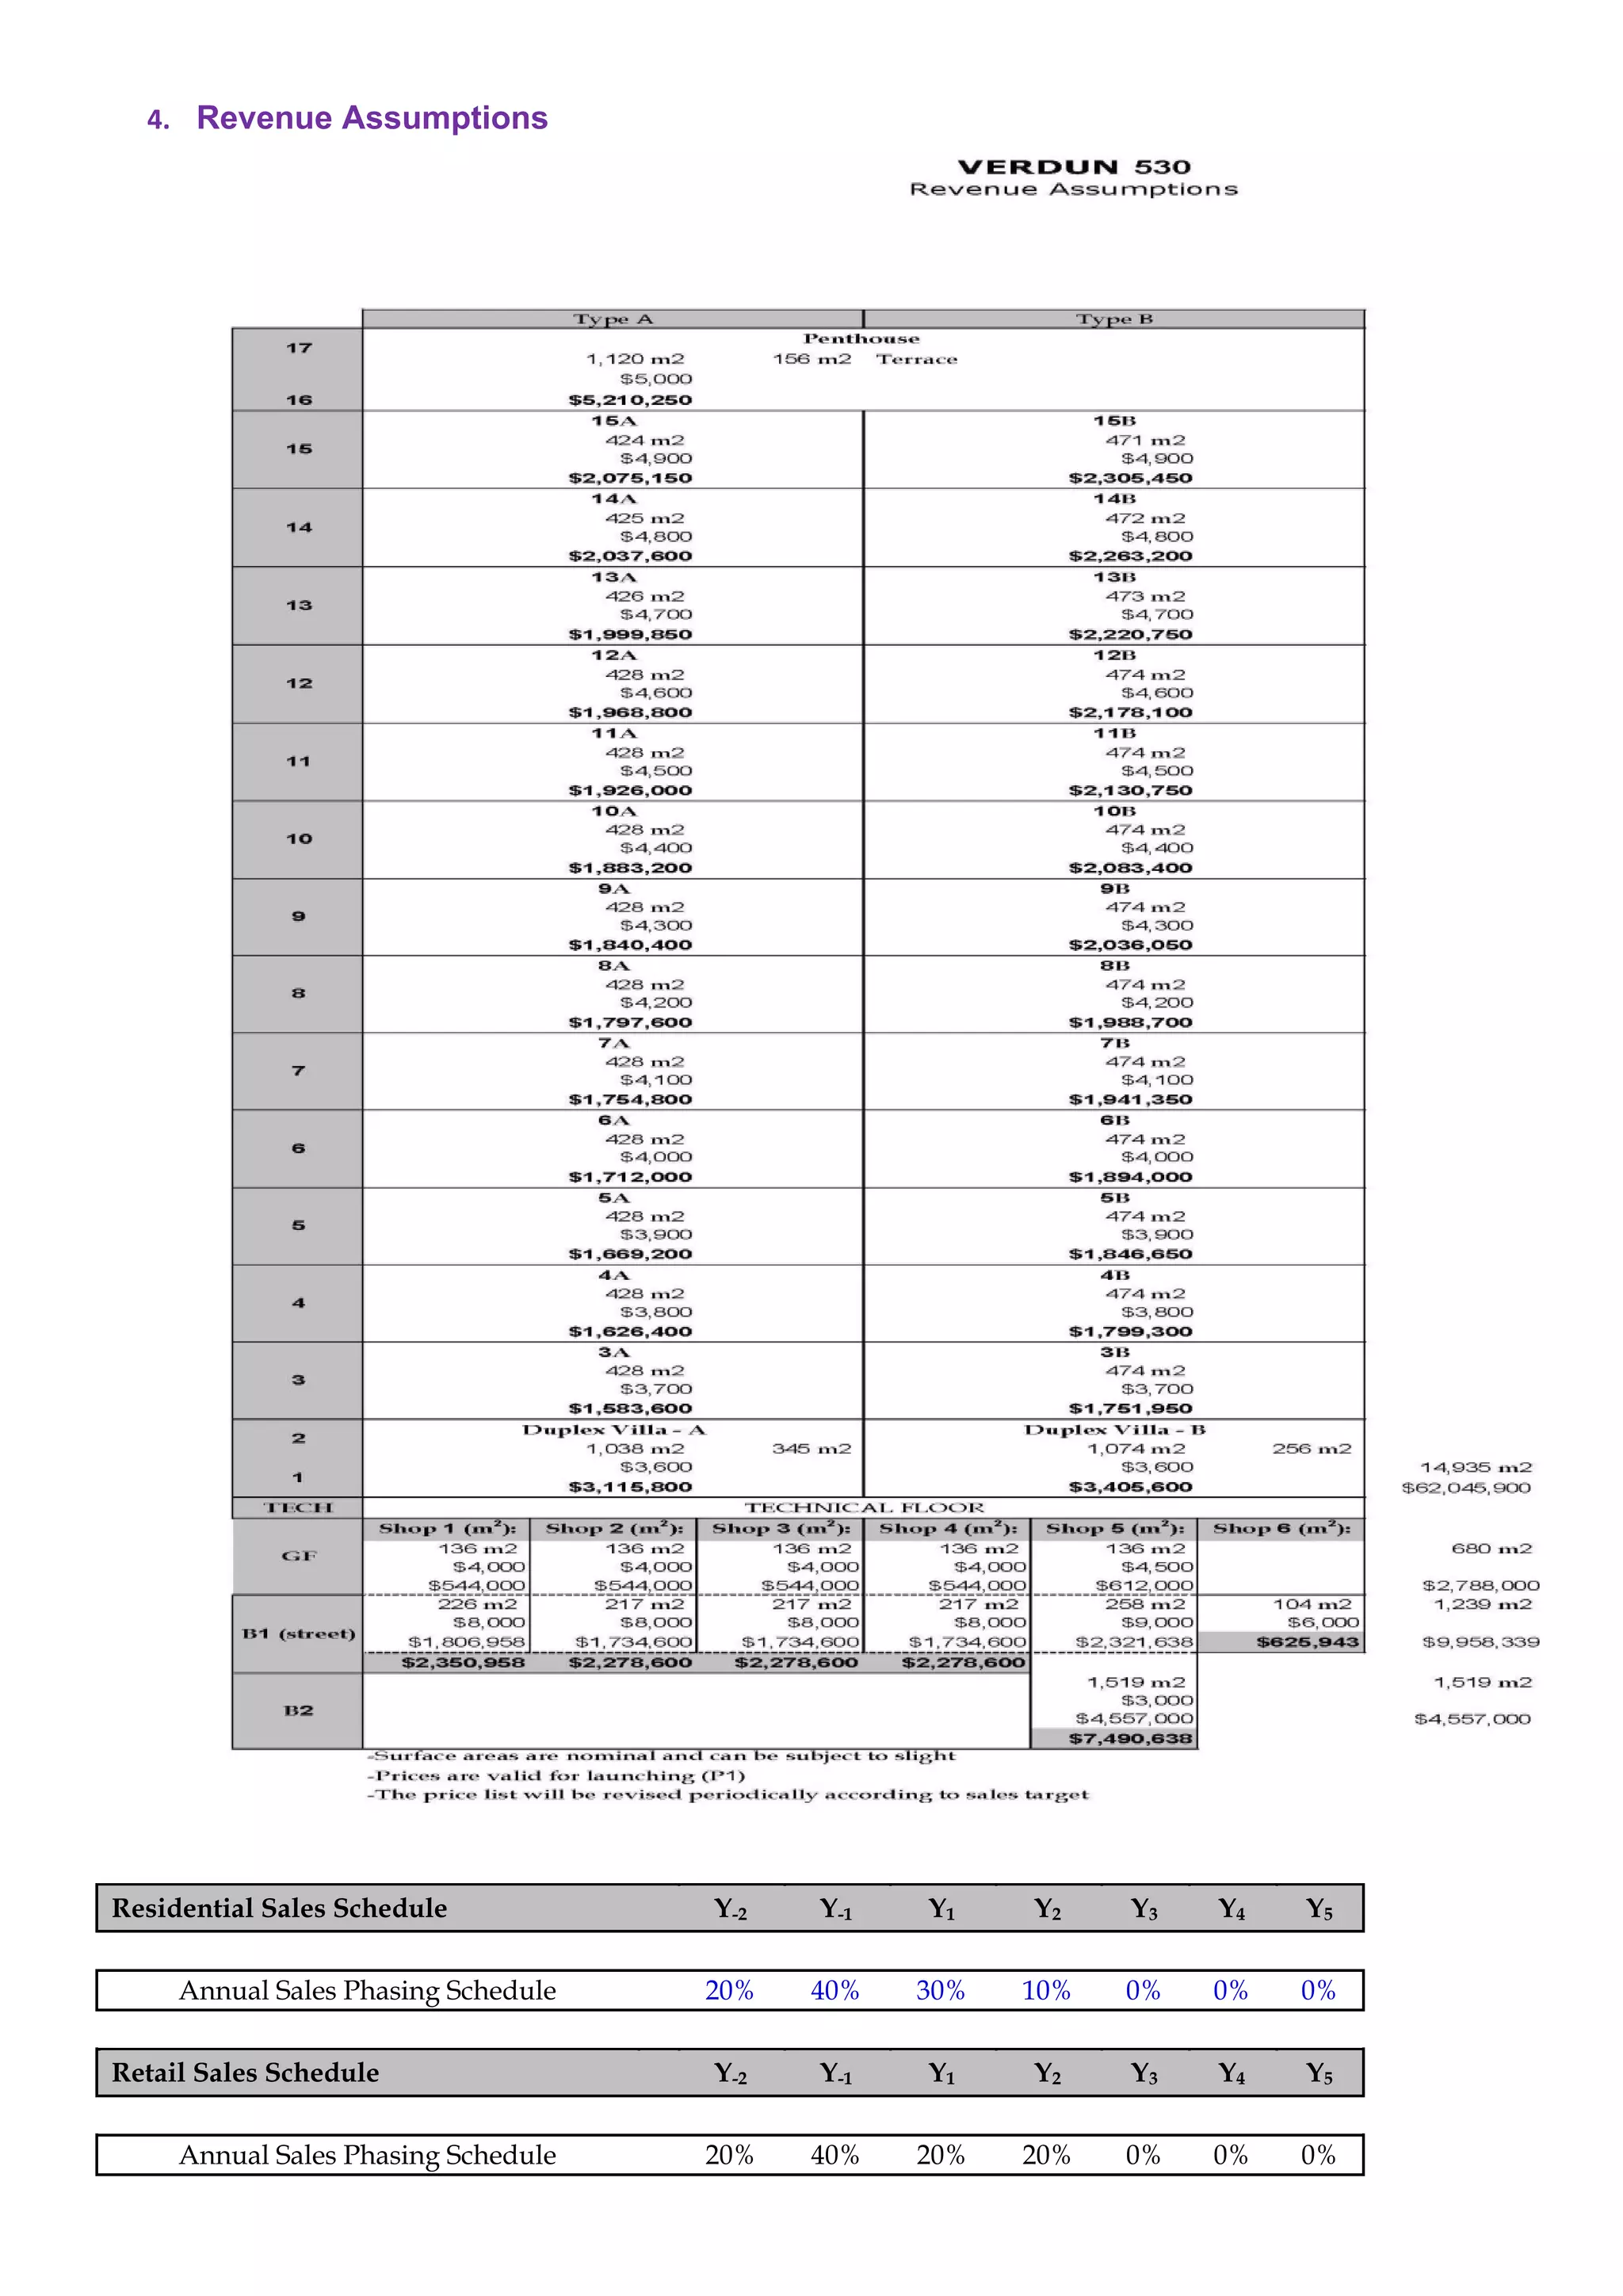
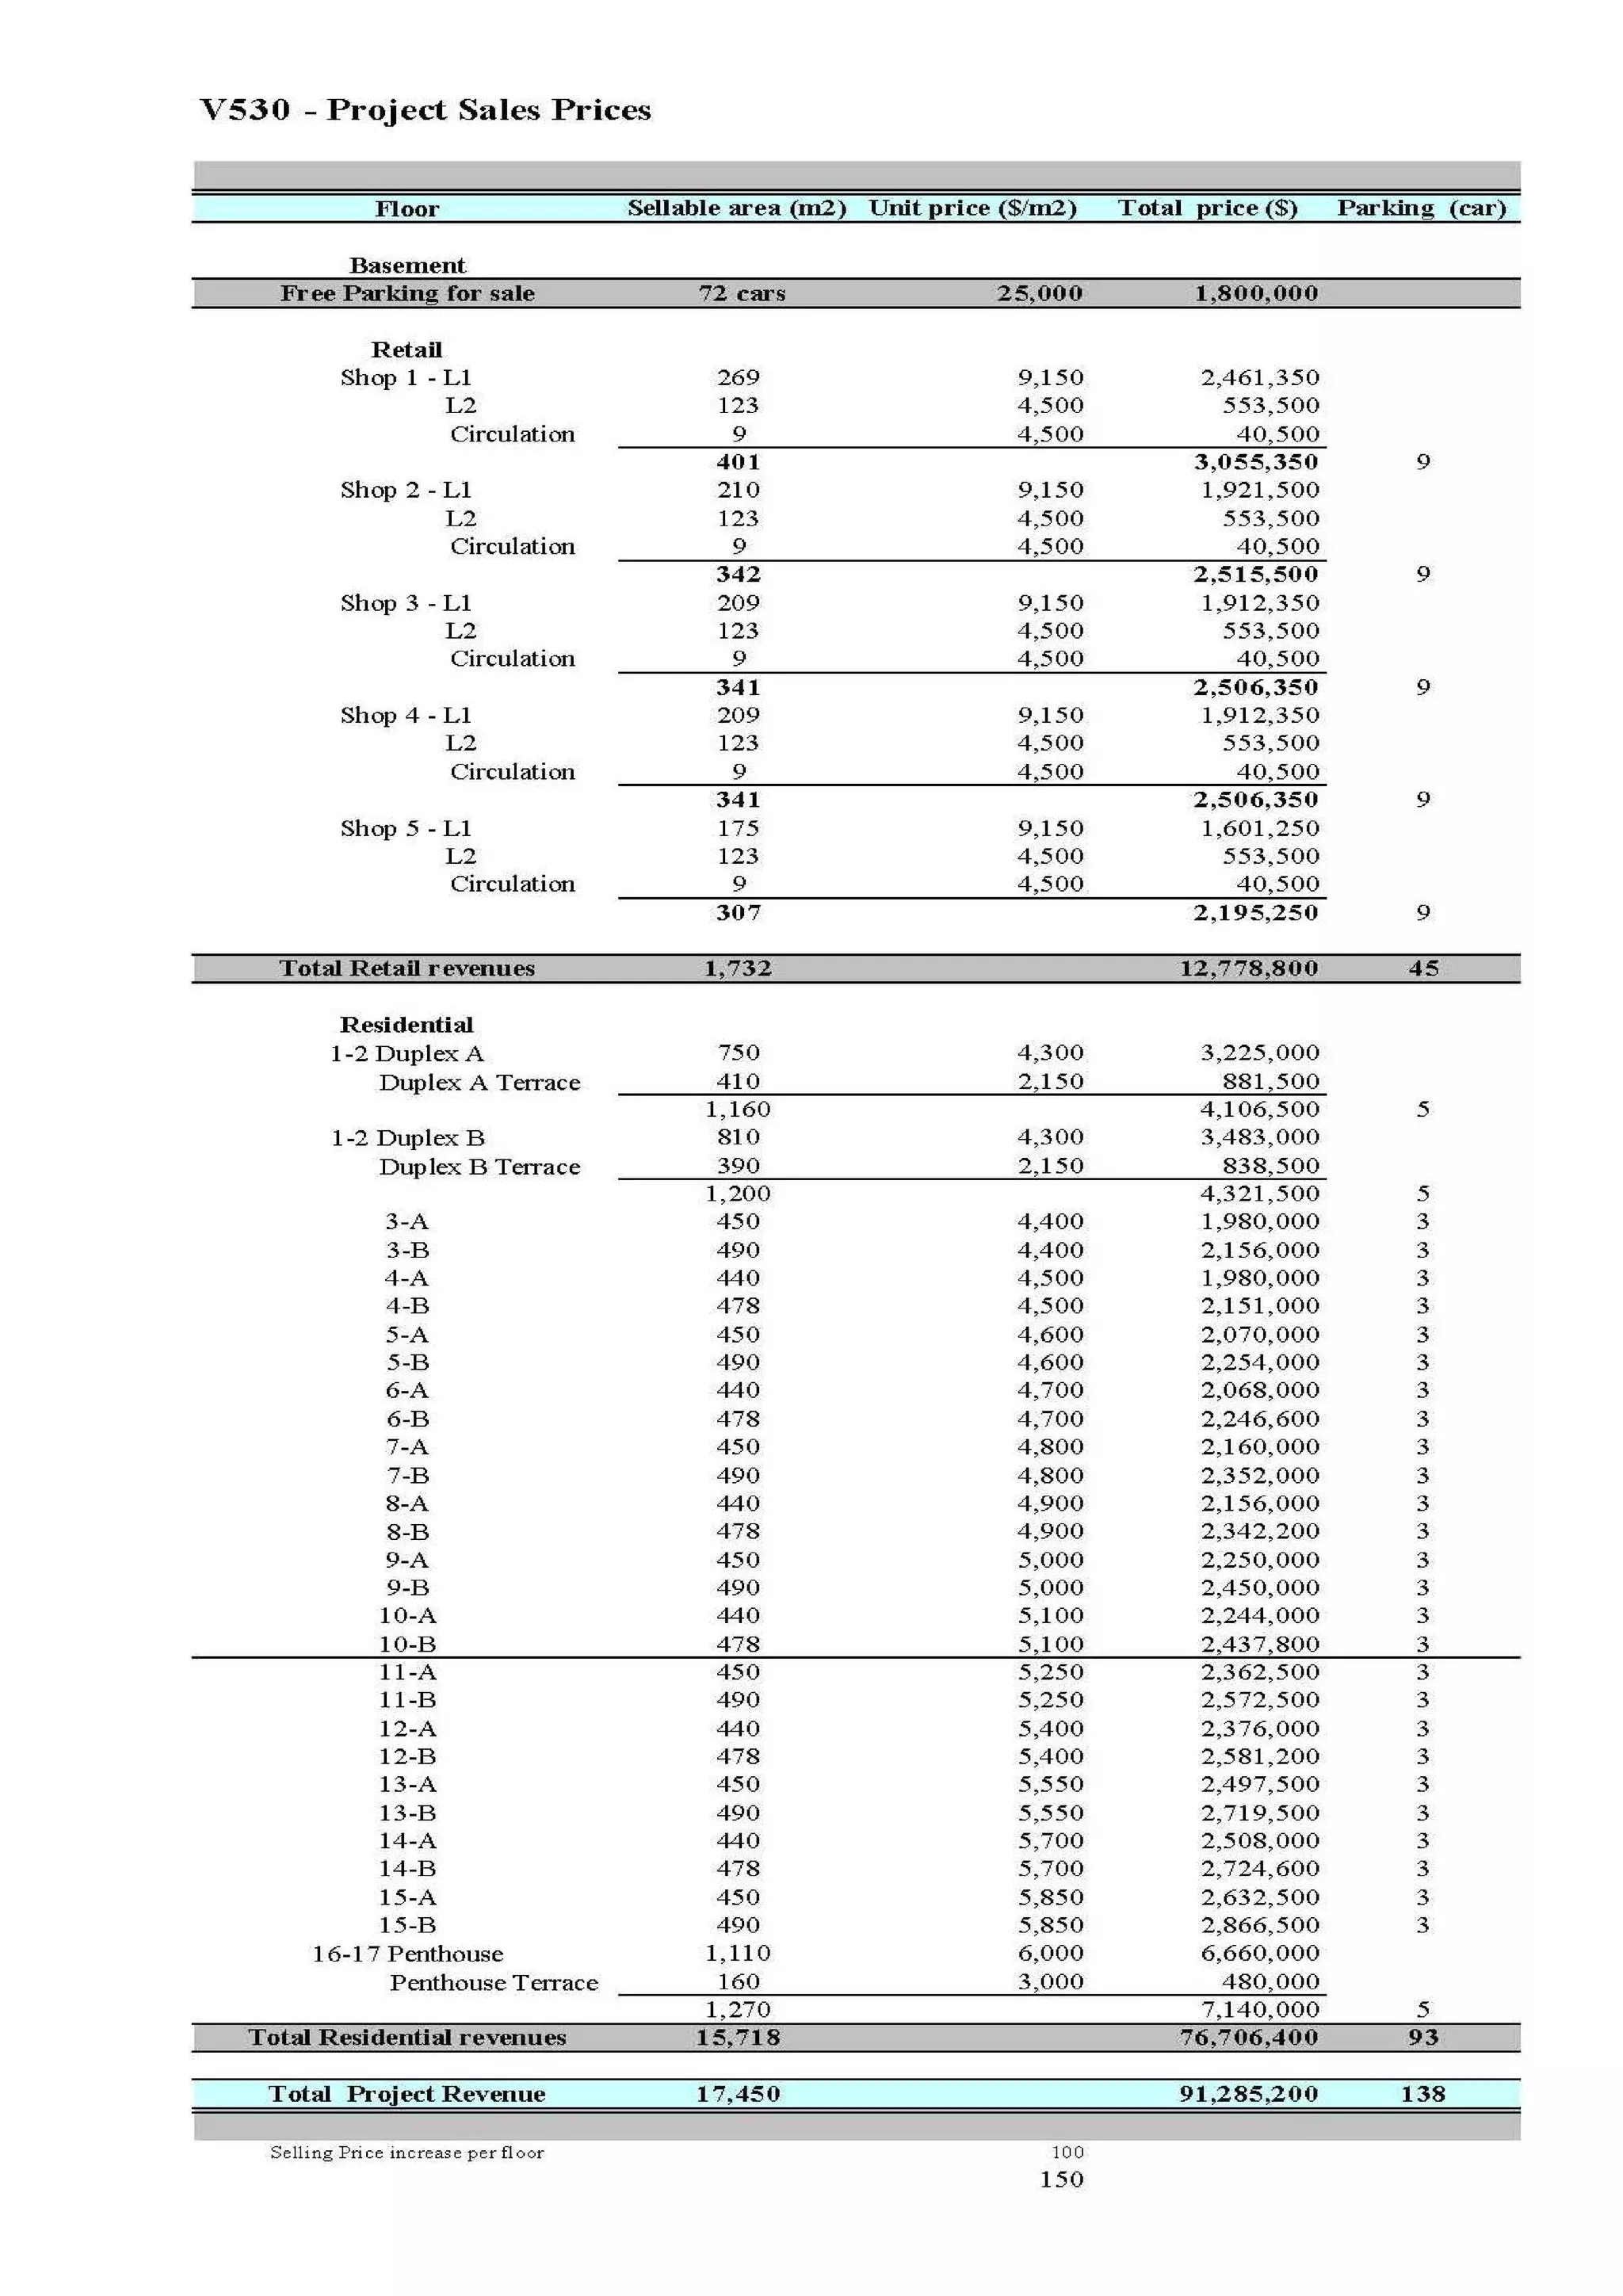
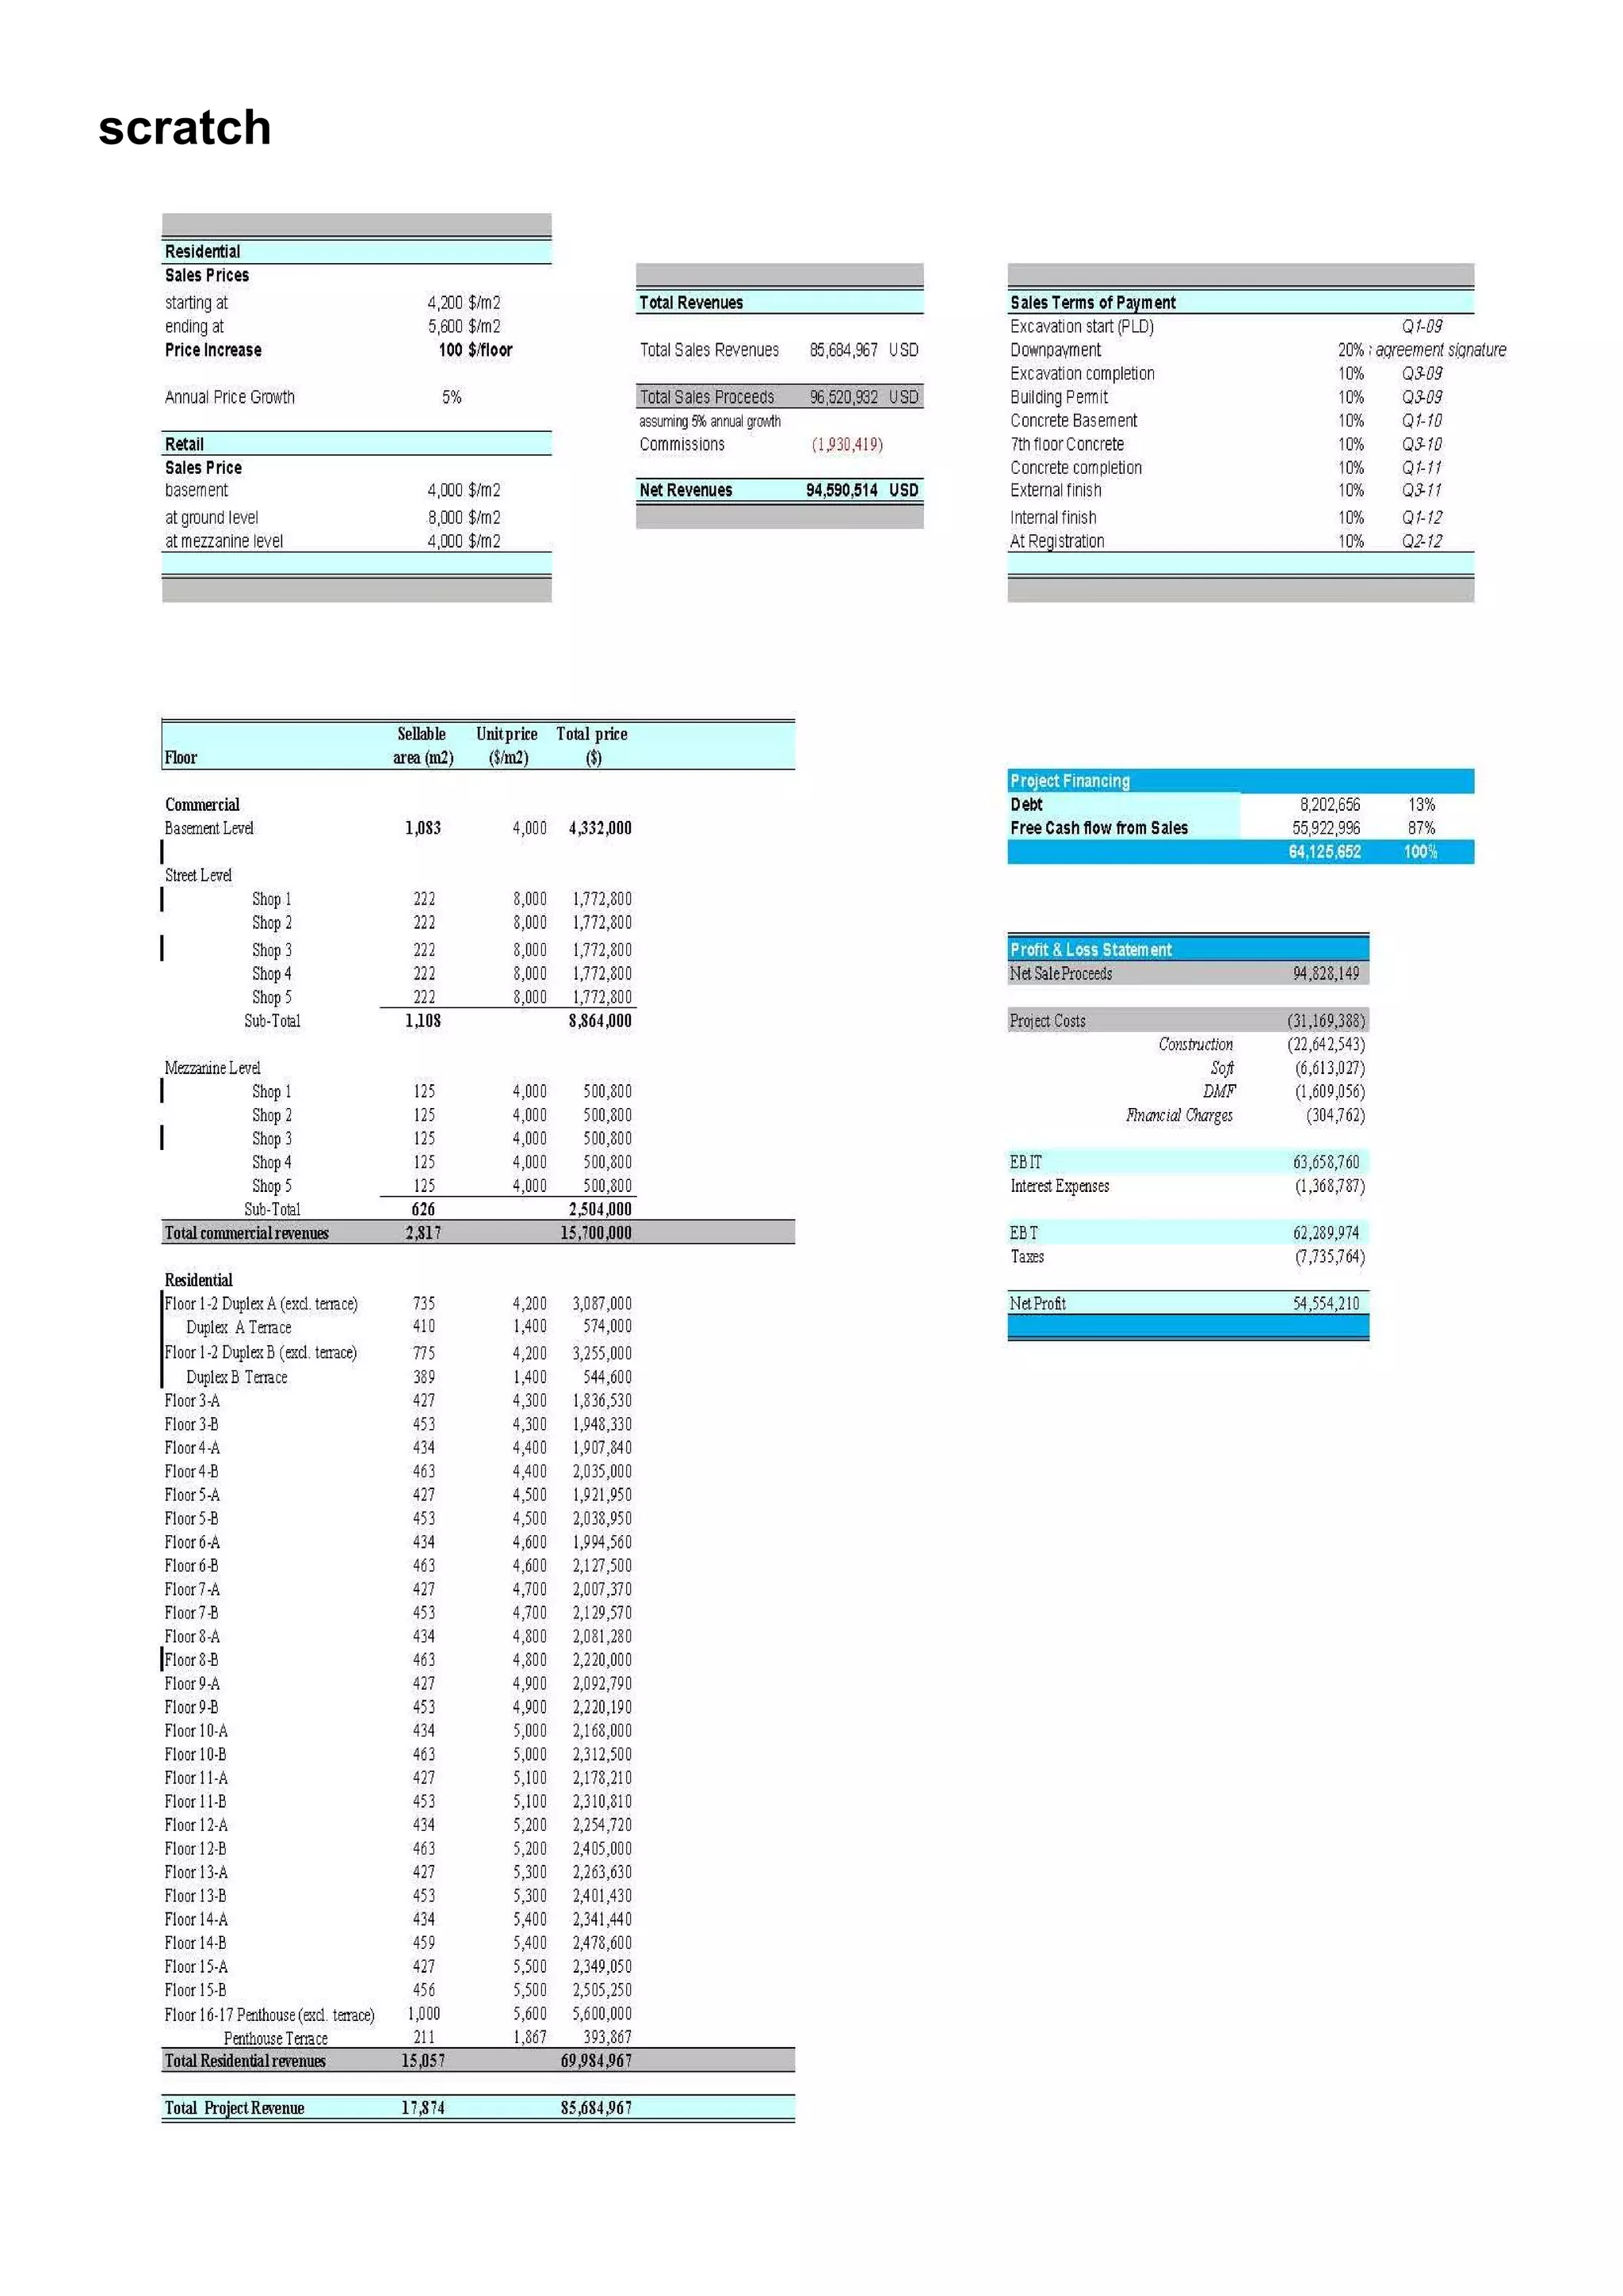
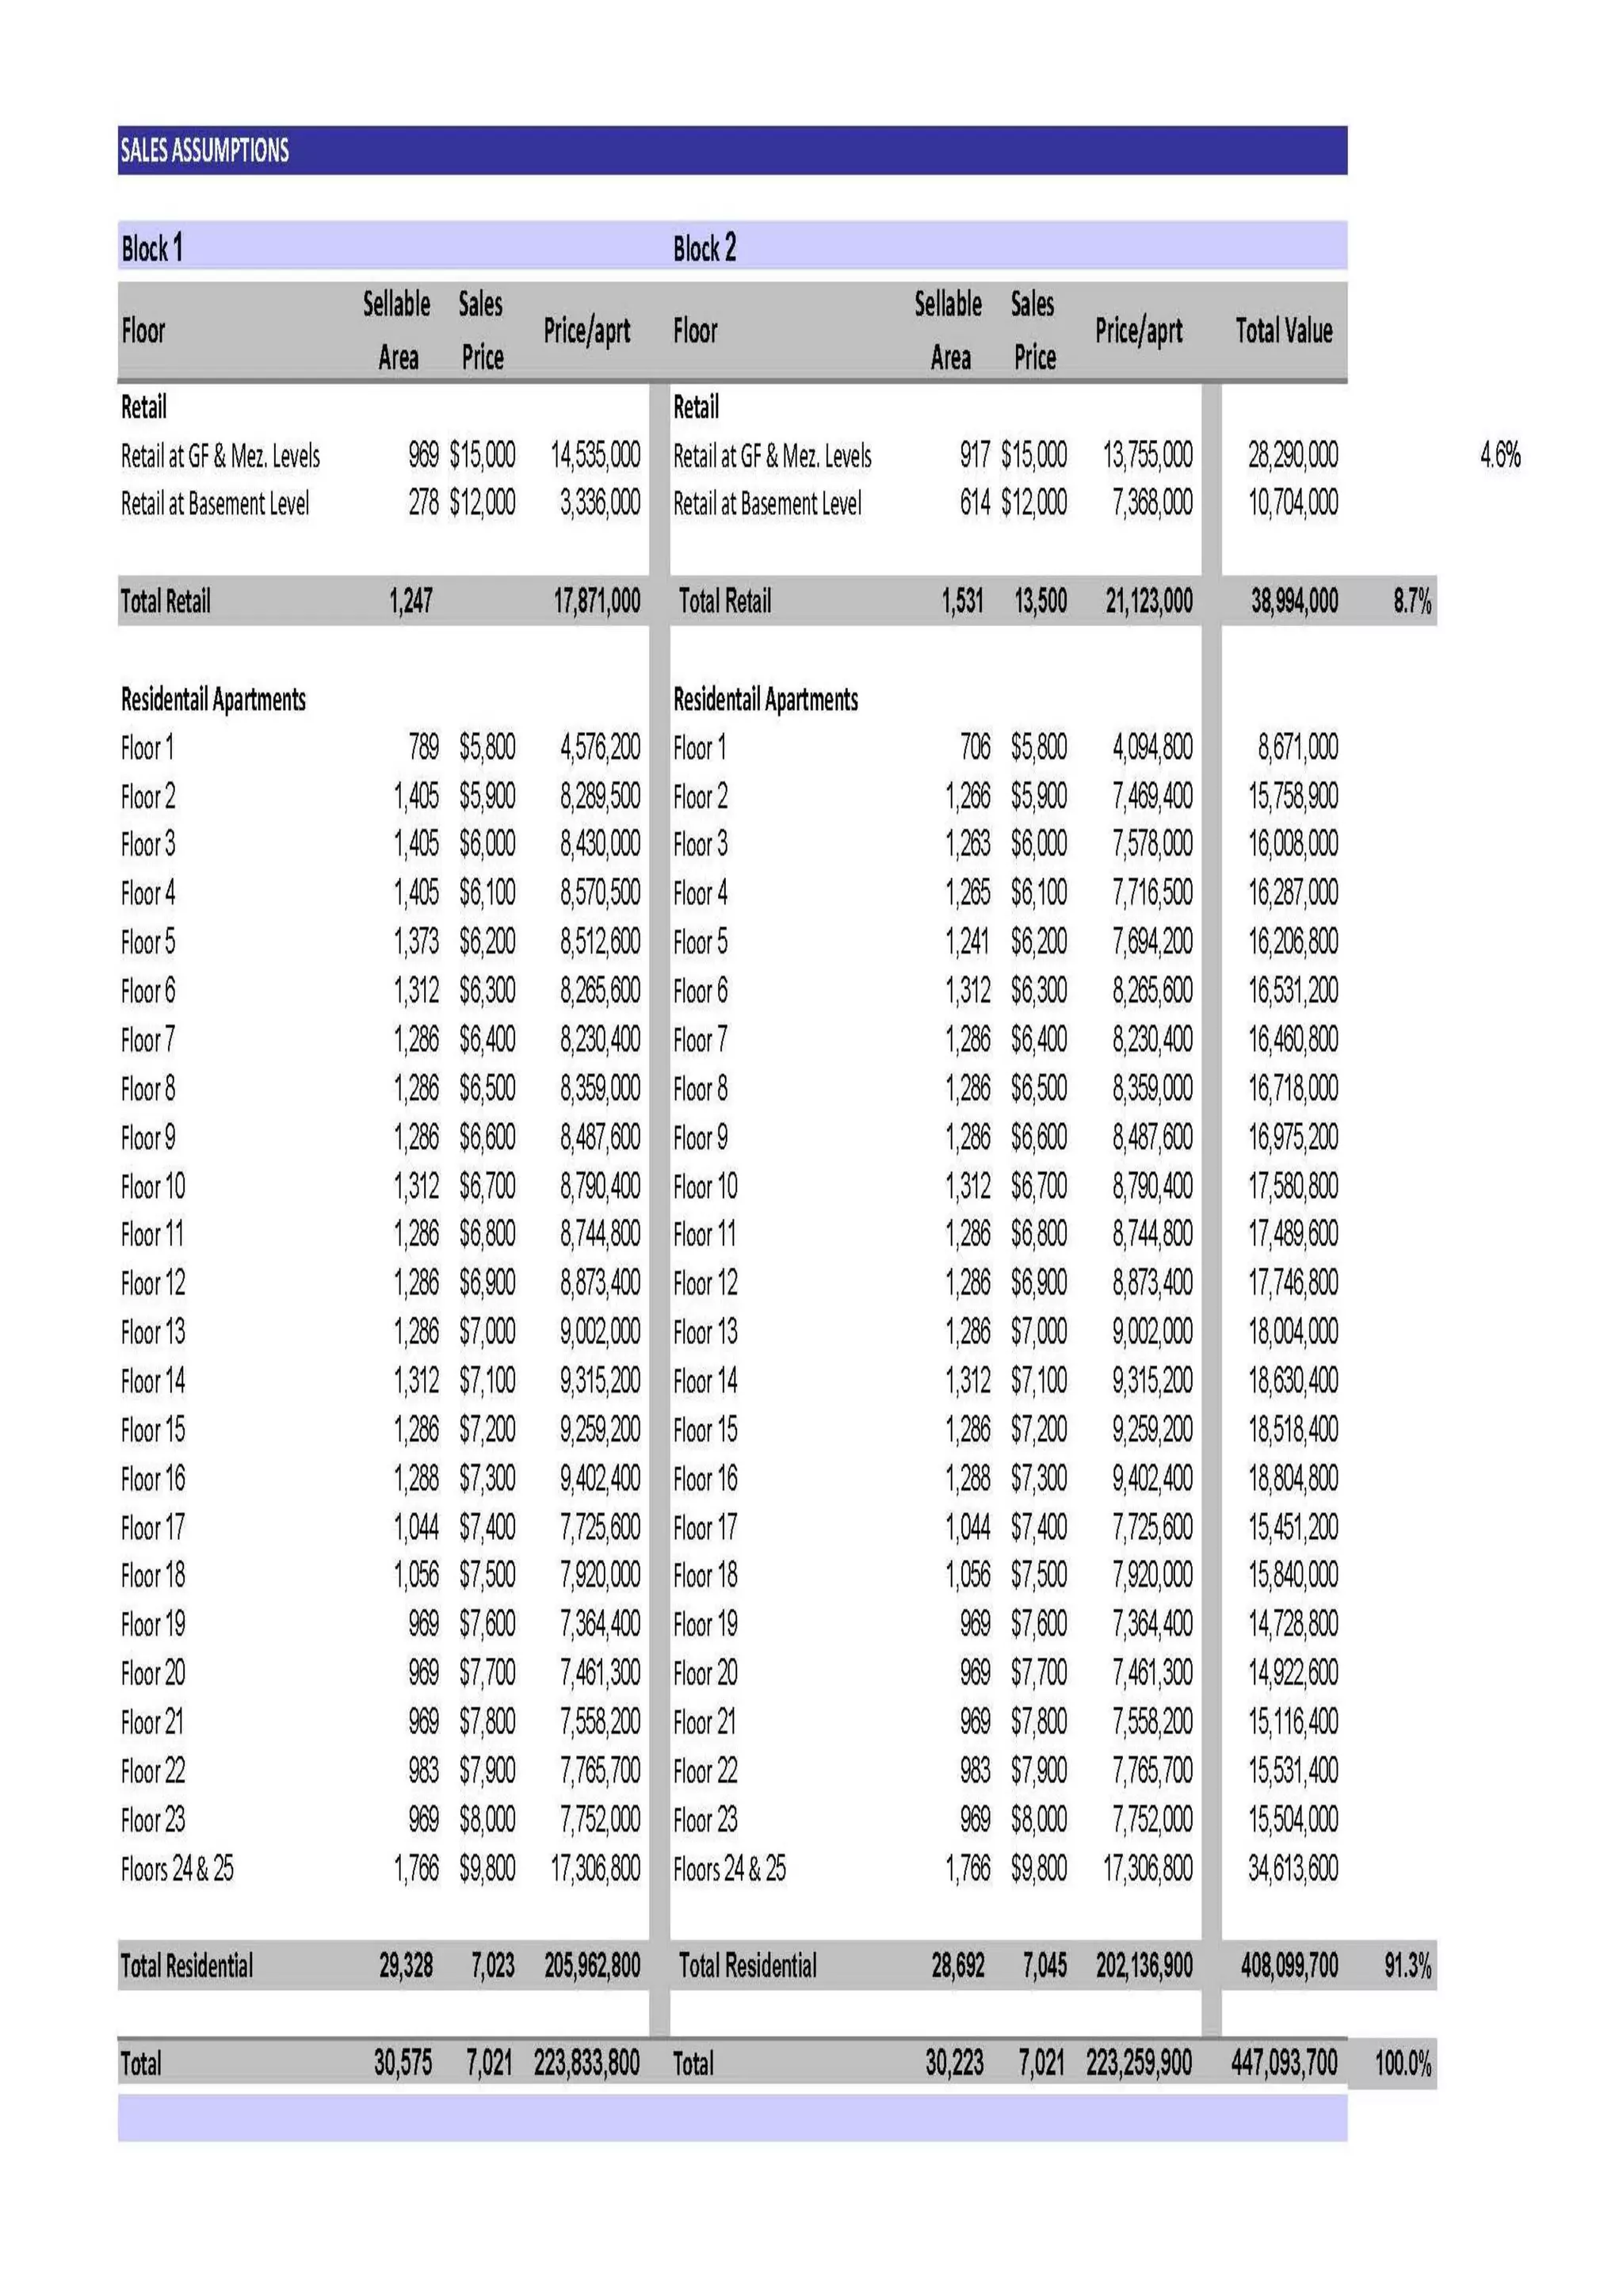
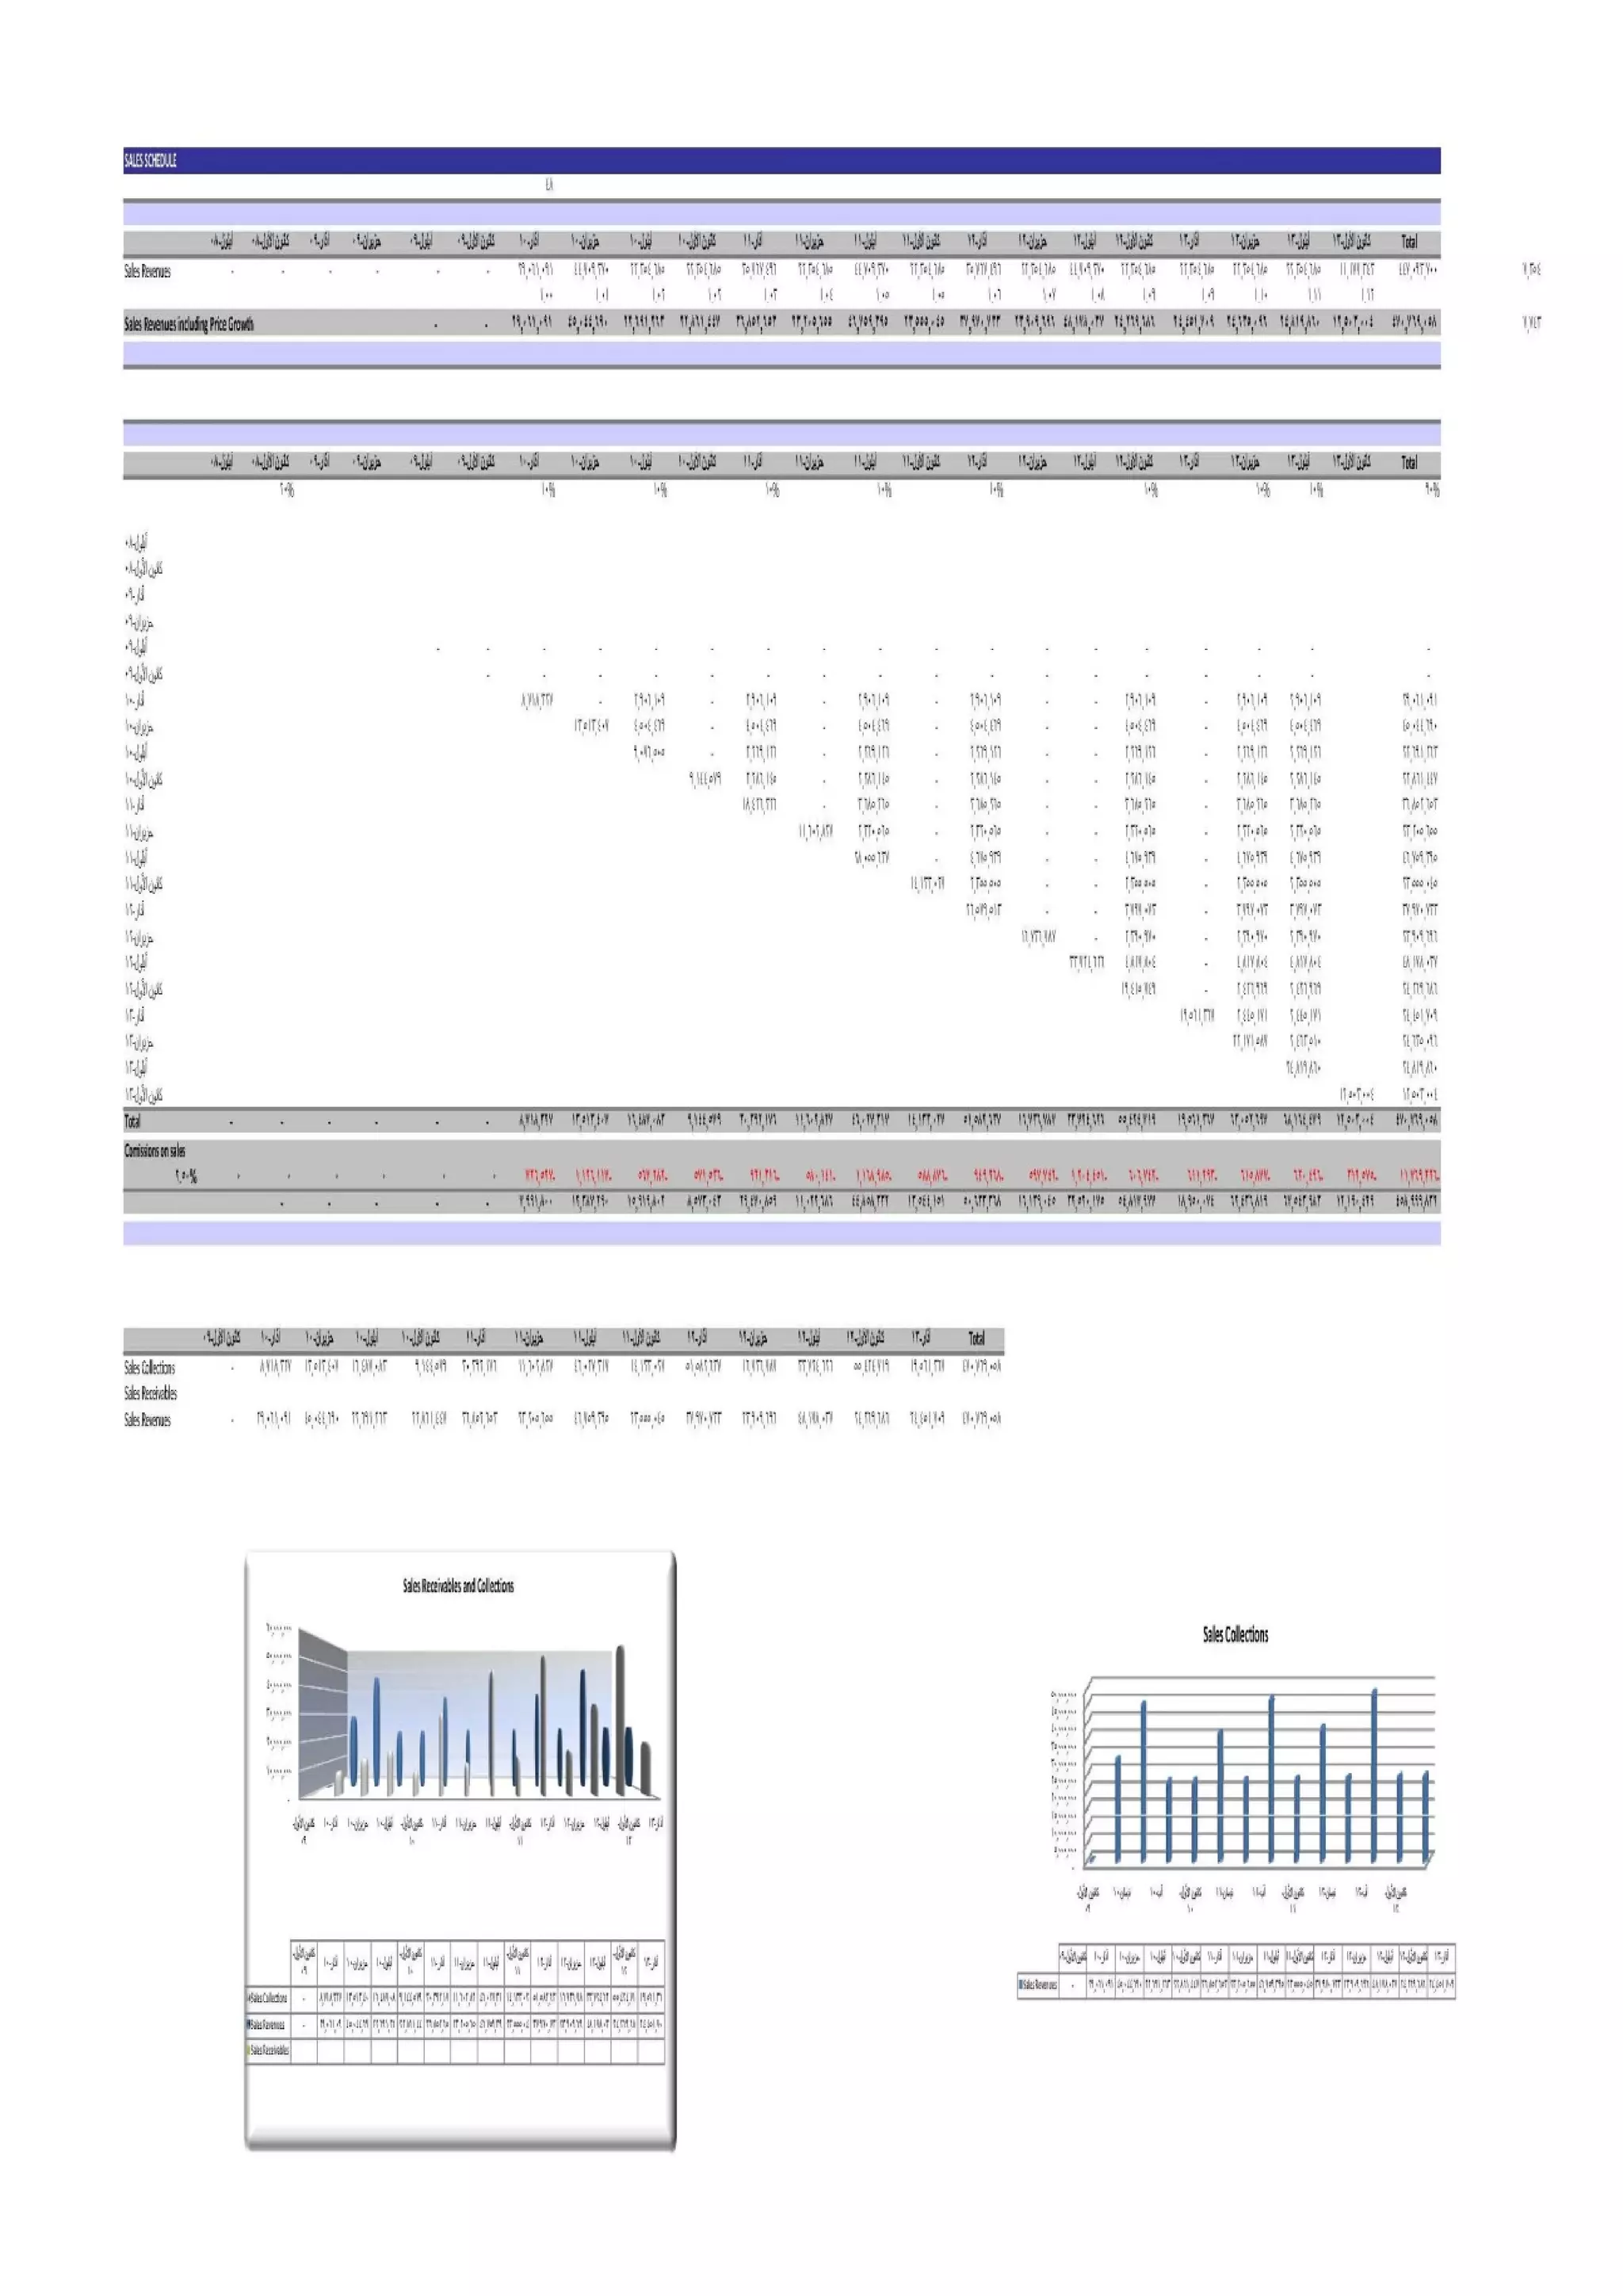
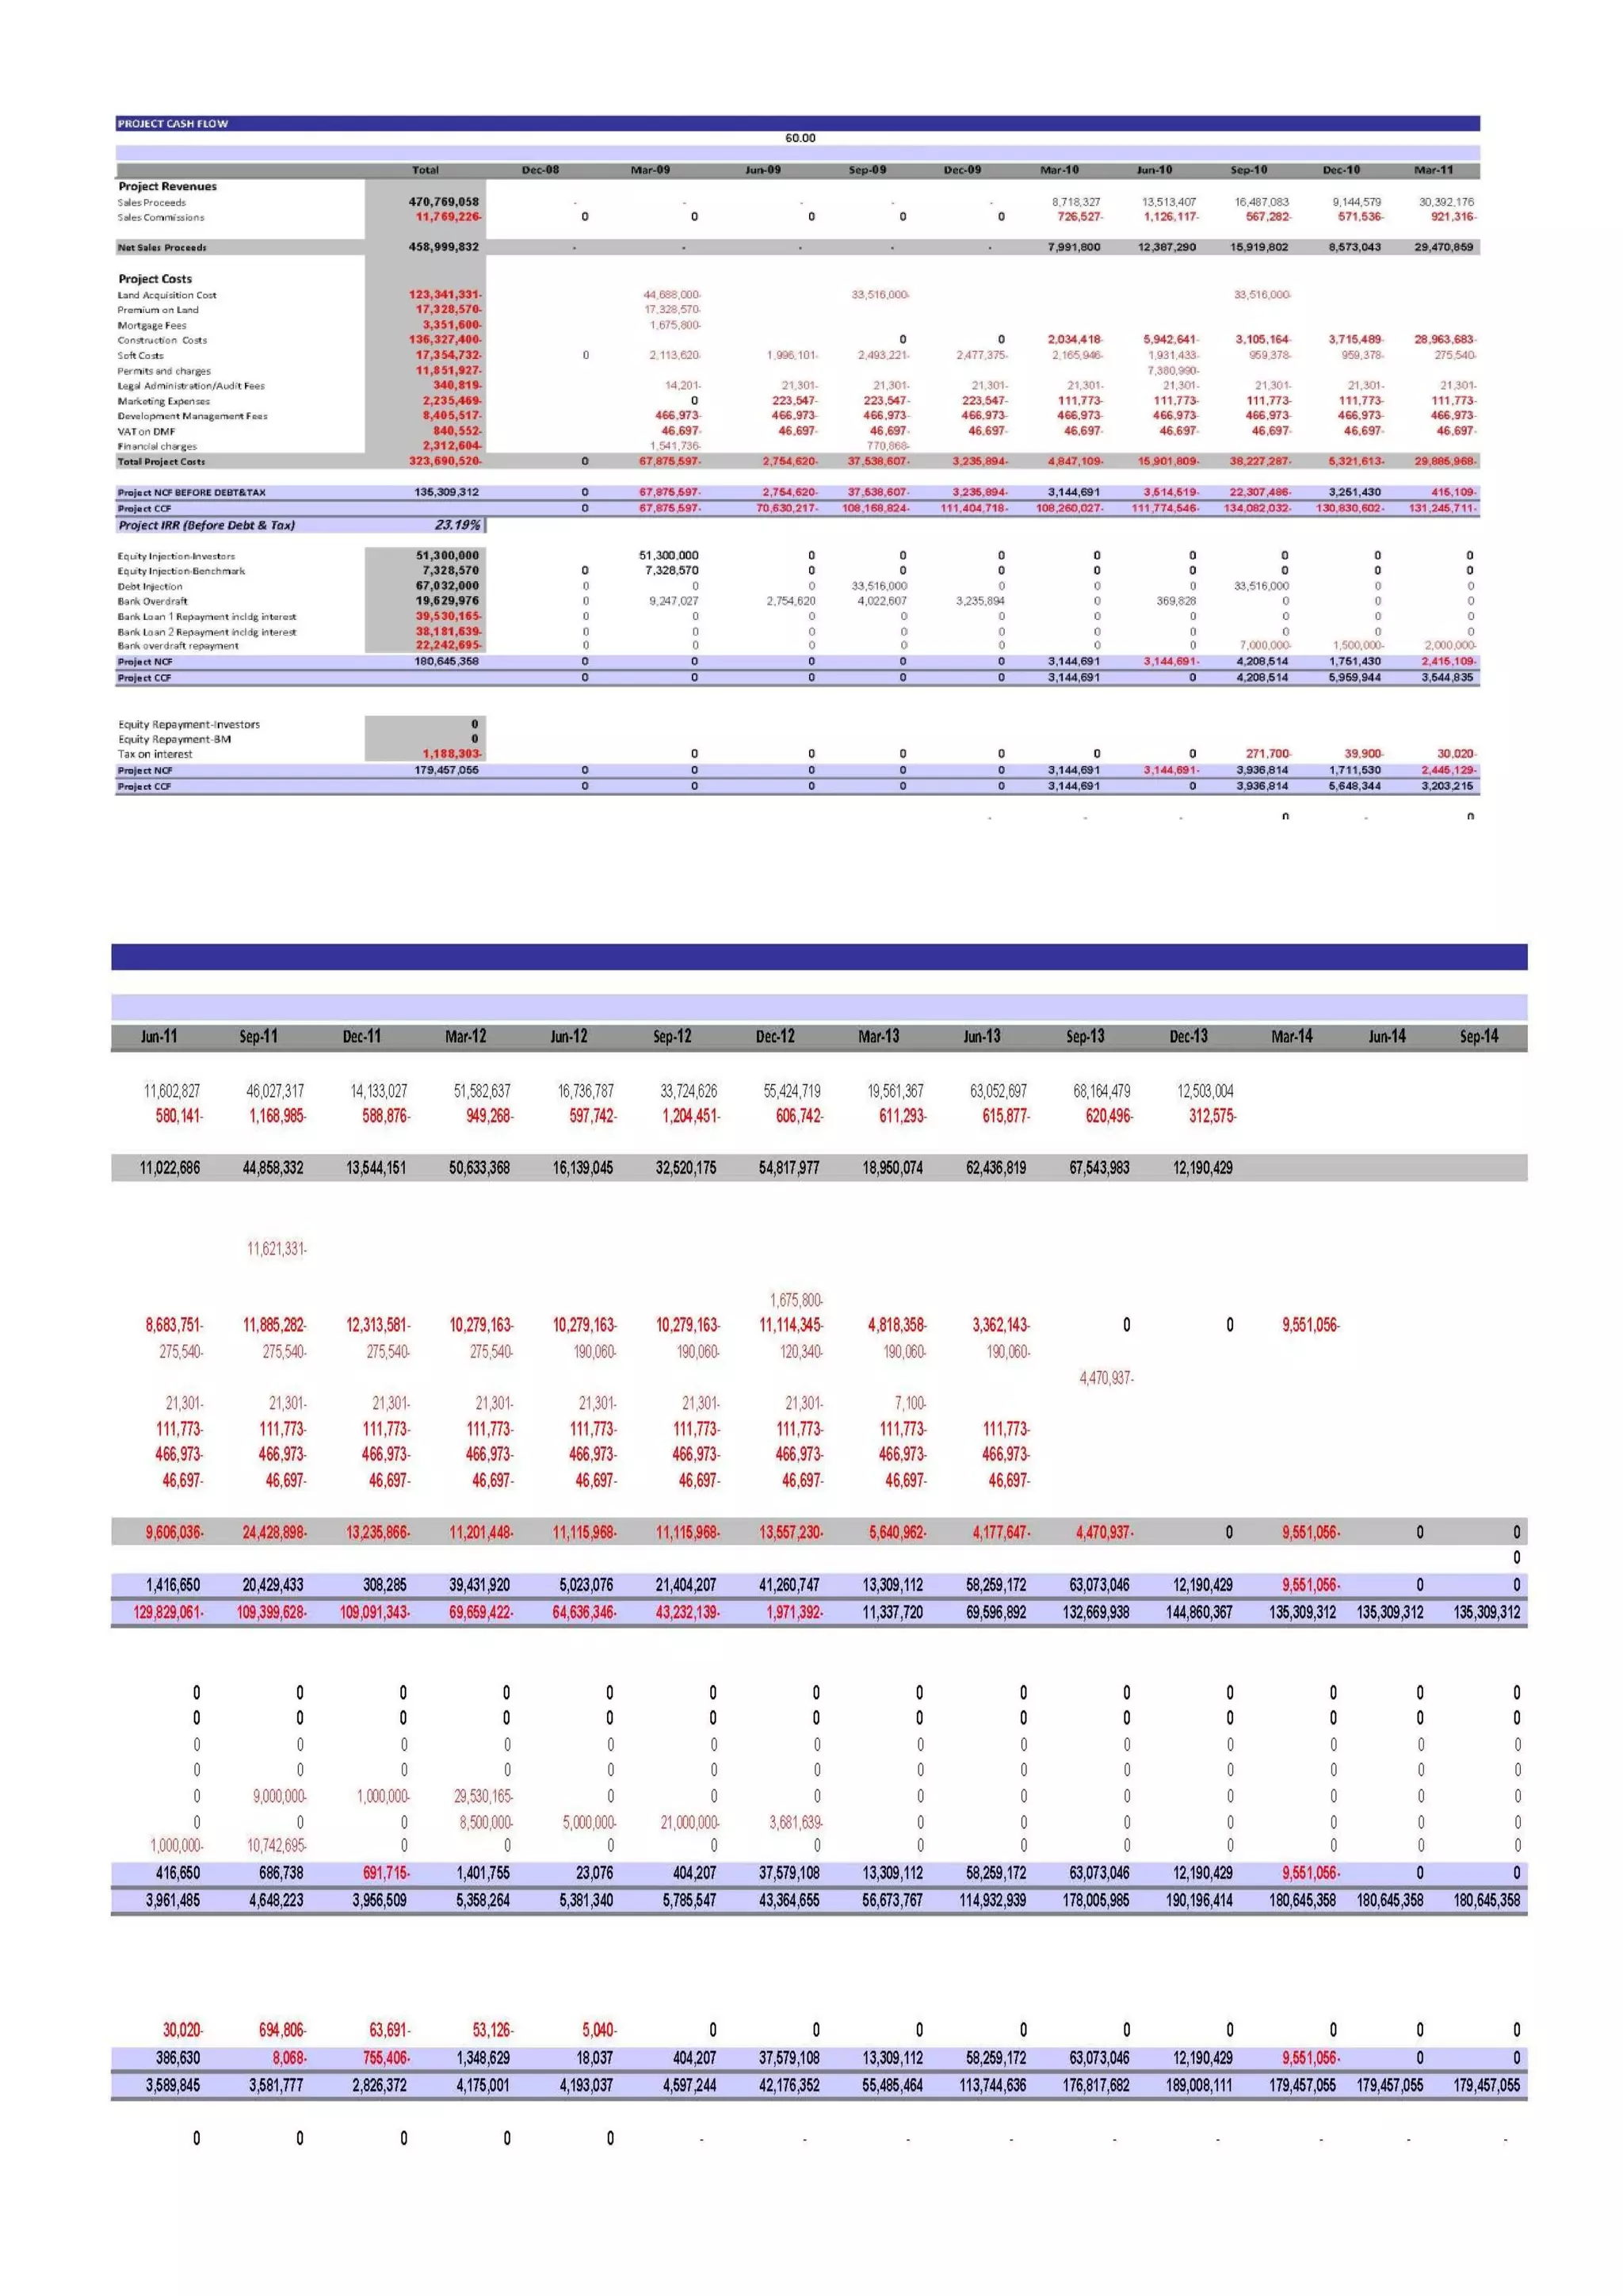
3) Revenue projections estimate earning $15 million from unit sales over 5 years, resulting in a profit of over $5 million after costs and financing.