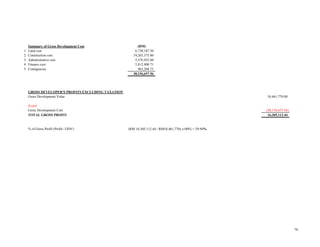
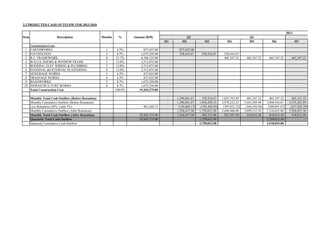
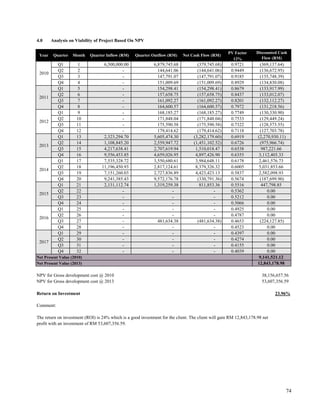
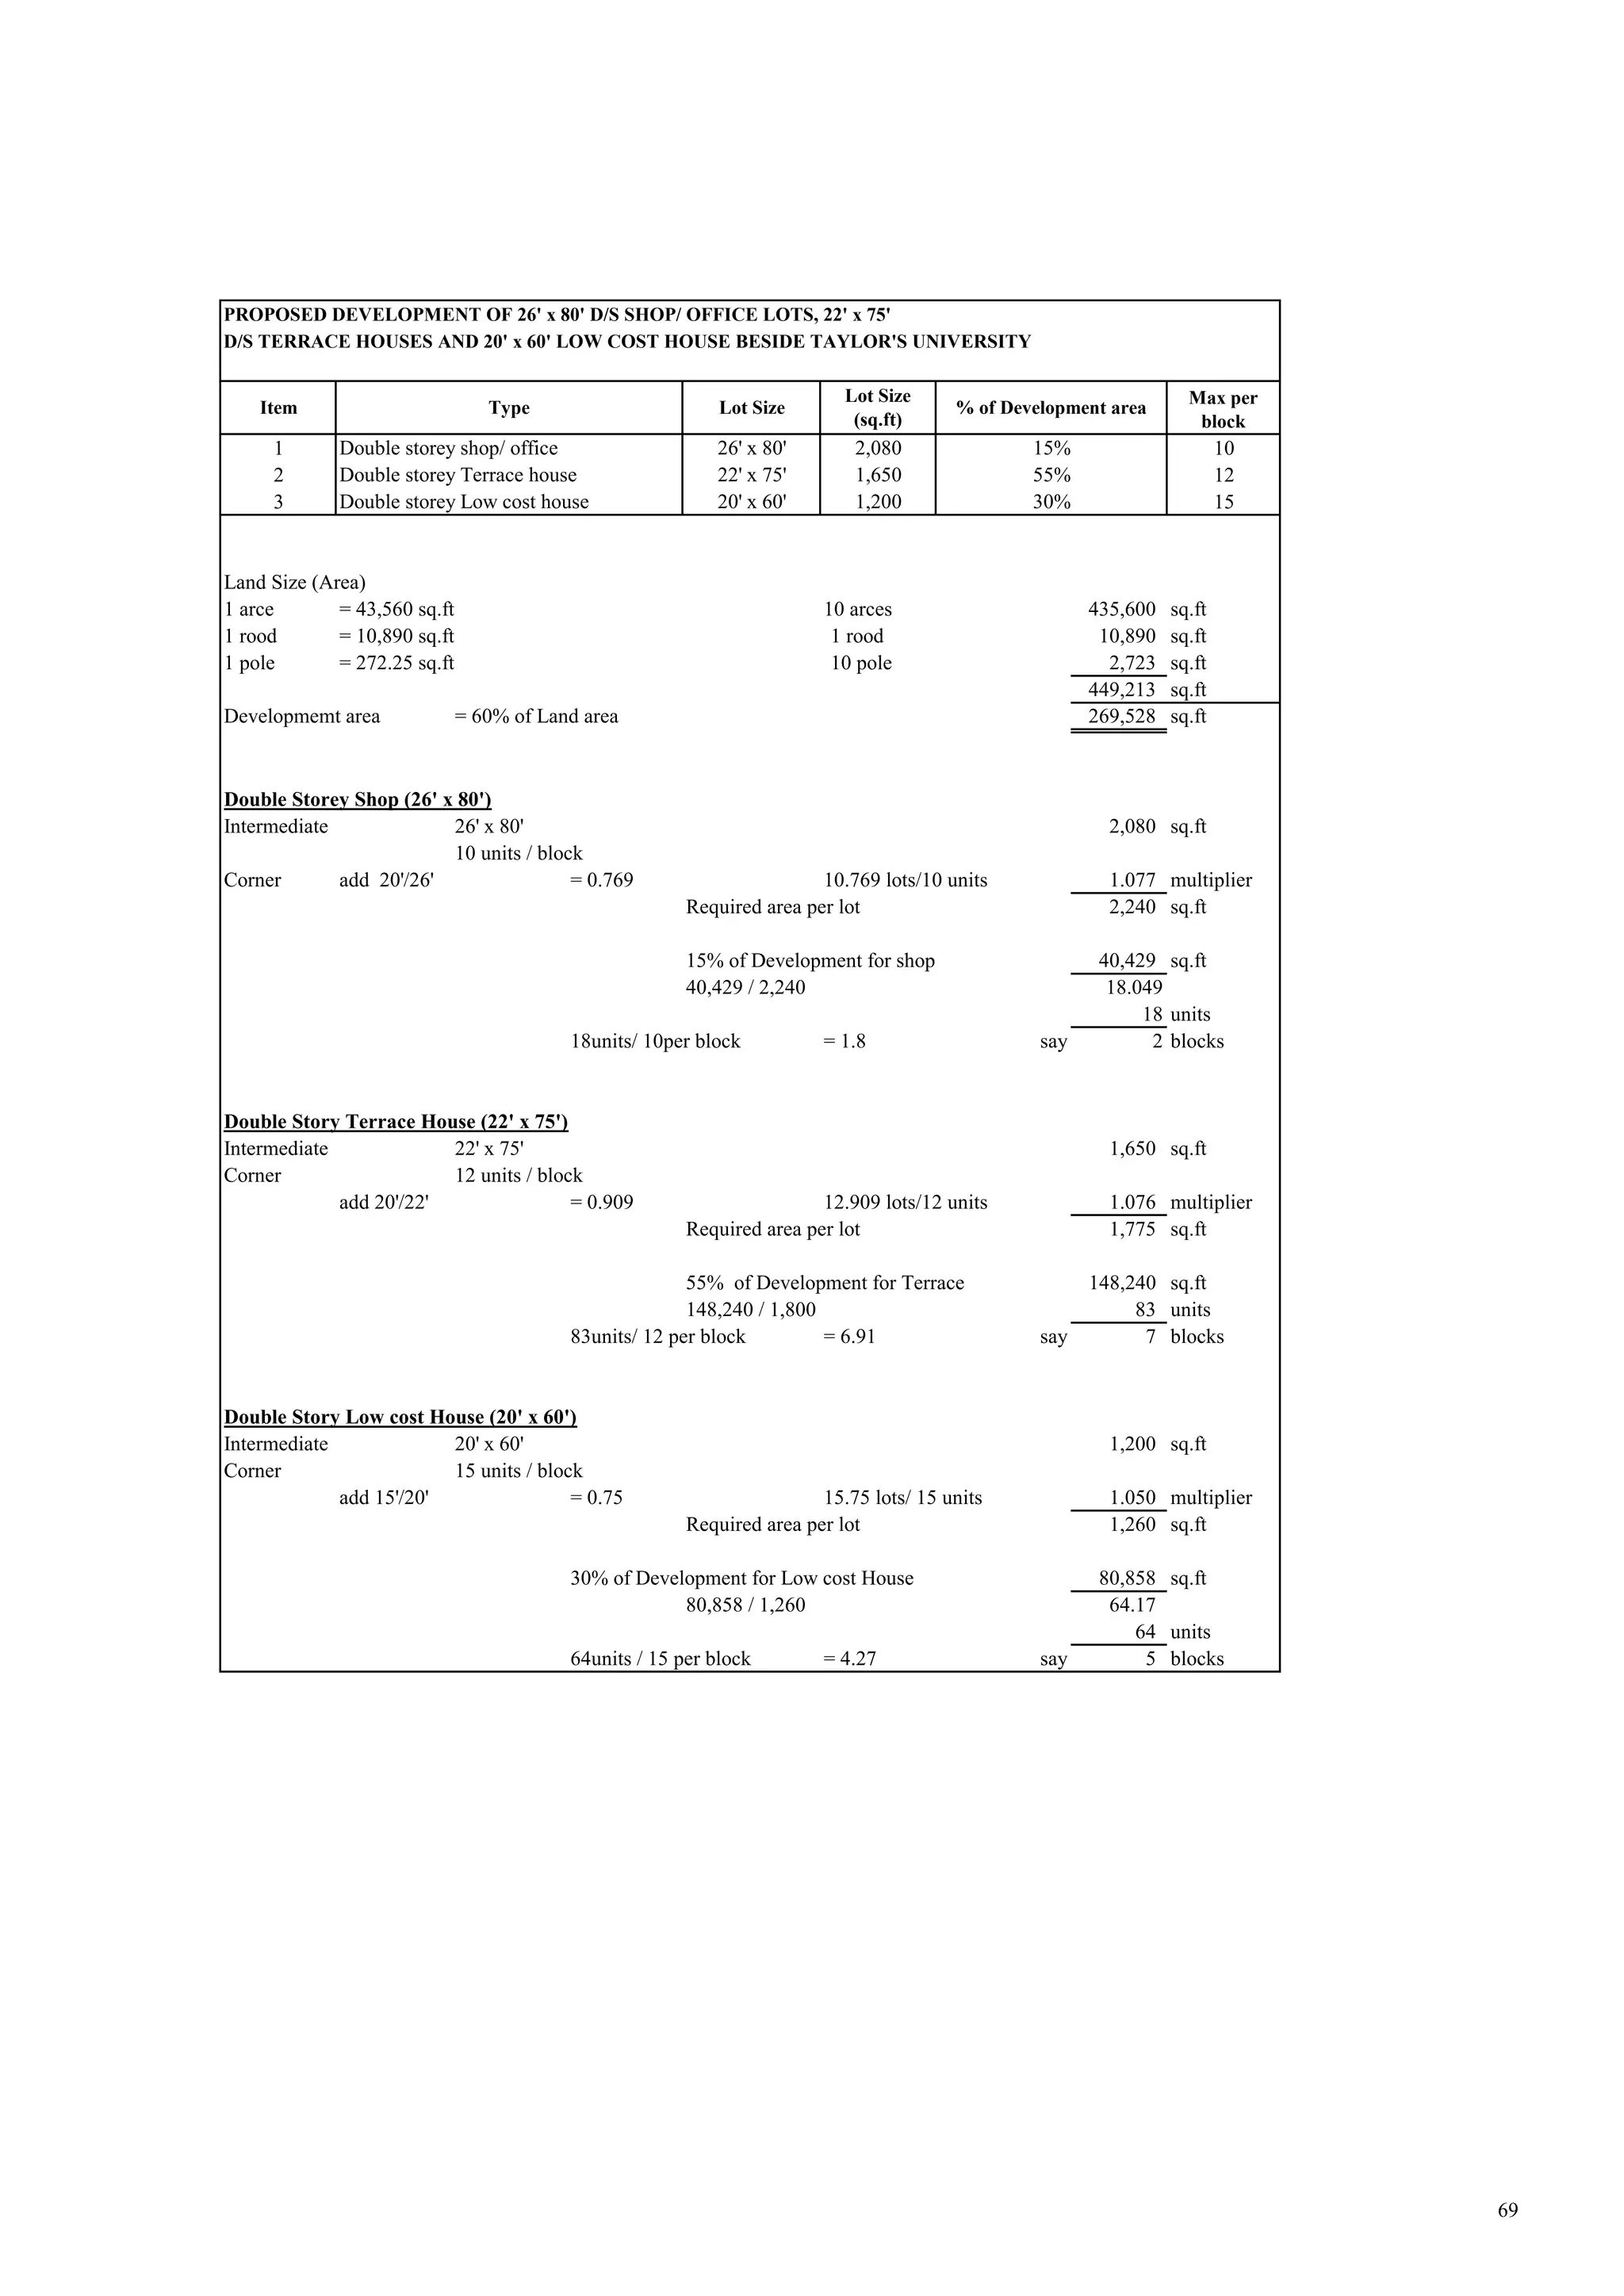
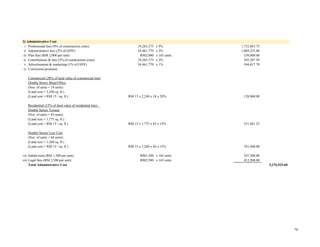
The document proposes developing 26' x 80' double-storey shop/office lots, 22' x 75' double-storey terrace houses, and 20' x 60' low-cost houses on a 10-acre land beside Taylor's University. It includes details of the proposed development such as the number and size of units, land size calculations, percentage allocation for each type of development, and a financial appraisal of the development costs and projected profits. The development is estimated to cost RM38.2 million and projected to generate a gross profit of RM16.3 million, representing a 30% return on the RM54.5 million estimated gross development value.

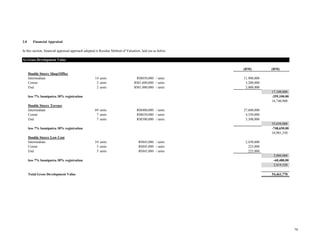
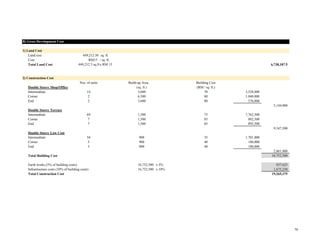
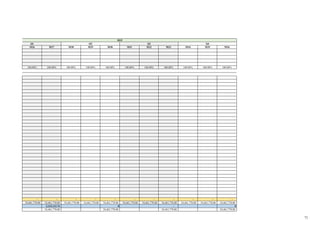
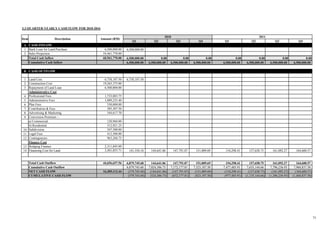
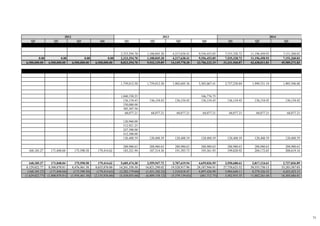
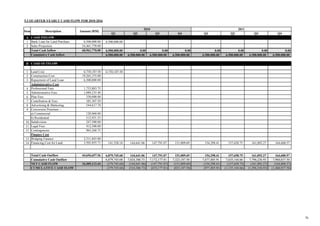
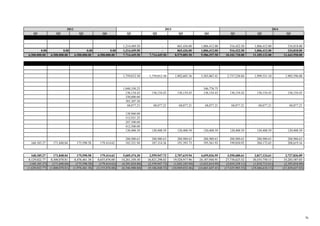
![i Financing Cost for Land
(Loan = RM 6,500,000)
(Interest = 2.5% p.a. + 6.5% BLR)
(Compound interest = [(1 + i)ⁿ - 1]) [(1+0.09)⁵-1] x RM 6,500,000 3,501,055.71
ii Bridging Finance
(Construction cost = RM 19,265,375)
(Interest = 5.5% p.a. + 6.5% BLR)
(Assuming loan of 50%) (RM 19,265,375 x 50%) x 12% x 2 2,311,845.00
Total Finance Cost 5,812,900.71
Contigencies (5% of construction costs) 19,265,375 x 5% 963,268.75
TOTAL GROSS DEVELOPMENT COST 38,156,657.56
5) Contigencies
4) Finance Cost
70](https://image.slidesharecdn.com/decalculationsfinalisedandfinalised8-6-18-180622055556/85/Project-Management-and-Development-Economics-Project-DE-5-320.jpg)